The development of the GC-MS analytical method used for the determination of the isotope ratio of linalool in yuzu essential oil from different geographic origins
Bạn đang xem bản rút gọn của tài liệu. Xem và tải ngay bản đầy đủ của tài liệu tại đây (681.23 KB, 5 trang )
Physical Sciences | Chemistry
The development of the GC-MS analytical method
used for the determination of the isotope ratio of linalool
in yuzu essential oil from different geographic origins
Thi Thao Nguyen1* and Masayoshi Sawamura2
School of Biotechnology and Food Technology, Hanoi University of Science and Technology
2
Faculty of Agriculture, Kochi University
1
Received 6 April 2017; accepted 16 August 2017
Abstract:
Introduction
A refined analytical method has been
developed for the determination
of the isotope ratio of oxygenated
compounds in essential oils, using
high-resolution gas chromatographymass spectrometry (HRGC-MS),
has been developed. Thirty-three
samples of yuzu fruits from different
production areas in Japan and South
Korea were collected and prepared
for cold-pressed peel oils. The oils
were analysed by HRGC-MS for
linalool concentration and isotope
ratio based on the peak intensities
of (M+2)+, (M+1)+ and M+ ions. A
significantly lower isotope ratio
m/z 156/154 and m/z 155/154 were
observed for the yuzu essential oil
from Goheung and Kyoto areas.
Statistical analysis showed the isotope
ratio of linalool to be useful in the
discrimination of yuzu essential oils
from different geographical origins.
Food authenticity is a term which
simply refers to whether the food
purchased by the consumer matches
its description. There are a number of
consumer-driven forces for reliable
analytical methods to verify the
provenance of the food we eat and
there is growing enthusiasm amongst
consumers for high-quality foods with
clear regional identities. It is reasonable
to suggest that there should be analytical
methods in place that can verify the
information provided on origin labels
describing the origins of foods.
Keywords: essential oil, GC-MS,
geographical origin, isotope ratio,
linalool, yuzu.
Classification number: 2.2
The stable isotope ratio of
constituents is among the many criteria
that have been used as discriminators
of food authenticity [1, 2]. Naturally
abundant isotope ratios of elements
exist in a fixed ratio; however,
many natural phenomena, classed as
physicochemical effects, can also lead to
isotope fractionation. The stable isotope
ratios of water (oxygen and hydrogen),
therefore, can yield unique geographic
information [3], primarily because
of the predictable spatial variation of
precipitation stable isotope ratios across
the Earth’s surface [4, 5]. This spatial
variation in precipitation composition is
recorded in plant material since plants
take up soil and water, which is derived
generally from local precipitation and
incorporates the hydrogen and oxygen
atoms into the products needed for
Corresponding author: Email:
*
20
Vietnam Journal of Science,
Technology and Engineering
september 2017 l Vol.59 Number 3
photosynthesis [6]. This distinction of
isotope content can be transferred to
plants, creating an isotopic “fingerprint”
for geographical characteristics of
vegetation. The stable isotope content
is determined by isotope ratio mass
spectrometry (IRMS) and site-specific
natural isotope fractionation determined
by nuclear magnetic resonance (SNIFNMR). These instruments, however, are
expensive and rare in normal food and
flavour analysis laboratories.
Gas
chromatography-mass
spectrometry
(GC-MS)
is
an
indispensable analytical instrument for
analysing food and flavour compounds,
especially for analysing volatile
compounds. Sawamura, et al. have
developed a new analytical method for
the differentiation and characterization
of citrus essential oils derived from
different species and producing areas
found on the basis of isotope ratio.
The isotope ratio is determined based
on the isotope peak and molecular
peak of monoterpene hydrocarbons. A
combination of the determination of
the isotope ratio of multi-components
and multivariate analysis results in
good discrimination of citrus essential
oils of different botanical [7, 8] and
geographical origins [9].
In the essential oils of citrus species,
oxygenated compounds account for a
small but important fraction of keynote
compounds. Among the oxygenated
compounds, linalool is a main
Physical Sciences | Chemistry
carrier gas at a flow rate of 0.8 ml/min.
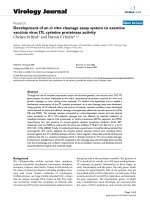
Determination of isotope ratio of
linalool by GC-MS
Fig. 1. The biosynthetic pathway of linalool from geranyl pyrophosphate (GPP).
oxygenated compound found in citrus
essential oil [10]. Naturally, linalool is
synthesised from the universal precursor
geranyl pyrophosphate (GPP), catalysed
by a membrane-bound enzyme, linalool
synthase (Fig. 1) [11]. During this
biosynthesis process, water is attached
to the carbon frame and therefore, it is
expected that it brings in an isotope ratio
of hydrogen and oxygen, and thusly,
the geographical information of isotope
ratio. However, the determination of the
isotope ratio of oxygenated compounds
via current methods is challenging
due to the weak signal strength of the
isotope and molecular peaks. In this
study, we designed a new approach to
the determination of the isotope ratio
of oxygen in order to find an additional
analytical parameter to be used for the
discrimination of essential oils and fruits
from different origins. Yuzu (Citrus
junos Tanaka), an important sour citrus
fruit in Japan, and is especially found in
Kochi prefecture, was investigated. Yuzu
essential oils were derived from different
producing areas in Japan and Korea, and
were analysed for their isotope ratios
through means of HRGC-MS.
Materials and methods
Materials
Authentic linalool was obtained
from Tokyo Kasei Kogyo Co. Ltd.
Standard solutions of linalool were
prepared at different concentrations with
purified acetone (purity ≥ 99.8%, Kanto
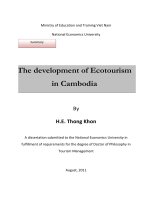
Chemical Co., Inc.). 33 samples of yuzu
were collected from Japan and South
Korea (Fig. 2). The essential oil was
prepared using the cold-pressing method
to isolate citrus essential oils [12].
Fig. 2. Yuzu Sampling in Japan and
Korea.
GC-MS
Analysis was carried out using
a GC-6890N instrument (Agilent
Technologies)
coupled
with
a
JMS-Q1000 GTA mass spectrometer
(Jeol Datum) at an MS ionization energy
of 70 eV; detector voltage, 1000 V;
ionization current, 100 mA; and ion
source temperature of 250°C. The GC
column was a DB-Wax fused-silica
capillary type (60 m × 0.25 mm i.d., 0.25
µm film thickness; J & W Scientific,
Folsom, CA, USA). To determine the
linalool peak relative percentage, scan
mode was used. An oil sample of 1 µl,
which had been diluted with acetone
(1:5), was automatically injected at
a split ratio of 1:100. The column
temperature was programmed from
70°C (2-min hold) to 100°C at a rate of
2°C/min and then heated to 230°C (held
for 15 min) for sterilisation at the end
of each run. The injector temperature
was 250°C, and helium was used as the
Isotope ratio is defined as the ratio of
the concentration of ions in an isotope
and molecular peak, directly observed
by the signal area of ions’ peak in the
mass spectrometry (MS). The selected
ion monitoring mode (SIM) was
employed to enable the sensitivity of
MS analyses. Three ions of linalool were
determined for ion concentrations: the
molecular ion (M+): m/z 154, the isotope
ion (M+1)+: m/z 155 and (M+2)+: m/z
156. An optimised condition of MS was
developed because the signal strength
of an isotope peak m/z 156 is difficult
to observe under normal analytical
conditions. An oil sample of 1 µl, which
had been diluted with acetone (1:5), was
automatically injected at a split ratio of
1:10. The ion source temperature was
150°C; ionisation current, 200 mA;
the detector voltage, 1500 V; and the
scanning rate of m/z 154 ion and m/z 155
ion was 50 cycles per second, while that
of m/z 156 was 900 cycles per second.
The isotope ratio (Ir) was calculated
using the following equation:
where: the isotope peaks were m/z
155 and m/z 156, respectively; and the
molecular peak was m/z 154. Each value
is the mean of replicate measurements of
isotope ratio values.
Statistical analysis
All measurements were carried out
in triplicate so that an average value
and standard deviation of the isotope
value could be calculated to evaluate
the repeatability of the method. Analysis
of variance (one-way ANOVA) was
conducted to differentiate samples by
means of the isotope ratio values. All
statistical analyses were done using
SPSS software for Windows (version
11.5, SPSS, Chicago, 2002).
september 2017 l Vol.59 Number 3
Vietnam Journal of Science,
Technology and Engineering
21
Physical Sciences | Chemistry
Results and discussions
Accuracy of the isotope ratio by
ordinary GC-MS
In principle, it is possible to obtain
the isotope ratio from MS data [13]. The
isotope peak contains the total isotopic
abundance in the molecule. Authors have
previously shown, in fact, a practical
use for the isotope ratio of monoterpene
hydrocarbon from mass spectrometry
[7-9, 14]. However, the determination of
isotope ratio in oxygenated compounds
was difficult since the intensity of each
molecular ion peak is not very strong
after undergoing the fragmentation due
to ionisation process of MS. In addition,
the isotope peak (M+1) is approximately
10%, whereas the isotope peak (M+2)
is approximately 1%, respectively, and
of those observations, the molecular
ion peak in the case of linalool in citrus
essential oils is seen. Therefore, several
experimental conditions have been
developed to achieve a sensitivity of
the analytical method for determining
isotope ratio value. By choosing the
softer ionisation energy (50 eV), suitable
detector voltage, and scanning rate
of the monitored ion, the desired ion
peaks were enabled since optimisation
of the analysis device and the analysis
condition was attempted in the actual
experiment. The mass peaks observed
in the mass spectrum are m/z 154 (M)+,
m/z 155 (M+1)+, and m/z 156 (M+2)+.
When taking the ratio of those peak
intensities, the isotope ratio m/z 155/154
accordingly gives the total ratios of
13
C/12C, 2H/1H, and also 17O/16O; and
the isotope ratio m/z 156/154 gives
information on 18O/16O and 13C/12C.
The repeatability of the Ir values for
linalool was examined using different
linalool solutions. The concentrations of
standard linalool solutions were 5 to 30
mg/g (w/w). Data is shown in Table 1,
the isotope ratio m/z 155/154 varied from
11.50 to 11.60% whereas the isotope
ratio value m/z 156/154 was 1.00%.
These Ir values varied within a narrow
range and in accordance with theoretical
calculations from natural abundances
22
Vietnam Journal of Science,
Technology and Engineering
Table 1. The isotope ratio (%) of authentic linalool solutions at different
concentrations.
m/z 156/154
Linalool concentration
mg/g (w/w)
Mean
5
m/z 155/154
SD
Mean1
SD
1.10
0.02
11.64
0.06
10
1.06
0.05
11.59
0.05
15
1.11
0.03
11.52
0.04
20
1.09
0.02
11.50
0.02
25
1.11
0.03
11.54
0.01
30
1.09
0.01
11.55
0.01
1
n=5.
1
Fig. 3. GC chromatogram of yuzu essential oil by capillary GC-MS and MS
spectrum of linalool.
of isotopes of carbon, hydrogen, and
oxygen. The results obtained from the
authentic linalool solution show that the
reproducibility for determining the peaks
of the molecular ion and its isotope using
ordinary GC-MS is satisfactory and is
applicable for practical use.
The repeatability, evaluated on
relative chromatographic peak areas of
the standard linalool solution using ten
replicates that were analysed in the same
day, was 3.1%. The reproducibility,
calculated using five replicates of the
same solution analysed in different
days, was 8.8%. The limits of detection
and the limits of quantitation were
calculated from the concentration that
would give up to three and ten times,
respectively, and were also reported. The
limit of detection (LOD) and limit of
quantification (LOQ) were determined
from a series of low-concentration
measurements
of
the
authentic
linalool calibration solutions. The data
september 2017 l Vol.59 Number 3
processing was proved under SIM mode
to increase the specificity and sensitivity
of the measurement. However, since
the isotope peak of linalool was small
compared to the molecular peak, we
need to determine the isotope peaks
m/z 155 (M+) and m/z 156 (M2+) so the
detection limit was dependent on the
appearance of those isotope peaks. The
resulting LOD and LOQ were 10 and 35
mg/kg, respectively.
The isotope ratios of linalool in yuzu
essential oils from different producing
areas
A proper separation of linalool from
other volatile compounds of the essential
oil is a prerequisite to the determination
of isotope ratio value. The linalool
fraction was well separated from the
other volatile compounds in the yuzu
essential oil by employing appropriate
column and column temperature
program. The investigated compound
Physical Sciences | Chemistry
Table 2. Relative peak area percentage (%) and isotope ratio of linalool from
yuzu essential oils.
No
1
Isotope ratio (%)
Relative
peak area (%)
Sample1
EH1
m/z 155/154
3.04
m/z 156/154
Mean2
SD
Mean2
SD
14.35
0.49
1.02
0.01
2
EH2
2.19
12.91
0.06
0.91
0.00
3
EH3
1.97
12.38
0.09
0.88
0.00
4
OT1
2.95
14.46
0.63
1.03
0.02
5
OT2
2.31
13.24
0.09
0.95
0.01
6
OT3
2.24
13.28
0.13
0.94
0.02
7
WK1
2.90
14.78
0.17
1.04
0.02
8
WK2
2.36
13.54
0.03
0.96
0.01
9
WK3
2.61
13.83
0.13
0.98
0.01
10
TK1
2.71
14.07
0.60
1.00
0.02
11
TK2
2.59
13.86
0.14
0.98
0.01
12
TK3
2.58
13.84
0.09
0.98
0.01
13
KC1
2.98
13.05
0.69
0.88
0.18
14
KC2
2.14
12.59
0.35
0.90
0.01
15
KC3
1.72
11.77
0.19
0.83
0.00
16
KC4
1.25
10.84
0.06
0.91
0.17
17
KC5
1.28
10.89
0.12
0.92
0.16
18
KC6
1.27
11.45
0.05
1.10
0.01
19
KC7
1.31
11.10
0.66
0.94
0.03
20
KC8
1.28
10.67
0.05
0.97
0.05
21
KC9
1.24
10.71
0.09
0.97
0.04
22
KC10
1.28
10.76
0.20
0.92
0.05
23
KC11
1.31
10.76
0.10
0.97
0.03
24
KC12
1.28
10.69
0.09
0.96
0.02
25
KC13
1.18
10.78
0.06
1.05
0.07
26
KC14
1.32
11.13
0.73
0.96
0.01
27
KC15
1.35
10.69
0.17
0.94
0.03
28
KC16
1.40
10.64
0.02
0.96
0.04
0.03
29
KC17
1.38
11.08
0.03
1.00
30
KC18
1.46
11.04
0.61
0.94
0.00
31
KC19
1.46
10.93
0.04
0.99
0.01
32
KYO
2.55
11.61
0.02
0.93
0.04
33
GOH
3.58
11.53
0.04
0.91
0.06
Abbreviated name of samples: KC: Kochi; EH: Ehime; TK: Tokushima; OT:
Oita; WK: Wakayama; KYO: Kyoto; GOH: Goheung (Korea).
2
n = 3.
1
B
A
11.7
Isotope ratio (M+1)/M (%)
Isotope ratio (M+2)/M (%)
1.2
1.1
1.0
.9
11.5
11.4
11.3
11.2
.8
N=
11.6
6
3
1
19
1
3
3
3
AU
EH
GO
KC
KY
OT
TK
WK
Samples
N=
6
3
1
19
1
3
3
3
AU
EH
GO
KC
KY
OT
TK
WK
Samples
Fig. 4. Boxplot of isotope ratio (M+2)/M (A) and (M+1)/M (B) of linalool from
authentic chemicals and yuzu essential oils from different producing areas.
Samples from different areas are marked as Authentic chemicals, AU; Ehime, EH;
Goheung, GO; Kochi, KC; Kyoto, KY; Oita, OT; Tokushima, TK; Wakayma, WK.
was best separated on DB-Wax column
with high polarity. Fig. 3 shows the
linalool peak in the GC chromatogram
of yuzu essential oil under the actual
experimental condition.
Relative peak area and isotope ratio
of linalool from 33 yuzu essential oils
are shown in Table 2. The isotope ratio
m/z 156/154 of linalool in standard
solution and in yuzu CPO from different
producing areas is plotted in the boxplot
(Fig. 4). It is obvious that the standard
linalool has a significantly higher
isotope ratio value (mean Ir=1.10% with
SD=0.02%). The isotope ratio values
of linalool from yuzu samples which
were grown in Kochi (KC), Ehime
(EH), Oita (OT), Tokushima (TK), and
Wakayama (WK), were not different
from one another. The average isotope
ratio value ranged from 0.96 to 1.02%
with a standard deviation less than
0.6%. The isotope ratio of linalool in
GOH and KYO samples, on the other
hand, significantly lower than the other
yuzu samples. Ir values were 0.89 and
0.91% for GOH and KYO, respectively.
These differences can be explained by
the fact that authentic linalool from
which the compound was isolated and/or
synthesised was obtained from different
sources.
Conclusions
In conclusion, to the best of
our knowledge, the isotope ratio
of oxygenated compounds in yuzu
essential oils by HRGC-MS is reported
here for the first time. The analytical
method was developed and optimised
for the observation of linalool isotope
peaks and molecular peaks and showed
high repeatability. The isotope ratio
of linalool varied considerably among
the samples from different regions, but
could not readily be differentiated on the
basis of isotope ratio value alone. The
isotope ratio depends on the genealogy
and geographical factors of the plant
[6]. However, in this study, when all the
september 2017 l Vol.59 Number 3
Vietnam Journal of Science,
Technology and Engineering
23
Physical Sciences | Chemistry
samples were obtained from the same
botanical origin, the effect of genealogy
may be eliminated. Thus the isotope
ratio reflexes the effect of producing
area. The significant lower isotope ratio
of the samples from higher latitude is in
agreement of lower isotope ratio in the
region of higher latitude. This finding
suggests a value for the application of
GC-MS to authenticity control by means
of component isotope ratio.
[2] Christopher N. Rhodes, Janice H.
Lofthouse, Simon Hird, Paul Rose, Paul Reece,
Julie Christy, Roy Macarthur, Paul A. Brereton
(2010), “The use of stable carbon isotopes to
authenticate claims that poultry have been cornfed”, Food Chemistry, 118, pp.927-932.
ACKNOWLEDGEMENTS
[5] H. Craig (1961), “Isotopic Variations in
Meteoric Waters”, Science, 133(3465), pp.17021703.
This work was financially supported
by the Sasakawa Research Grant from
The Japan Science Society. The authors
are also indebted to Dr. Song Hee Sun,
Gwangju Health College, Korea, for her
kind cooperation with sample collection.
REFERENCES
[1] A. Rossmann (2001), “Determination
of stable isotope ratios in food analysis”, Food
Reviews International, 17, pp.347-381.
24
Vietnam Journal of Science,
Technology and Engineering
[3] S. Asche, A.L. Michaud, J.T. Brenna
(2003), “Sourcing organic compounds based
on natural isotopic variations measured by high
precision isotope ratio mass spectrometry”,
Current Organic Chemistry, 7, pp.1527-1543.
[4] Y. Yuntseover, and J.R. Gat (1981),
Atmostpheric water, IAEA technical report series
210-stable isotope hydrology, pp.103-142.
[6] T.E. Dawson, S. Mambelli, A.H.
Plamboeck, P.H. Templer, K.P. Tu (2002), “Stable
isotopes in plant ecology”, Annual Review of
Ecology and Systematics, 33(1), pp.507-559.
[7] N.T. Thao, T. Kashiwagi, M. Sawamura
(2007), “Characterization by GC-MS of
Vietnamese Citrus Species and Hybrids Based on
the Isotope Ratio of Monoterpene Hydrocarbons”,
Biosci. Biotechnol. Biochem., 71(9), pp.21552161.
[8] A. Satake, A. Une, T. Ueno, H. Ukeda,
september 2017 l Vol.59 Number 3
M. Sawamura (2003), “Isotope ratio analysis
by HRGC-MS of monoterpene hydrocarbons
from citrus essential oils”, Biosci. Biotechnol.
Biochem., 67(3), pp.599-604.
[9] M. Sawamura, T. Ito, A. Une, H. Ukeda,
Y. Yamasaki (2001), “Isotope ratio by HRGCMS of citrus Junos tanaka (yuzu) essential oils:
m/z 137/136 of terpene hydrocarbons”, Biosci.
Biotechnol. Biochem., 65(12), pp.2622-2629.
[10] M. Sawamura (2000), “Volatile
components of essential oils of the Citrus genus”,
Agricultural & Food Chem., 4(1), pp.131-164.
[11] M. Sawamura (1994), “Citrus flavour”,
Kagaku to seibutsu, 32, pp.114-119.
[12] S.M. Njoroge, H. Koaze, P.N. Karanja,
M. Sawamura (2005), “Volatile constituents of
redblush grapefruit (Citrus paradisi) and pummelo
(Citrus grandis) peel essential oils from Kenya”, J.
Agric. Food Chem., 53(25), pp.9790-9794.
[13] F.W. McLafferty, and F. Turecek (1993),
Interpretation of mass spectra, University Science
Books, p.371.
[14] A. Satake, K. Furukawa, T. Ueno, H.
Ukeda, M. Sawamura (2004), “MS fragment
isotope ratio analysis for evaluation of citrus
essential oils by HRGC-MS”, Biosci. Biotechnol.
Biochem., 68(2), pp.312-316.