Studies on effect of soil macro and micronutrient status of tamarind (Tamarindus indica L.)
Bạn đang xem bản rút gọn của tài liệu. Xem và tải ngay bản đầy đủ của tài liệu tại đây (407.32 KB, 6 trang )
Int.J.Curr.Microbiol.App.Sci (2019) 8(2): 671-676
International Journal of Current Microbiology and Applied Sciences
ISSN: 2319-7706 Volume 8 Number 02 (2019)
Journal homepage:
Original Research Article
/>
Studies on Effect of Soil Macro and Micronutrient Status of
Tamarind (Tamarindus indica L.)
P.S. Urade*, R.M. Dheware and A.R. Jadhav
Department of Horticulture, College of Agriculture, Latur
Vasantrao Naik Marathwada Krishi Vidyapeeth, Parbhani- 431 402 (M.S.) India
*Corresponding author
ABSTRACT
Keywords
Tamarind
(Tamarindusindica
L.), Soil
macronutrient, Soil
micronutrient
Article Info
Accepted:
07 January 2019
Available Online:
10 February 2019
The present investigation was carried out to study the soils macro and micro nutrient status
of tamarind orchards in Latur district during the year 2017-2018. The framed experiment
was concentrated, to assess and find out the soil nutrient status of tamarind orchards,
relation between soil nutrients and yield of sole and bund crops and unfruitfulness of sole
crops in tamarind orchards in Marathwada region. Twenty tamarind orchards of eight to
thirty five years age planted at different spacing ranging from 8 x 8 m to 10 x 10 m with
plant density of 100 to 150 plant ha-1 under varied management practices located in
different tehsil’s of Latur district were selected for the experimentation. In Marathwada
region, in sole planting, soil macro-nutrients ranged from N (129.28 to 250.00 kg ha-1), P
(11.00 to 38.00 kg ha-1), K (172.00 to 998.00 kg ha-1), Ca (19.00 to 55.23 cmol( p+) kg-1),
Mg (186.00 to 397.00 (p+) kg-1) and S (11.25 to 18.00 (p+) kg-1) and soil micro-nutrients
ranged from Fe (1.20 to 3.92 mg kg-1), Mn (3.51 to 19.78 mg kg-1), Cu (1.30 to 8.60 mg
kg-1), B (0.17 to 1.40 mg kg-1) and Zn (0.21 to 2.79 mg kg-1) were observed. However, in
bund planting, soil macro-nutrients ranged from N (137.25 to 258.01kgha -1), P (11.01 to
37.25kgha-1), K (178.11 to 998.80 kgha-1), Ca(19.20 to 55.80cmol(p+) kg-1), Mg(197.80 to
395cmol(p+) kg-1) and S(11.50 to 18.40 cmol(p+) kg-1) and soil micro-nutrients ranged from
Fe (1.05 to 3.91mg kg-1), Mn (3.34 to 18.28mg kg-1), Zn (0.21 to 2.95mg kg-1), Cu (1.05 to
7.95mg kg-1) and B(0.5 to 1.90mg kg-1) were observed. The results showed that, these soil
macro and micro nutrients ranges are also beneficial to the fruitfulness of tamarinds.
Hence, it can be concluded that, there is no effect of soil macro and micro nutrients in
unfruitfulness of sole orchard and fruitfulness of bund orchard in tamarind. It might be
effect of shading in sole crops for unfruitfulness and in case of bund crop orchards it could
get proper aeration and sunlight properly.
Africa. The total area under cultivation of
tamarind in India in the year 2016-17 is
186000 hectares and production is 943000
MT according to National Horticulture Board
(Anonymous, 2017). Tamarind thrives best in
loamy, deep, well drained alluvial soil, which
Introduction
Tamarind (Tamarindus indica L.) belongs to
family Leguminoceae (Fabaceae) is grown in
semi-arid tropical and sub-tropical regions of
the world. The fruit is native of Tropical
671
Int.J.Curr.Microbiol.App.Sci (2019) 8(2): 671-676
favours the development of a long tap root
(Galang, 1955). The optimum pH of tamarind
is 5.5-6.8, which is slightly acidic (FAO,
1988), through it also grows well in alkaline
soils. The agriculture by-product like
tamarind seed kernel can be used as a cheap
source for functional food to increase the
added value of tamarind seeds (Mohamed et
al., 2015). It is a large evergreen tree with an
exceptionally beautiful spreading crown and
is cultivated throughout almost the whole
country, except in the Himalayas and western
dry regions (Rao et al., 1999). Almost all
parts of the tree find some use or the other in
food, chemical, pharmaceutical, textile
industries, and as fodder, timber and fuel
(Dagar et al., 1995). Tamarind is rich in
nutrients and plays an important role in
human nutrition, mainly in the developing
countries (Mohamed and Rangappa, 1992)
and (Yanez et al., 1995). Tamarind is valued
mostly for its fruit, especially the pulp, which
is used for a wide variety of domestic and
industrial purposes (Kulkarni et al., 1993).
Seed is a by-product of the commercial
utilization of the fruit; the seed comprises the
seed coat or testa (20-30%) and the kernel or
endosperm (70-75%) (Shankaracharya, 1993).
It is valued for making gunpowder
(Chaturvedi, 1985). Deficient nutrient not
only reduces the productivity of the crops but
also reduce the use efficiency of applied
nutrients. However, information on the
optimum range of soils physico-chemical
properties and plant for maintaining yield
potential and quality of fruit in vertisols and
associated black soil of Maharashtra is
lacking.
May 2017, at depth of up to 90 cm. The
framed experiment was concentrated, to
assess and find out the soil nutrient status of
tamarind orchards, relation between soil
nutrients and yield of sole and bund crops and
unfruitfulness of sole orchards as compare to
bund orchard in tamarind of Marathwada
region. N determined by Alkaline Potassium
Permanganate method by using Kelplus
distillation unit (Subbiah and Asija, 1956), P
determined using double beam US- VIS
spectrophotometer with Olsen`s method as
described by Olsen et al., (1954), K
determining using Flame Photometer
(Jackson, 1967), Ca, Mg determined by
versanate titration method (Jackson, 1973)
and S determined by double beam US- VIS
spectrophotometer. Fe, Mn, Zn and Cu using
Atomic Absorption Spectrophotometer from
Perkins Elmer as described by Lindsay and
Norvell (1978). B in soil sample by using
Azomethine-H on spectrophotometer at 420
nm wavelength (Gupta, 1979).The statistical
analysis of the data in respect of soil nutrients
was done according to the standard procedure
given by Panse and Sukhatme (1985).
Results and Discussion
Macronutrient status of soil
It is revealed from the data (Table 1 and
Figure 1); In sole planting the soil
macronutrients ranges, N (129.28 to 250.00
kg ha-1), P (11.00 to 38.00 kg ha-1), K (172.00
to 998.00 kg ha-1), Ca (19.00 to 55.23 cmol(p+)
kg-1), Mg (186.00 to 397.00 (p+) kg-1) and S
(11.25 to 18.00 (p+) kg-1) were observed in the
soils of tamarind orchards of Latur district.
However, in bund planting, N (137.25 to
258.01 kg ha-1), P (11.01 to 37.25 kg ha-1), K
(178.11 to 998.80 kg ha-1), Ca (19.20 to 55.80
cmol(p+) kg-1), Mg (197.80 to 395 cmol(p+)
kg-1) and S (11.50 to 18.40 cmol(p+) kg-1)were
observed in the soils of tamarind orchards of
Latur district.
Materials and Methods
The survey of randomly selected twenty
tamarind orchards of eight to thirty five years
age planted at different spacing ranging from
8 x 8 m to 10 x 10 m with plant density of 100
to 150 plant ha-1 at Latur during the year
2017-2018. Soil samples collected during
672
Int.J.Curr.Microbiol.App.Sci (2019) 8(2): 671-676
Table.1 Soil macronutrient status of tamarind orchard of Latur district
Sr. No.
1
2
3
4
5
6
7
8
9
10
11
12
13
14
15
16
17
18
19
20
Orchard No.
LTO-1
LTO-2
LTO-3
LTO-4
LTO-5
LTO-6
LTO-7
LTO-8
LTO-9
LTO-10
LTO-11
LTO-12
LTO-13
LTO-14
LTO-15
LTO-16
LTO-17
LTO-18
LTO-19
LTO-20
Mean
Range
SE ±
Nitrogen
(kg ha-1)
sole
bund
150.95
150.00
200.81
200.00
163.21
168.68
137.25
137.00
175.81
175.00
163.15
168.25
178.09
175.00
163.25
163.00
150.01
150.90
163.91
163.25
225.01
235.00
175.25
175.80
163.21
168.28
258.01
250.00
165.01
163.08
188.02
188.09
180.01
150.00
165.29
163.00
188.11
188.25
139.20
129.28
173.09
174.67
129.28137.25250.00
258.01
164.51
166.02
Phosphorous
(kg ha-1)
sole
bund
12.98
13.00
22.25
23.00
24.95
22.98
32.15
38.00
22.28
22.90
23.01
22.00
28.95
29.38
17.80
18.00
16.25
16.80
11.25
11.50
11.50
11.00
14.01
14.00
18.25
13.00
25.01
25.00
22.11
22.24
25.21
28.00
37.25
31.79
18.81
18.00
13.25
13.00
11.01
17.00
20.52
20.414
11.0011.0138.00
37.25
19.51
19.40
Potassium
(kg ha-1)
sole
bund
293.15
298.00
427.15
427.61
186.95
186.00
356.00
356.81
984.15
984.00
906.85
906.00
988.50
988.80
927.00
937.24
935.15
934.00
934.68
934.00
938.23
933.00
947.15
974.00
974.75
974.00
616.20
616.80
911.25
917.00
998.80
998.00
818.95
818.00
845.61
848.00
923.00
925.00
178.11
172.00
756.41
754.58
172.00- 178.11998.00
998.80
718.93
717.19
LTO: Latur Tamarind Orchards
673
Calcium
(cmol(p+) kg-1)
sole
bund
48.00
48.25
34.00
34.21
19.34
19.20
48.28
40.30
44.00
44.21
36.86
36.55
19.00
19.75
55.23
55.80
51.20
51.25
49.20
49.21
52.40
54.45
40.00
40.21
37.23
37.20
38.29
38.15
48.80
48.15
36.80
36.50
44.39
44.15
50.10
50.75
40.28
40.30
50.28
50.21
42.68
41.94
19.00- 19.2055.23
55.80
40.06
39.86
Magnesium
(cmol(p+) kg-1)
sole
bund
246.90
246.80
291.20
299.00
295.65
295.24
337.52
331.92
197.12
197.80
277.76
277.00
268.00
268.11
336.00
330.00
186.00
198.28
336.00
336.11
262.10
268.11
395.69
395.00
256.40
246.00
194.40
246.00
268.80
268.4
351.52
351.00
397.00
391.24
352.00
351.11
268.00
294.25
387.00
378.15
295.25
298.47
186.00- 197.80397.00
395.00
280.62
271.38
Sulphur
(cmol(p+) kg-1)
sole
bund
11.89
11.85
11.25
11.80
15.87
11.90
14.37
14.90
12.50
18.40
16.62
15.80
15.80
14.97
16.90
16.87
14.23
14.80
15.00
16.25
17.25
11.50
18.00
13.25
15.00
15.12
14.00
13.50
15.11
15.83
14.10
14.80
13.18
18.00
15.00
12.15
14.91
14.23
14.95
15.80
14.79
14.58
11.25- 11.5018.00
18.40
14.06
13.86
Int.J.Curr.Microbiol.App.Sci (2019) 8(2): 671-676
Table.2 Soil micronutrient status of tamarind orchard of Latur district
Sr. No.
1
2
3
4
5
6
7
8
9
10
11
12
13
14
15
16
17
18
19
20
Orchard
No.
LTO-1
LTO-2
LTO-3
LTO-4
LTO-5
LTO-6
LTO-7
LTO-8
LTO-9
LTO-10
LTO-11
LTO-12
LTO-13
LTO-14
LTO-15
LTO-16
LTO-17
LTO-18
LTO-19
LTO-20
Mean
Range
SE ±
Iron
(mg kg-1)
sole
bund
3.91
3.15
2.50
2.85
3.50
3.61
2.21
2.95
2.51
2.85
2.15
1.20
3.00
3.88
1.99
1.29
3.92
3.15
1.20
1.75
2.00
2.95
3.85
3.48
2.58
1.59
2.88
2.95
1.50
1.05
2.20
2.25
2.91
3.91
2.35
2.80
1.81
1.35
2.84
3.81
2.64
2.59
1.20-3.92 1.05-3.91
2.46
2.51
Manganese
(mg kg-1)
sole
bund
17.91
11.90
10.00
18.28
16.81
16.88
19.38
9.30
15.00
15.95
13.50
3.34
14.10
14.75
16.50
15.25
7.98
7.25
16.28
15.30
8.50
9.51
16.11
15.15
14.81
15.83
18.39
13.35
3.51
8.48
19.78
14.74
11.48
17.45
14.80
14.89
18.45
17.49
6.11
6.98
13.97
13.10
3.51-19.78 3.34-18.28
13.27
12.45
Copper
(mg kg-1)
sole
bund
3.80
3.20
1.50
1.05
3.50
5.15
3.28
3.80
7.58
7.00
3.20
2.25
7.00
7.95
2.15
3.20
2.80
2.15
6.00
6.95
4.00
4.81
6.28
6.25
4.00
5.11
1.30
2.35
2.40
2.85
2.94
2.11
8.60
3.65
5.88
5.35
8.11
3.95
4.98
5.90
4.46
4.25
1.30-8.60 1.05-7.95
4.24
4.00
LTO: Latur Tamarind Orchard
674
Boron
(mg kg-1)
sole
bund
0.91
0.50
1.40
1.85
0.20
0.85
0.82
0.81
0.50
0.25
0.89
0.40
0.40
0.59
0.85
0.30
0.88
0.60
0.40
0.55
0.28
0.89
0.28
0.85
0.22
0.80
0.95
0.21
0.52
0.98
1.11
1.90
0.50
0.75
0.17
0.80
0.88
0.60
0.40
0.80
0.62
0.76
0.17-1.40
0.50-1.90
0.59
0.72
Zinc
(mg kg-1)
sole
bund
1.85
1.15
0.31
0.85
0.86
0.41
2.79
2.95
1.79
1.90
0.80
0.35
0.60
0.21
1.00
1.89
0.30
0.85
0.48
0.95
1.00
1.86
0.80
0.58
0.21
0.75
1.50
1.85
1.28
1.89
0.50
0.88
0.38
0.88
0.21
0.75
1.15
1.60
0.88
0.30
0.93
1.14
0.21-2.79 0.21-2.95
0.88
1.08
Int.J.Curr.Microbiol.App.Sci (2019) 8(2): 671-676
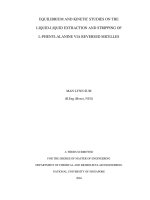
Fig.1 Planting of sole and bund orchards
Sole planting orchards (unfruitfulness)
Bund planting orchards (fruitfulness)
Same results were also recorded by Parwe
(2013) in the pomegranate orchards of Beed
district.
It is concluded that, in Marathwada region,
the soils macro and micro nutrients are
available in sufficient range and also
beneficial to increase of growth, yield and
quality of tamarind, but in this region yield
and quality was not found in sufficient range,
it may be due to shedding effect, irregular
rainfall, soil moisture availability lack of
harvesting knowledge, etc.
Micronutrient status of soil
It is revealed from the data (Table 2 and
Figure 1); In sole planting the soil micro
nutrients ranges, Fe (1.20 to 3.92 mg kg-1),
Mn (3.51 to 19.78 mg kg-1), Cu (1.30 to 8.60
mg kg-1), B (0.17 to 1.40 mg kg-1) and Zn
(0.21 to 2.79 mg kg-1) were observed in the
soils of tamarind orchards of Latur district.
However, in bund planting, Fe (1.05 to 3.91
mg kg-1), Mn (3.34 to 18.28 mg kg-1), Zn
(0.21 to 2.95 mg kg-1), Cu (1.05 to 7.95 mg
kg-1) and B (0.5 to 1.90 mg kg-1) were
observed in the soils of tamarind orchards of
Latur district. Similar result was found by
Parwe (2013) in pomegranate orchards of
Beed district.
References
Anonymous, 2017. Area and Production of
Horticulture Crops in India. Indian
Horticulture
Database,
National
Horticulture Board.
Chaturvedi, A.N., 1985. India Government of
India Press. Firewood farming on the
degraded lands of the Gangetic plain,
Lucknow (U.P.) Forest Bulletin No.50,
1: 286.
675
Int.J.Curr.Microbiol.App.Sci (2019) 8(2): 671-676
Dagar, J.C., Singh, G. and Singh, N.T., 1995.
Evolution of crops in agroforestry with
Teak (Tectoma grandis), Maharukh
(Ailanthus excelsa) and Tamarind
(Tamarindus indica) on reclaimed saltaffected soils. Journal Tropical Forest
Science, 7: 623-34.
FAO,
1988.Food
and
Agriculture
organization. Rome, Italy.
Galang, F.G. 1955. Fruits and Nuts Grown in
the Philippines. Malabon, Rizal AIA
Printing Press.
Gupta, U.C., 1979. Some factors affecting
determination of hot water soluble
boron from podzol soils using
Azomethine-H. Can. J. Soil. Sci., 59:
241-247.
Jackson, M.L., 1967. Soil chemical analysis
Prentice hall of India Pvt. Ltd., New
Delhi, pp-205.
Jackson, M.L., 1973. Soil chemical analysis,
Prentice Hall of India Pvt. Ltd. New
Delhi, pp-498.
Kulkarni, R.S., Gangaprasad, S. and Swamy,
G.S.,
1993.
Tamarindusindica:
Economically an important minor forest
product. Minor Forest Prod News, 3: 6.
Lindsay, W.L. and Norvell, W.A., 1978.
Development of DTPA soil test for Zn,
Fe, Mn and Cu. Soil Sci. America. J. 42:
421-428.
Mohamed, A.I. and Rangappa, M.,
1992.Screening soybean (grain and
vegetable) genotypes for nutrients and
antinutritional factors. Plant Foods Hum
Nutr., 42 87-96.
Mohamed, HA., Mohamed, BE. and Ahmed,
KE., 2015. Physicochemical properties
of tamarind (Tamarindus indica L.)
seed polysaccharides. Journal Food
Process Technology, ISSN: 2157-7110.
Olsen, S.R., Cole, C.V., Watanbe, F.S. and
Dean, L.A. 1954. Estimation of
available phosphorus in soils of
Vidharbha,
Maharashtra.
J.
Maharashtra Agric. Univ. 28(1): 3-7.
Panse, V.G. and Sukhatme, P.N. 1985.
Statistical methods for Agricultural
workers. IARI, New Delhi.
Parwe, S K. 2013. Nutritional evaluation of
pomegranate orchards of south-east
region Beed district by soil and leaf
analysis. M. Sc. (Agri.) thesis submitted
to MAU, Parbhani.
Rao, Y.S., Mathew, M.K. and Potty, S.N.,
1999. Tamarindus indica. Indian journal
of arecanut, spices and medicinal plants,
1: 127-45.
Shankaracharya, N.B., 1998. TamarindChemistry, Technology and Uses - a
critical
appraisal.
Journal
Food
Technology, 35: 193-208.
Subbiah, B.V. and Asija, G.L. 1956. Rapid
procedure for the determination of
available nitrogen in soil. Curr. Sci. 25:
259-260.
Yanez, E., Zacarias, I., Aguayo, M., Vasquez,
M. and Guzman, E., 1995. Nutritive
value evaluation Rats of new cultivars
of common beans (Phaseolus vulgaris)
released on Chile. Plant Foods Hum
Nutr., 47: 301-307.
How to cite this article:
Urade, P.S., R.M. Dheware and Jadhav, A.R. 2019. Studies on Effect of Soil Macro and
Micronutrient Status of Tamarind (Tamarindus indica L.). Int.J.Curr.Microbiol.App.Sci. 8(02):
671-676. doi: />
676