Combined effects of temperature and salinity and induced stress on some hematological parameters of tra catfish (pangasianodon hypophthalmus) fingerlings
Bạn đang xem bản rút gọn của tài liệu. Xem và tải ngay bản đầy đủ của tài liệu tại đây (250.25 KB, 10 trang )
AGU International Journal of Sciences – 2019, Vol 7 (3), 37 – 46
COMBINED EFFECTS OF TEMPERATURE AND SALINITY AND INDUCED STRESS ON
SOME HEMATOLOGICAL PARAMETERS OF TRA CATFISH (Pangasianodon
hypophthalmus) FINGERLINGS
Dang The Luc1
1
An Giang University, VNU - HCM
Information:
Received: 17/10/2018
Accepted: 08/07/2019
Published: 11/2019
Keywords:
Pangasianodon hypophthalmus,
temperature, salinity,
Haemoglobin, glucose, stress
ABSTRACT
Three separate experiments were carried out to assess combined effects of
temperature and salinity and induced stress on blood variables of Tra catfish
(Pangasianodon hypophthalmus) fingerlings. Some hematological parameters
included Haemoglobin concentration, glucose and pH levels which were tested
in different conditions. The experiment 1 aimed to test how blood variables
change in different temperature (24, 28-30, 32 oC) and salinity (0, 6 and 12
ppt) while the experiment 2 induced catfish fingerlings to different stress time
(5, 15 and 30 min.). Additionally, combined effects of all factors (temperature,
salinity and induced stress) on fish blood parameters were also determined in
the experiment 3. Results showed that in normal condition, the mean Hb
concentration and glucose levels of blood varied from 4.36 – 4.90 g/dL, and
from 3.83 – 5.23 mmol/L, respectively and mean pH ranged from 7.73 – 8.20.
The concentration of Hb, glucose and pH levels changed when temperature
increased from 24 to 32oC. After 30 stress minutes, there was only glucose
levels influenced. Moreover, there were significant interaction effects among
temperature, salinity and stress level on blood variables. The findings revealed
that the physiology of Tra catfish fingerling could be affected after 5 stress
minutes at temperature of 24oC and 32oC with salinity of 6 and 12 ppt. All data
of experiments showed that a positive correlation between Hb concentrations
and glucose levels and negative correlation between Hb concentrations and pH
levels were found. Results also showed that changes in blood variables could
cause stress for aquatic animal, especially Tra catfish fingerlings.
1. INTRODUCTION
Catfish is one of the most important species
cultured in the MeKong Delta, which brings the
main income to An Giang farmers. However,
despite of climate change, there are some negative
impacts on catfish farming, especially when
temperature and salinity have changed.
levels and the interaction between temperature
and salinity on fishes (Kemp, 2009; Wright and
Tobin, 2011; Nguyen et al., 2015). These studies
have all concluded that fish health including
growth rates, survival rates and physiological
responses could be negatively affected by
significant changes.
Many previous studies have been carried out to
assess effects of rising temperatures, salinity
The increase of temperature could affect the
metabolism of aquatic animals as well as the
37
AGU International Journal of Sciences – 2019, Vol 7 (3), 37 – 46
growth rate of fish (Kemp, 2009). Modified
salinity is a factor causing stress and affecting fish
physiology (Fashina-Bombata & Busari, 2003;
Konstantinov & Martynova, 1993; Partridge &
Jenkins, 2002; Sink, 2010). Stress is a popular
physiological status in fish or other species in
order to deal with changes of the environment to
survive and maintain internal balance of animals
(Fuzzen et al., 2011).
The study was carried out from December 2016 to
October 2017 at the wetlab of An Giang
University, Long Xuyen city, An Giang province.
2.2 Experimental design
The experiment 1: A two-factor designs, where
three temperature (T) levels (24°C, 28°C – 30°C
and 34°C) and three salinity (S) levels (0 ppt, 6
ppt and 12 ppt) were tested in triplicate
combinations (TxS).
Previously, stress indicators included changes in
plasma glucose and pH levels in fish, especially
Tra catfish, were examined (Kirchhoff et al.,
2014; Nguyen et al., 2014). In addition,
Haemoglobin concentration is also considered as
an indicator to evaluate overall physiology and
general health in fish (Houston, 1997). However,
it is necessary to fully collect more data on blood
variables in Tra catfish's fingerlings in the
condition of climate change in Mekong Delta,
Vietnam.
In this experiment, with a density of 30
individuals/tank, fish fingerlings were accustomed
gradually to required salinity rates by replacing
freshwater in each tank with saline water in a
stepwise fashion, which was 2‰ per day to
prevent shock to fish, until all tanks had reached
their target salinities. Individuals were then kept
within 24 hours to be stable.
Finally, the temperature levels were modified by
ice and heaters in a stepwise fashion, which was
not higher than 2°C per 3 hours until all tanks had
reached their target temperature levels. Fish blood
was immediately collected from the caudal veins
within 5 min. of sampling with 1 mL heparincoated syringes after being anaesthetised at the
following time intervals: 0h, 1h and 24h.
Therefore, the study “Combined effects of
temperature and salinity and induced stress on
some hematological parameters of Tra catfish
(Pangasianodon hypophthalmus) fingerlings”
was conducted to fully understand about Tra
catfish fingerling’s health. This also contributes to
establish some blood variables’ baseline for Tra
catfish, which helps to determine and manage fish
health status more effectively. As a result, the
production cycle of Tra catfish could be enhanced
and sustainably developed in the condition of
climate change in Mekong Delta.
The experiment 2: According to Lopez-Patino et
al. (2014), fish was stressed by chasing (using
hand-nets to catch up fish) within 5, 15 and 30
minutes. After stressed time, fish blood was
immediately collected from the caudal veins as in
the experiment 1.
The experiment 3: Fish was challenged by a
three-factor design which combined different
temperature (T), salinity rates (S) and stress levels
(St) in triplication. This experiment included 27
treatments. Temperature and salinity rates were
adjusted as the experiment 1 before fish was
chased as in the experiment 2 After that, fish
blood was immediately collected from the caudal
veins within 5 min. of sampling with 1 mL
heparin-coated syringes after being anaesthetised.
2. MATERIALS AND METHODS
2.1 Experimental system and source of catfish
Catfish fingerlings (25.96 ± 0.67 g/fish) were
obtained from a hatchery farm located in Dong
Thap province. Fish were in good conditions and
fed commercial feed (40% crude protein) during
the experiment. Individuals were acclimated for a
month before transfered to 80L tanks in
freshwater at 28-30°C (maintained by heaters)
with a continuous supply of well-aerated water.
After the acclimatation period, fish were arranged
2.3 Sampling collection and analysis
Fish fingerlings were anaesthetised by 0.3 ppm of
MS-222. Fish blood was collected from caudal
veins. Each sample contained 2 mL in heparinised
into different experiments.
38
AGU International Journal of Sciences – 2019, Vol 7 (3), 37 – 46
Vacutainer® tube (BD, USA). All samples were
stored with ice before being analysed.
time) and their interactions on blood variables. All
variances were homogenous by Levene's test.
Haemoglobin (Hb) concentration was determined
by using a haemoglobin meter, ACON Mission®
Hb Plus Meter (ACON Laboratories Inc., USA).
Glucose concentration was determined by using a
glucose meter test, ACON On Call Plus Meter
(ACON Laboratories Inc., USA). Blood pH was
determined by using a pH meter, Horiba 11
(LAQUAtwin, Japan).
Relationships between blood variables were
determined using all data and Spearman's rank
correlation coefficients. Homogeneity of variance
was tested with Levene’s test and the means of
blood variables were compared using Duncan test.
2.4 Statistical analysis
3.1.1 Haemoglobin
All data were analysed by SPSS 20.0 for
Windows (SPSS Inc., Chicago, IL, USA). Means
and standard errors were calculated for blood
variables including Hb concentration, levels of
glucose and pH. The differences among
treatments within experiment were determined by
two-way and three-way analysis of variance
(ANOVA) at a significance α=0.05 for significant
main effects (temperature, salinity or stressed
There was an interaction between temperature and
salinity on Hb concentrations. Hb concentrations
were unstable during this study, especially there
was an increase in Hb concentration at 24 0C, 0
ppt after 24 hrs (shown in Table 1) when Hb
concentration reached the highest concentration
(6.03 ± 0.45 g/dL). The lowest one (2.90 ± 0.10
g/dL) was at 240C, 6 ppt, 0 hr. The Hb
concentration in a normal condition was in range
of 4.36 – 4.90 g/dL.
3. RESULTS
3.1 The experiment 1
Table 1. Mean Hb concentrations (g/dL) between treatments in the experiment 1
Treatment
0h
1h
24h
24C, 0 ppt
3.33 ± 0.35ab
3.33 ± 0.35ab
6.03 ± 0.45d
24C, 6 ppt
2.90 ± 0.10a
3.46 ± 0.45abc
3.36 ± 0.15ab
24C, 12 ppt
3.10 ± 0.30a
3.16 ± 0.32a
3.26 ± 0.35ab
Control, 0 ppt
4.36 ± 0.65bc
4.16 ± 0.25c
4.90 ± 0.10c
Control, 6 ppt
3.66 ± 0.85ab
3.93 ± 0.35bc
2.90 ± 0.10a
Control, 12 ppt
3.86 ± 0.85ab
4.10 ± 0.40c
4.76 ± 1.15c
34C, 0 ppt
4.85 ± 0.55c
4.90 ± 0.45d
4.20 ± 0.20bc
34C, 6 ppt
3.30 ± 0.40ab
3.30 ± 0.30ab
4.25 ± 0.45bc
34C, 12 ppt
3.70 ± 0.50ab
3.63 ± 0.45abc
4.86 ± 0.95c
Mean values having different letters within columns are significant difference (p<0,05)
(6.60 ± 0.20 mmol/L) was found at 340C, 0 ppt, 0
hr while the lowest (2.16 ± 0.35 mmol/L) was at
340C, 6 ppt after 1 hr. The glucose level in a
normal condition was in range of 3.83 – 5.23
mmol/L.
3.1.2 Glucose
An significant interaction effect between
temperature and salinity (TxS) was found on
glucose level. Glusoce level was unstable during
this study (shown in Table 2). The highest level
39
AGU International Journal of Sciences – 2019, Vol 7 (3), 37 – 46
Table 2. Mean glucose levels (mmol/L) between treatments in the experiment 1
Treatment
0h
1h
24h
24C, 0 ppt
5.13 ± 0.35d
4.55 ± 0.25d
2.97 ± 0.12a
24C, 6 ppt
3.00 ± 0.30b
3.06 ± 0.23b
3.23 ± 0.15a
24C, 12 ppt
3.43 ± 0.35bc
4.00 ± 0.30c
3.40 ± 0.20a
Control, 0 ppt
3.83 ± 0.57c
5.00 ± 0.10e
5.23 ± 0.15c
Control, 6 ppt
3.50 ± 0.20c
3.76 ± 0.15c
4.25 ± 0.35b
Control, 12 ppt
4.93 ± 0.57d
6.26 ± 0.35g
3.50 ± 0.10a
34C, 0 ppt
6.60 ± 0.20e
5.46 ± 0.20f
3.10 ± 0.20a
34C, 6 ppt
2.40 ± 0.40a
2.16 ± 0.35a
3.20 ± 0.10a
34C, 12 ppt
6.25 ± 0.15e
3.93 ± 0.57c
5.50 ± 0.70c
Mean values having different letters within columns are significant difference (p<0,05)
3.1.3. Blood pH
in Table 3). At the control temperature treatment,
pH level increased and reached the the highest
one (9.16 ± 0.25) when fish were in 12 ppt, 0 hr.
However, after after 1 hr of acclimation, that level
decreased significantly to the lowest (3.33 ±
0.05).
There was a change in pH level in fish blood. The
pH level in a normal condition was in range of
7.73 – 8.20. In addtion, an interaction between
temperature and salinity (TxS) was found on pH
level. As Hb concentration and Glucose level, pH
level was also unstable during this study (shown
Table 3. Mean pH levels between treatments in the experiment 1
Treatment
0h
1h
24h
24C, 0 ppt
7.73 ± 0.15a
7.70 ± 0.20b
7.80 ± 0.20de
24C, 6 ppt
7.30 ± 0.00a
5.83 ± 0.55a
8.13 ± 0.05e
24C, 12 ppt
7.70 ± 0.20a
7.66 ± 0.05b
7.83 ± 0.05d
Control, 0 ppt
8.20 ± 0.10b
7.80 ± 0.30b
7.73 ± 0.20d
Control, 6 ppt
7.33 ± 0.57a
8.10 ± 0.50b
7.50 ± 0.10d
Control, 12 ppt
9.16 ± 0.25c
7.79 ± 0.11b
3.33 ± 0.05a
34C, 0 ppt
9.06 ± 0.45c
7.66 ± 0.35b
7.86 ± 0.15d
34C, 6 ppt
7.42 ± 0.12a
7.85 ± 0.05b
5.40 ± 0.50b
34C, 12 ppt
7.46 ± 0.32a
7.75 ± 0.05b
6.93 ± 0.05c
Mean values having different letters within columns are significant difference (p<0,05)
40
AGU International Journal of Sciences – 2019, Vol 7 (3), 37 – 46
3.2 The experiment 2
difference in glucose levels after 30 stressed
minutes (shown in Table 4). Glucose levels
increased gradually after a period of time (from 5
to 30 min.) chased by hand-nets.
It is showed that in the experiment 2, after 5, 15
and 30 stressed minutes, significant differences in
Haemoglobin and pH levels between treatments
were not found. However, there was a significant
Table 4. Mean glucose levels (mmol/L) between treatments in the experiment 2
Treatment
Glucose levels
Min - Max
Control
3.83 ± 0.06a
3.80 – 3.90
5 min.
4.25 ± 0.11ab
4.13 – 4.33
15 min.
4.73 ± 0.82ab
3.97 – 5.60
30 min.
5.10 ± 0.43b
4.65 – 5.50
Mean values having different letters within columns are significant difference (p<0,05)
found at 24 0C, 12 ppt after 15 min. while the
lowest (2.93 0.12) was found at control
temperature, 12 ppt also after 15 min. It is
indicated that Hb concentration in treatments was
different significantly and differed from each
other after 30 stressed minutes (shown in Table
5).
3.3 The experiment 3
3.3.1 Haemoglobin
There was an interaction between temperature,
salinity and stress levels (TxSxSt) on Hb
concentration in Tra catfish fingerlings. The
highest Hb concentration (6.45 0.35 g/dL) was
Table 5. Mean Hb concentrations (g/dL) between treatments in the experiment 3
Treatment
5 min.
15 min.
5.03
30 min.
Control, 0 ppt
5.00
Control, 6 ppt
2.97 0.06a
3.40 0.40ab
6.40 0.20b
Control, 12 ppt
2.98 0.08a
2.93 0.12a
4.63 1.35ab
24C, 0 ppt
4.20 1.08ab
3.05 0.05ab
4.47 1.27ab
24C, 6 ppt
3.15 0.15a
3.16 0.21ab
2.97 0.06a
24C, 12 ppt
6.00 1.15c
6.45 0.35d
4.35 1.45ab
32C, 0 ppt
4.90 1.40bc
5.23 0.97cd
6.40 1.08b
32C, 6 ppt
4.37 1.35abc
4.60 0.82bc
3.80 1.30a
32C, 12 ppt
3.57 0.90ab
4.10 1.28abc
5.00 1.71ab
0.36bc
1.70cd
3.00 0.10a
Mean values having different letters within columns are significant difference (p<0,05)
3.3.2 Glucose
There was an interaction between temperature, salinity and stress levels (TxSxSt) on glucose levels in Tra
catfish fingerlings. The highest glucose level (10.93 3.91 mmol/L) was found at 24 0C, 0 ppt after 30
min. while the lowest (2.97 0.06) was found at 34 0C, 6 ppt after 5 min. It is statistically confirmed that
glucose levels in treatments was different significantly and fluctuated after 30 stressed minutes (shown in
Table 6).
41
AGU International Journal of Sciences – 2019, Vol 7 (3), 37 – 46
Table 6. Mean glucose levels (mmol/L) between treatments in the experiment 3
Treatment
5 min.
15 min.
30 min.
Control, 0 ppt
6.56 0.71c
4.43 0.67a
6.73 1.03a
Control, 6 ppt
4.07 0.42ab
3.80 0.92a
5.43 0.47a
Control, 12 ppt
4.93 0.23abc
3.97 0.78a
7.30 1.76a
24C, 0 ppt
5.53 0.59bc
9.30 1.74b
10.93 2.25b
24C, 6 ppt
5.57 0.33bc
6.17 1.82a
7.57 0.32a
24C, 12 ppt
4.20 0.31ab
4.93 0.13a
5.33 0.82a
32C, 0 ppt
5.37 0.67abc
5.20 0.53a
5.87 0.32a
32C, 6 ppt
3.57 0.78a
3.63 0.92a
4.53 0.82a
32C, 12 ppt
5.10 0.82abc
4.27 0.59a
5.27 0.26a
Mean values having different letters within columns are significant difference (p<0,05)
lowest (4.90 1.29) was found at control
temperature, 6 ppt after 30 minutes. In addition,
pH levels in treatments was different significantly
and differed from each other after 30 stressed
minutes (Table 7).
3.3.3 Blood pH
It is indicated that an interaction between
temperature, salinity and stress levels (TxSxSt)
was found on pH level in Tra catfish fingerlings.
The highest pH level (8.85 0.67) was found at
34 0C, 12 ppt after 5 minutes. In contrast, the
Table 7. Mean pH levels between treatments in the experiment 3
Treatment
5 min.
15 min.
30 min.
Control, 0 ppt
7.47 0.03abc
7.53 0.87a
7.67 0.24bc
Control, 6 ppt
8.00 0.21cd
7.23 0.42a
4.90 1.29a
Control, 12 ppt
6.50 0.31a
7.77 0.17a
6.30 0.21ab
24C, 0 ppt
6.70 0.40ab
7.70 0.11a
7.24 0.17bc
24C, 6 ppt
7.67 0.12bc
7.50 0.55a
8.29 0.76c
24C, 12 ppt
7.27 0.20abc
6.70 0.80a
7.23 0.18bc
32C, 0 ppt
7.60 0.06abc
7.47 0.60a
8.17 0.43c
32C, 6 ppt
6.50 0.49a
8.57 0.74a
7.40 0.20bc
32C, 12 ppt
8.85 0.67d
6.73 0.22a
7.23 0.38bc
Mean values having different letters within columns are significant difference (p<0,05)
42
AGU International Journal of Sciences – 2019, Vol 7 (3), 37 – 46
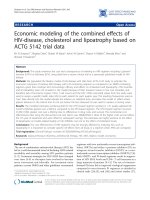
3.4 The relationship between blood variables
correlation between Hb concentrations and pH
levels when combined all figures. However, at
different stressed times, no siginificant correlation
was found.
In this study, there was a significant correlation
between Hb concentrations and glucose levels
examined at 0h and 1h in the experiment 1. In the
experiment 3, there was also a significant
Figure 1, 5. The correlation between Hb concentrations and glucose levels in the experiment 1
Figure 6. The correlation between Hb concentrations and pH levels in the experiment 3
concentration. At 240C after 24 hours being kept
in the experiment 1, fish was likely to be in
oxygen deficiency. In this condition, fish boosted
the respiratory system to concentrate a large
amount of Hb to carry oxygen to tissues.
Therefore, Hb concentration increased and was
higher than fish in normal condition. However,
the low Hb concentration could explain that fish
might be in anemia or parasite infection.
4. DISCUSSION AND RECOMMENDATION
Haemoglobin is a complex protein including a
globin (96%) combined 4 Heme (4%). Red blood
cells contain 90% Hb which makes these cells
become red (Nguyen Van Tu, 2005). Hb
concentration in blood is considered as a factor to
evaluate carrying oxygen ability, also to satisfy
the essential oxygen demand and determine fish
health and physiology, especially anaemia in fish
(Houston, 1997).
There was a significant difference in Hb
concentration (p<0.05) in the experiment 1 and 3.
This would be warned that in the global changes,
In this research, when the temperature and salinity
changed, there was a variation in Hb
43
AGU International Journal of Sciences – 2019, Vol 7 (3), 37 – 46
some disturbances happened in short terms could
affect fish health. When fish in unhealthy
condition, transportation fingerlings from nursery
to grow-out ponds could lead to the low survival
rate and diseases.
affected significantly by the interaction of
temperature and salinity.
According to Nguyen Thi Kim Ha and Do Thi
Thanh Huong (2014), the increase of plasma
glucose level of Tra catfish fingerlings
(Pangasianodon hypophthalmus) could be caused
by acute or chronic stress which is due to the
conversion from glycogen to glucose. This is
related
to
catecholamine
and
cortisol
concentrations. The difference of treatments in the
experiment 2 could be explained by disturbance of
stress activity. Stress can cause the increase of
CO2 concentration. The lack of oxygen in blood
leads to the increase of respiration rate in fish to
satisfy oxygen demand. Plasma glucose level will
increase to deal with the environmental changes
(i.e. temperature and salinity changes). Previous
study pointed that when fish got stressed after 48
hours, it also remained a high glucose level in
blood, accounted for 3.3 mmol/L (Moraes &
Bidinotto, 2000)
According to Kirchhoff et al., (2014), as
compared to tuna, Hb concentration changed from
22.29 – 28.68 g/dL within 2 years from 2010 to
2012, which showed the unstableness of blood
variables in aquatic animals. This is similar to
results when Hb concentration varied from 2.90 –
6.45 g/dL. Hb concentration of Tra catfish is
lower than tuna because tuna is an active species
in ocean.
There was an interaction between temperature and
salinity on glucose level in Tra catfish. Glucose
level increased when fish gets stressed and needs
a large amount of glucose to use. Nguyen Van Tu
(2005) pointed that glucose is one of main
ingredients in plasma and its level changes
depended on the environment and fish health
condition. In freshwater species, the relationship
of glucose level and fish behaviour is not clear but
there is difference between species. When fish
becomes active, glucose level would increase but
at the some points, glucose level would decrease.
This result is also supported by Nguyen et al.
(2015) when the interaction between temperature
and salinity was described to affect blood
parameters on Tra catfish. Hb concentration
increased to higher than 8 g/dL when temperature
was higher than 30 0C. Besides that, their study
also confirmed cortisol levels increased with
temperature and salinity.
The glucose level of fish in the experiment 2 is
similar to findings of Nguyen Thi Kim Ha & Do
Thi Thanh Huong (2014). They found that
glucose levels of Tra catfish was 3.33 – 6.11
mmol/L after 2h, 4h and 6h transportation. This
research showed that only 30 minutes of induced
stress by chasing, Tra catfish fingerlings got
stressed through visual observation as fingerlings
started to swim and react slowly after 15 stressed
minutes. After that, on the surface of tanks, there
was a number of air bubbles. As compared to eels,
glucose levels were higher. In eels, this level was
from 1.95 – 4.24 mmol/L (Nguyen Huong Thuy
& Do Thi Thanh Huong, 2010).
This is also similar to findings of Nguyen Loan
Thao et al., (2013) when they concluded that the
higher salinity is, the more plasma glucose level
increases in Tra catfish (Pangasianodon
hypophthalmus). After 141 days, plasma glucose
level changed from 1.38 – 1.83 mmol/L.
However, in this research, glucose level was
higher than previous study from 0.77 – 4.76
mmol/L. Results showed that glucose level was
Plasma pH is one of important factors to reflect
physiological status of animals and changes of the
environment. pH levels depend on the ratio of
blood H+ and OH-. Mean pH levels varied from
7.52 – 7.71, not stable as mammals (Nguyen Van
Tu, 2015). During this study, plasma pH levels
changed unstably and were influenced when fish
got stressed because of changes of acid lactic
concentration. According to Dang (2015), there
44
AGU International Journal of Sciences – 2019, Vol 7 (3), 37 – 46
was a negative correlation of pH levels and lactate
concentration
in
blood.
When
lactate
concentration was high, there was also an increase
of metabolic rate to deal with disturbance. This
leads to a decrease of pH level.
Fashina-Bombata, H., & Busari, A. (2003).
Influence of salinity on the developmental
stages of African catfish Heterobranchus
longifilis (Valenciennes, 1840). Aquaculture,
224 (1-4), 213-222.
Other finding to support this research is that if
CO2 concentration increases, this could lead to a
low pH level. After a physiological process, CO2
concentration increases followed by a decrease of
carbonic acid, which causes higher pH level. This
could explain the reason why pH level in this
study varied. However, there is not enough
information to describe in detail how pH level
changes in fish in bad condition. The variation in
pH level of this study was in accordance with the
research of Dang (2015).
Fuzzen, M. L. M., Bernier, N. J., & Kraak, G. V.
D. (2011). Stress and Reproduction. In D. O.
Norris & K. H. Lopez (Eds.), Hormones and
Reproduction of Vertebrates. Academic Press,
1, 103-118.
Graham, J. B., & Dickson, K. A. (2001).
Anatomical and physiological specialisations
for endothermy. Fish physiology, 19, 121-165.
Houston, A.H. (1997). Review: Are the classical
hematological variables acceptable indicators
of fish health? T Am Fish Soc, 126, 879-894.
Relationships between Hb concentration, glucose
and pH levels in this study were found to support
that when fish gets stressed, blood variables could
be influenced. This result is similar to findings of
Dang (2015), Pearson & Stevens (1991), Wells et
al. (1986) and Graham & Dickson (2001). All
previous studies concluded that Hb concentration
increased when Rainbow Trout, Yellowtail Tuna,
Snapper got stressed. There was over 20% of Hb
concentration stored at normal condition. When
fish got stressed, there was over 90% of stored Hb
to be released. In Snapper, Hb concentration in
stressed fish was 40% higher than healthy fish
(Wells et al., 1986).
Kemp, J. O. G. (2009). Effects of temperature and
salinity on resting metabolism in two South
African rock pool fish: the resident gobiid
Caffrogobius caffer and the transient sparid
Diplodus sargus capensis. African Zoology,
44(2), 151-158.
Kirchhoff, N.T., Nelligan, J., Ellis, D., Cadoret,
K., Leef, M., & Nowak, B.F. (2014). Interannual and intra-annual variability in blood
variables and parasitic loads of wild Thunnus
maccoyii. Canadian Journal of Fisheries and
Aquatic Sciences, 71, 1-7.
Konstantinov, A., & Martynova, V. (1993). Effect
of salinity fluctuations on energetics of
juvenile fish. Journal Of Ichthyology, 33, 1-1.
In summary, blood variables could be used to
evaluate changes of health and physiological
status in fish, especially Tra catfish. However, it is
essential to repeat this research at different
temperature and salinity rates in different sizes of
Tra catfish. Also, it is recommended to compare
how different blood variables would be when
using kit test and lab analysis.
Moraes, G., & Bidinotto, P. M. (2000). Induced
changes in the amylohydrolytic profile of the
gut of Piaractus mesopotamicus (Holmberg,
1885) fed different levels of soluble
carbohydrate: its correlation with metabolic
aspects. Revista de Ictiologia, 8. ½, 47-51.
REFERENCES
Nguyen, T. H. P., Duong, T. K. L., Mather, P. B.,
& Hurwood, D. A. (2015). Effects of salinity,
temperature and their interaction on growth
performance, hematological and hormonal
levels of tra catfish (Pangasianodon
hypophthalmus). Aquaculture.
Dang, L. (2015). Factors affecting blood
variables in Southern Bluefin Tuna. Master
with Honours Thesis. University of Tasmania,
Australia.
45
AGU International Journal of Sciences – 2019, Vol 7 (3), 37 – 46
Nguyen Loan Thao, Vo Minh Khoe, Ho Văn Toa,
Nguyen Hong Ngan, Nguyen Thi Kim Ha,
Nguyen Thanh Phuong và Nguyen Trong
Hong Phuc. (2013). Effects of salinity on
growth rate and cortisol concentration of Tra
catfish (Pangasianodon hypophthalmus).
Science Journal of Can Tho University, 25, 110.
Pearson, M. P., & Stevens, E. D., (1991).
Splenectomy
impairs
aerobic
swim
performance in trout. Canadian journal of
zoology, 69(8), 2089-2092.
Sink, T. D. (2010). Influence of pH, salinity,
calcium, and ammonia source on acute
ammonia toxicity to golden shiners,
Notemigonus crysoleucas. Journal of the
World Aquaculture Society, 41(3), 411-420.
Nguyen Thi Kim Ha và Đo Thi Thanh Huong.
(2014). Effects of transportation on stress of
Tra catfish fingerlings (Pangasianodon
hypophthalmus). Science Journal of Can Tho
University, 178-187.
Wells, R. M. G., Mclntyre, R. H., Morgan, A. K.,
& Davie, P. S. (1986). Physiological stress
responses in big gamefish after capture:
observations on plasma chemistry and blood
factors. Comparative Biochemistry and
Physiology Part A: Physiology 84 (3), 565571.
Nguyen Van Tu. (2005). Lecture on Physiology of
Fish and Crustacean. Ho Chi Minh City
University of Agriculture and Forestry,
HCMC.
Wright, P.J., Tobin, D. (2011). Temperature
effects on female maturation in a temperate
marine fish. Journal of Experimental of
Marine Biology and Ecology 403, 9-13.
Partridge, G. J., & Jenkins, G. I. (2002). The
effect of salinity on growth and survival of
juvenile
black
bream
(Acanthopagrus
butcheri). Aquaculture, 210 (1-4), 219-230.
46