Inbreeding, outbreeding and RAPD markers studies of faba bean (Vicia faba L.) crop
Bạn đang xem bản rút gọn của tài liệu. Xem và tải ngay bản đầy đủ của tài liệu tại đây (857.75 KB, 10 trang )
Journal of Advanced Research (2015) 6, 859–868
Cairo University
Journal of Advanced Research
ORIGINAL ARTICLE
Inbreeding, outbreeding and RAPD markers
studies of faba bean (Vicia faba L.) crop
Hazem A. Obiadalla-Ali
a,b
, Naheif E.M. Mohamed c, Abdelsabour G.A. Khaled
d,*
a
Department of Horticulture, Faculty of Agriculture, Sohag University, Sohag 82786, Egypt
Plant Production and Protection Department, College of Agriculture and Veterinary Medicine, Qassim University, P.O.
6622, 51452 Buryadh, Saudi Arabia
c
Department of Agronomy, Faculty of Agriculture, Sohag University, Sohag 82786, Egypt
d
Department of Genetics, Faculty of Agriculture, Sohag University, Sohag 82786, Egypt
b
A R T I C L E
I N F O
Article history:
Received 25 April 2014
Received in revised form 22 July 2014
Accepted 25 July 2014
Available online 12 August 2014
Keywords:
Faba bean
Inbreeding
Outbreeding
Inbreeding depression
RAPD markers
A B S T R A C T
Five faba bean genotypes (Vicia faba L.) were selfed for two cycles to produce S1 and S2 generations. A half-diallel cross was carried out among them in each level of inbreeding (S0, S1
and S2) to obtain 10 F1 hybrids. Parental materials as well as their respective F1s were evaluated
during the winter season of 2012. All studied traits except total dry seed yield showed significant
inbreeding depression after the first generation of selfing (S1). No further decrease was noticed
at the S2 generation. In the S1 generation the degree of inbreeding depression was highest for
No. of branches/plant (À14.0%) and the least for weight of 100-seeds (À2.7). Some parents
showed inbreeding vigor i.e. positive difference between S2 and S1 for some traits in S2 generation. Most studied traits showed significant positive heterosis values over mid-parent. The highest value of heterosis over the mid-parent was detected for total dry seed yield (128.8) and the
lowest value of hybrid vigor was shown by weight of 100-seeds (1.2%). Specific combination
among the 5 parental genotypes showed the highest value for heterosis for example cross Misr
2 · Giza 429 was the best cross for total dry seed yield, cross Giza 429 · Misr 1 for No. of
branches/plant. Giza 429 is the best general combiner for most traits. Some crosses showed heterosis depression i.e. negative heterosis value in some traits. Hybridization among parental
genotypes is recommended to be at the S1 or S2 generation. Twelve arbitrary primers produced
different degrees of genetic polymorphism among the parental genotypes. A total of 65 amplification products were scored polymorphic. The percentage of polymorphic bands detected ranged from 33% to 100% with an average of 66.47%. The average of amplified bands was 5.42
polymorphic bands per primer. A positive, but non-significant, correlation (r = 0.085) between
Euclidean distance and RAPD distance was observed.
ª 2014 Production and hosting by Elsevier B.V. on behalf of Cairo University.
* Corresponding author. Tel.: +20 1006843428; fax: +20 932280126.
E-mail address: (A.G.A. Khaled).
Peer review under responsibility of Cairo University.
.
Production and hosting by Elsevier
Introduction
Faba bean (Vicia faba L.) is one of the most important
legumes crops for human consumption in developing countries
and for animal feed, mainly for pigs, horses, poultry and
pigeons in industrialized countries. In the Middle East and
2090-1232 ª 2014 Production and hosting by Elsevier B.V. on behalf of Cairo University.
/>
860
most parts of the Mediterranean, China and Ethiopia, faba
bean constitutes one of the main dishes on the breakfast and
dinner tables [1]. The most popular dishes of faba bean are
Medamis (stewed beans), Falafel (deep fried cotyledon paste
with some vegetables and spices), Bissara (cotyledon paste
poured onto plates) and Nabet soup (boiled germinated beans)
[2]. It is sometimes grown for green manure, but more generally for stock feed. In Egypt and Sudan straw from faba bean
harvest fetches a premium and is considered as a cash crop [1].
Wide variation in protein content (20–41%) of faba bean has
been reported [3]. Besides being an excellent source of high
quality protein, it is considered as a good source of carbohydrate, vitamins and minerals [4].
Improving seed yield and production of faba bean is a priority to meet increased demand from population growth. Production of F1 hybrid varieties is considered one improvement to
achieves these goals [5,6]. Faba bean is a partially allogamous
species with about 10–80% natural out-crossing, depending
on genotypes and environmental effects [7,8]. The consequences
of self-fertilization are important factors to take into account
when determining the management of germplasm in species
with varied levels of heterogeneity and heterozygosity [9].
Selfing results in reduction in the following: plant height
and 100-seed weight [10], number of seeds/pod [11] and yield
[12]. Therefore, for a curator, plant breeder and gene bank
manager, in addition to the loss of diversity due to random
genetic drift, the effect of self-fertilization is one of the issues
that must be considered when multiplying and regenerating
seeds. The nuclear genome of V. faba is enormous, with more
than 13,000 Mbp in comparison with the model legume species
M. truncatula, which is estimated to be 470 Mbp [13]. This
large size may be largely explained by a high number of retrotransposon copies [14]. These retrotransposons, microsatellites
and genes are the basis of the sequence variability that can be
explored in genomes.
Isozymes, RAPDs and RFLPs were used to develop the
first meaningful genetic linkage maps for faba bean in F2 populations [15]. The genetic DNA markers have opened a new
vista to study genetic diversity, and these markers have the
potential to reveal a large amount of variation with good coverage of the entire genome. Several investigators [16–18], successfully used RAPD molecular markers to study the genetic
variability and relationships among accessions, lines and cultivars of faba bean.
The main objectives of this work were to (1) evaluate the
effect of hybridization among five faba bean parental genotypes and in particular examine the level of hybrid-vigor for
vegetative and reproductive traits in this crop, (2) investigate
the effects of changes related to selfing on performance, breeding and germplasm management of our faba bean, and (3)
evaluate the genetic diversity among these parental genotypes
using random amplified polymorphic DNA (RAPD) marker.
H.A. Obiadalla-Ali et al.
clay-loam. Seeds of the original population (S0) of the parental
genotypes were planted on October 15, 2009. At the flowering
stage using hand emasculation and pollination, hybridization
was carried out to obtain the 10 possible hybrid combinations
(excluding reciprocals). At the same time, five plants of each
genotype were isolated and selfed to produce the (S1) seeds. In
the winter season of 2010, the S1 seeds of each genotype were
planted and at the flowering stage a half-diallel cross was undertaken to produce the 10 F1 hybrid combinations. At the same
time some of S1 plants were selfed to produce the S2 seeds. In
the winter season of 2011, the S2 seeds of each genotype were
planted and at the flowering stage a half-diallel cross were carried out to produce the 10 F1 hybrid seeds. In the winter season
of 2012 seeds of all entries were planted into two experiments. In
the first experiment the original population (S0) and their selfed
generations (S1 and S2) for all the 5 parental genotypes were randomized in a complete block design with three replicates. In the
second experiment the 10 F1 hybrids produced from the halfdiallel cross and their 5 parents for each the 3 levels of selfing
(S0, S1 and S2) were randomized in a complete block design with
3 replicates. In both experiments seeds were planted on the
southern side of the rows. Each plot consisted of 3 rows 4 m long
and 60 cm apart. After complete emergence, plants were thinned
to 2 plants per hill spaced at 20 cm. All agricultural practices
were as recommended for local commercial production.
The collected data were measured as follows: Number of
days to 50% flowering (number of days from planting to flowering date for 50% of plants) and Earliness (number of days
from date of planting to maturity for 50% of plants) were
recorded during the growth period in each plot; Data on plant
height, number of branches per plant, pod setting (number of
set pods/number of anthesized flowers) were taken before harvesting as average of 10 plants per plot.
Samples of ten guarded plants were randomly taken from
each plot for the following characters: (1) Plant height (cm),
(2) Number of branches per plant, (3) Pod setting percentage
(number of set pods/number of anthesized flowers). Plants
were harvested at full maturity and transferred to the laboratory. Samples of ten plants were also randomly assigned from
each plot to determine the following traits: (1) number of pods
per plant, (2) weight of 100-seed (g), (3) shellout percentage
(weight of dry seeds per plant/weight of dry pods per plant),
(4) pod filling Percentage (number of seeds per pod/pod length
(cm)), (5) protein content percentage (micro-kjeldahl method
used to estimate the total nitrogen. Crude protein was
obtained by multiplying the nitrogen percentage by 6.25) and
(6) total dry seed yield (kg/ha).
Inbreeding depression was calculated as the percentage
decrease in S1 and S2 value compared to S0 and S1 value as
follows:
Inbreeding depression ð%Þ ¼
 100
Material and methods
Five local genotypes of faba bean (Vicia faba), Misr 2 (P1), Giza
429 (P2), Misr 1 (P3), Giza 40 (P4) and Giza 843 (P5), obtained
from Agricultural Research Center of Egypt, were used in the
present study. This study was conducted at the Research Farm
and biotechnology laboratory of Faculty of Agriculture, Sohag
University, Egypt. The soil is reclaimed with top layer (25 cm) of
S1 À S0
S2 À S1
 100 and;
S0
S1
Heterosis expressed by the hybrid in each of S0, S1 and S2 populations was calculated as the percentage increase of the F1
hybrid over its mid-parent values at all levels as follows:
Mid-parent heterosis ð%Þ ¼
where; M:P: ¼
Pi À Pj
2
F1 À M:P:
 100
M:P:
Breeding and RAPD studies of faba bean
861
All recorded data were statistically analyzed; analysis of variance for randomized complete block design was carried out
according to Gomez and Gomez [19]. Least significance differences (LSD) test was used to detect significant changes of means
following each generation of selfing at 0.05 and 0.01 probability
levels. Significance of deviations due to mid-parent heterosis
was also tested using LSD test at 0.05 and 0.01 probability level.
RAPD markers procedures
Fresh young leaves were harvested and immediately ground in
extraction buffer using cetyltrimethylammonium bromide
(CTAB) protocol as described by Poresbski et al. [20] with adding
1% polyvinylpyrrolidone (PVP). A total of twenty-four varied
10-mer random primers (Metabion International AG, Germany)
were scanned across the five parental genotypes. Amplification
was carried out in a DNA Thermal Cycler (Primus 25, Germany)
according to the methods described by Williams et al. [21]. The
RAPD assay was performed in a 15 ll volume containing 7 ll
of Go TaqÒ Green Master Mix (Promega, Madison, USA),
2 ll of primer 5 pmol, 4 ll of nuclease-free water and 2 ll of
200 ng genomic DNA templates. PCR amplification was programmed for conditions with an initial denaturation cycle at
94 °C for five minutes. The following 40 cycles were composed
of the following: denaturation step at 94 °C for 1 min, annealing
step at 34 °C for 1 min 30 s and elongation step at 72 °C for 2 min.
The final cycle of polymerization was performed at 72 °C for
8 min. The amplification products were electrophoresed in a
1.0% agarose gel stained with 0.2 ll ethidium bromide. The
amplified fragments were visualized and photographed using
UVP Bio Doc-It imaging system (USA).
Data analysis
The DNA banding patterns generated from RAPD analysis
were analyzed by a computer program, Gene Profiler (version
4.03). A Microsoft Excel file was prepared for scoring the data
as ‘1’ for matched and ‘0’ for unmatched DNA bands of every
genotype. Genetic similarities among genotypes were computed based on the method of Nei and Li [22]. The average
of similarity matrix was used to generate a tree for cluster analysis by UPGMA (Unweighted Pair Group Method with Arithmetic Average) method using MVSP (version 3.1) program.
Table 1
Inbreeding depression
Inbreeding depression (%) after one and two cycles of selfing
was estimated for vegetative and reproductive traits (Table 1)
and yield and quality traits (Table 2). It is clear that most of
the studied genotypes showed significant inbreeding depression
in all traits after one cycle of selfing (S1). These results are in
agreement with those obtained by Gasim and Link [10].
Inbreeding depression was extended to the S2 generation in
only one parent for plant height (P2), No. of days to 50% flowering (P5), No. of pod/plant (P3) and shellout percentage (P4),
two parents (P1 and P2) in pod filling percentage and three
parents (P1, P2 and P4) in protein content percentage (Table 1
and 2). No further significant decrease due to selfing was
observed at the S2 generation in No. of branches/plant
(Table 1). Significant positive differences between S2 and S1
generations were observed for a number of traits in one or
more genotypes, including the following: one genotype (P3)
in shellout (%), two genotypes (P1 and P3) in earliness, three
genotypes (P2, P3 and P4) in No. of days to 50% flowering
and weight of 100-seeds (g) and (P3, P4 and P5) in pod filling,
four genotypes (P1, P3, P4 and P5) in plant height and (P1, P2,
P4 and P5) in No. of pod/plant and all five genotypes in No. of
branches/plant (Table 1 and 2). These results are consistent
with those obtained by Hebblethwaite et al. [11]. No significant
inbreeding depression in total dry seed yield was detected due
to selfing at the S1 and S2 generation. This is in contrast to
Nassib and Khalil [26] who found significant inbreeding
depression in seed yield indicating that observed heterosis in
F1 is a real effect. On the other hand, all genotypes showed
Inbreeding depression
Plant Height
P-value
Results and discussion
Inbreeding depression (%) in some characters of 5 genotypes of faba bean in 3 Levels of inbreeding (S0, S1 and S2).
Genotypes
P1
P2
P3
P4
P5
LSD
In order to detect patterns of genetic relationship among
the parental genotypes, dissimilarity analysis of means of all
studied traits was constructed based on the Euclidean distances
using the method proposed by Laghetti et al. [23]. The similarity matrix of RAPD was converted to a dissimilarity matrix. A
cophenetic matrix was derived from each matrix to test goodness of fit of the clusters by comparing the two matrices using
the Mantel test [24]. Finally, the correlation between each distance pair was calculated using computer program NTSYS-pc
version 2.1 [25].
0.05
0.01
No. of
branches/plant
No. of days to
50% flowering
Earliness (no. of days
to 50% maturity)
Pod setting percentage
S1 to S0
S2 to S1
S1 to S0
S2 to S1
S1 to S0
S2 to S1
S1 to S0
S2 to S1
S1 to S0
S2 to S1
À2.5c
À5.9b
À11.2a
À5.3b
À3.4c
0.99
1.34
0.0058
5.8d
À1.6a
6.6e
2.1c
1.3b
0.743
1.84
0.0073
À11.4b
À6.7c
À14.0a
À4.3d
À2.5e
0.09
0.12
0.0014
5.1e
4.9d
2.3b
3.8c
1.3a
0.08
0.12
0.0060
À3.6c
À8.0a
À6.0b
À1.9d
À3.2c
0.65
0.88
0.0036
0.0b
2.9c
5.5d
2.9c
À2.5a
0.41
0.81
0.0053
À2.50b
À3.19ab
À3.60a
0.00c
À0.68c
0.84
1.14
0.0007
1.10b
À0.37a
5.60c
0.00a
À0.34a
0.92
1.12
0.0020
À0.08e
À5.67b
À4.56c
À10.20a
4.13d
0.72
0.98
0.0021
0.29a
8.21b
0.38a
12.75c
1.48a
1.24
1.38
0.0009
The means with the same letter indicate non significant differences, while the means with different letters indicate significant differences.
862
Table 2
H.A. Obiadalla-Ali et al.
Inbreeding depression (%) in some characters of 5 genotypes of faba bean in 3 levels of inbreeding (S0, S1 and S2).
Genotypes
Inbreeding depression
Total dry seed yield No. of pods/plant Weight of 100-seeds Shellout percentage Pod filling
P1
P2
P3
P4
P5
LSD
P-value
0.05
0.01
S1 to S0
S2 to S1
S1 to S0 S2 to S1 S1 to S0
S2 to S1
S1 to S0
3.11a
À3.08a
À3.55a
3.45a
À0.18a
29.74
40.30
0.140
0.79a
7.49a
6.72a
5.68a
2.55a
27.32
32.12
0.223
À4.64a
4.97d
1.52e
b
c
À3.89
4.28
À1.04b
À3.20d À0.43a À2.69a
0.11e
0.34b
1.00d
À3.54c
7.22e À0.09c
0.24
0.26
0.44
0.32
0.37
0.59
0.0002 0.0021 0.0039
0.08a
2.91c
4.24d
0.50b
0.04a
0.35
0.53
0.0069
2.32c
0.18b
À1.86c À2.84a
a
b
À5.78
0.50
À5.33b À0.47b
1.98c
2.01c
4.53e
2.36c
a
a
d
À6.37
À3.82
1.17
3.08d
À1.29c
0.44b
À7.54a 11.59e
0.53
0.49
0.01
0.01
0.72
0.76
0.01
0.12
0.0056
0.0030
0.0009 0.0040
S2 to S1
Protein Content
S1 to S0 S2 to S1 S1 to S0 S2 to S1
À0.66d
À3.73b
À8.90a
À1.86c
À1.03cd
0.89
1.21
0.0000
À9.29a
À10.19a
À0.51c
À2.67b
À0.24c
0.94
1.25
0.0003
The means with the same letter indicate non significant differences, while the means with different letters indicate significant difference.
non-significant positive differences between S2 and S1 generation for seed yield (Table 2). EI-Hady et al. [27] observed
highly significant positive inbreeding depression in the cross
Giza 3 · 899/503/89 for 100-seed weight and seed yield. On
the other hand significant negative estimates were found in
the cross Shambat 104 · Giza 3 for flowering date and in the
cross Giza 3 · 899/503/89 for number of seeds per plant. ELHarty et al. [28] pointed out that some crosses expressed significantly positive inbreeding depression and recorded a range of
10.5–31.4; 8.8–49.9; 10.7–31.2% and 6.8–43.5% for seed yield,
pods, seeds per plant and pods per main stem, respectively.
Abdalla and Fischbeck [29] reported several inbreeding effects
in F2 population of the hybrids minor · minor, minor · equina,
minor · major, equina · major and paucijuga · eu-faba types.
Inbreeding depression varied in different hybrids and characters. Generally equina · major hybrids expressed lowest
inbreeding depression and high inbreeding depression in F2
was associated mostly with high heterosis in F1. Inbreeding
gain (high values of F2 compared to F1) occurred in certain
characters. The latter mostly originated from combinations
that showed minus values for heterosis. In contrast, Abdalla
and Metwally [30] found that the inbreeding depression in F2
was not always associated with heterosis in F1. Gain and not
depression may occur in F2.
Inbreeding depression (ID %) was expressed for all studied
characters after the first cycle of selfing (S1). In this generation
there was a wide range of inbreeding depression among characters. The highest inbreeding depression occurred for No. of
branches/plant (À14.0%) followed by plant height (À11.2%)
and the least for weight of 100-seeds (À2.7%). No further significant decrease due to selfing was observed at the S2 generation. This could be attributed to that the parental genotypes
reach its genetic stability after only one cycle of selfing. Attia
[31] observed overall superiority of F1 hybrids for plant height,
pods per plant, seed yield per plant and harvest index that were
significantly depressed in F1’s as a result of inbreeding. However, significant inbreeding depression was observed in F2 for
number of branches and seed index. These results were agreement with those obtained by EL-Harty et al. [28] and, Bargale
and Billore [32].
Moreover our data showed that some genotypes had significant positive differences between S2 and S1. These positive differences could be attributed to the variance of parental
interaction with selfing generations. Although inbreeding in
faba bean is usually accompanied by reduction in yield [33],
some high-yielding inbred lines have been reported by Poulsen
and Knudsen [12].
Heterosis
Mid-parent heterosis values (%) were estimated for vegetative
and reproductive traits for all the 10 F1 hybrids in the three
levels of inbreeding S0, S1 and S2 (Table 3). Out of 10 crosses
only one cross (P1 · P3) at all levels, one cross (P3 · P5) at S1
level and three crosses (P2 · P4, P3 · P4 and P4 · P5) at S1 and
S2 levels showed significant positive increase in plant height.
Significant mid-parent heterosis for decreased number of days
to 50% flowering was detected in five, three and four crosses in
S0, S1 and S2 generations respectively, while six hybrids in S0
and four hybrids in S1 and S2 generations exhibited this heterosis in number of days to 50% maturity. It is clear that most
crosses showed positive significant mid-parent heterosis for
number of branches per plant, pod setting percentage in all levels of inbreeding, except the crosses P2 · P5 and P4 · P5 which
exhibited negative significant heterosis in the level S0 and S2
generations.
Table 4 presents mid-parent heterosis values (%) for yield
and quality traits for the 10 F1 hybrids in the three levels of
inbreeding. Number of pods per plant and seed yield showed
positive significant mid-parent heterosis in all crosses for the
three level of inbreeding, except the cross P2 · P3 in S0 and
P3 · P4 in S0 and S1 where heterosis for seed yield was nonsignificant. The highest values of mid-parent heterosis were
detected in the cross P1 · P2 at all levels of selfing for seed
yield and in the cross P3 · P4 in the level S1 and S2 for No.
of pod per plant. These results are in agreement with those
obtained by Farag and Afiah [34], who reported significant
positive heterosis for a number of traits. With respect to seed
yield per plant, seven crosses had significant positive heterotic
effects relative to mid and better parents under the two irrigation treatments. Abdelmula et al. [35] studied heterosis and
inheritance of faba been under well-watered and dry conditions and found significant mid parent heterosis for yield under
dry condition (Yd) and well-watered (Yw) but not for drought
tolerance (Yd/Yw). Furthermore the relative heterosis for Yd
(52.0%) was greater than for Yw (39.3%).
Significant negative heterosis was noticed in all crosses at
all levels of inbreeding for 100 seed weight, except P3 · P4 at
S1 levels. Significant mid-parent heterosis for greater shellout
percentage was detected in six hybrid combinations in S0, S1
Heterosis (%) value over Mid-parents in some characters of the 10 F1 hybrids of Faba bean in 3 levels of inbreeding (S0, S1, and S2).
Heterosis (%) over Mid-parents
Plant Height
P1 · P2
P1 · P3
P1 · P4
P1 · P5
P2 · P3
P2 · P4
P2 · P5
P3 · P4
P3 · P5
P4 · P5
LSD
0.05
0.01
P-value
No. of branches/plant
No. of days to 50% flowering
S0
S0
S1
S2
À6.4b
5.5g
À4.7c
À3.1cd
À8.6a
1.3f
À7.6ab
À0.2ef
À1.5de
À0.8e
1.624
2.190
0.0021
À4.2a
5.2e
À1.8c
À2.8abc
À2.3bc
8.3f
À3.4ab
7.6f
1.5d
5.7e
1.262
1.703
0.0001
À3.3a
15.2j
c
3.1
11.1g
À3.4a
9.0f
b
À0.5
1.8c
À3.1a
7.6e
e
8.8
14.6i
À2.6a
À1.7b
5.4d
13.2h
0.2b
5.3d
d
4.6
À2.8a
1.256
0.130
1.694
0.175
0.0074
0.0075
Earliness (No. of days to 50%
maturity)
Pod setting percentage
S1
S2
S0
S1
S2
S0
S1
S2
S0
S1
S2
23.3h
21.9g
15.0e
16.4f
24.7i
9.1c
2.9b
27.8j
14.1d
1.8a
0.152
0.205
0.0075
21.4g
14.0e
8.5c
2.9b
22.8h
14.4e
À4.3a
20.6f
12.5d
À4.2a
0.152
0.205
0.0075
0.4e
6.2g
1.9f
À5.9a
À6.5a
6.9g
À2.1c
À2.7bc
À0.8d
À3.5b
1.075
1.450
0.0089
3.8e
0.5cd
1.0d
À7.0a
À0.5c
8.7h
À1.8b
5.2f
5.6g
À1.8b
1.129
1.523
0.0068
7.0e
2.3c
1.4c
À6.7a
À5.4b
4.7d
1.8c
1.8c
5.1d
À4.5b
1.151
1.553
0.0008
À1.8bc
1.1e
À0.4cd
À5.2a
À2.9b
0.0de
À1.7bc
À0.4cd
À2.1b
À2.5b
1.455
1.963
0.0018
0.0c
0.9cd
0.9cd
À4.1a
0.9cd
À1.3b
À2.3b
2.2d
0.4c
À2.5b
1.176
1.587
0.0051
1.5e
À1.2c
2.9f
À5.5a
À2.0c
0.7de
0.2d
1.3de
À1.1c
À3.7b
1.111
1.499
0.0016
13.8e
5.0b
7.3d
21.9g
19.0f
7.2cd
19.0f
3.8a
6.2c
13.8e
1.078
1.454
0.0048
13.1c
À0.7a
À1.2a
25.0e
34.0h
19.8d
30.5g
9.1b
13.4c
26.5f
0.984
1.328
0.0088
21.9e
15.8d
10.2b
32.3g
27.6f
15.8d
27.3f
1.6a
32.2g
13.1c
1.059
1.429
0.0004
Breeding and RAPD studies of faba bean
Table 3
Crosses
The means with the same letter indicate non significant differences, while the means with different letters indicate significant difference.
Table 4
Heterosis value (%) over Mid-parents in yield and quality traits of the 10 F1 hybrids of Faba bean in 3 levels of inbreeding (S0, S1, and S2).
Crosses
P1 · P2
P1 · P3
P1 · P4
P1 · P5
P2 · P3
P2 · P4
P2 · P5
P3 · P4
P3 · P5
P4 · P5
LSD
P-value
Heterosis (%) over Mid-parents
Total dry seed yield
No. of pods/plant
Weight of 100-seeds
Shellout percentage
Pod filling
S0
S0
S0
S0
S0
S1
e
0.05
0.01
S2
e
j
114.4
128.8
115.7
91.3de 105.3de 102.7i
86.2cde 87.2cd
86.8h
75.1cde 71.1bc
77.8g
a
ab
23.0
45.3
32.0b
85.8cde 82.6cd
66.2f
acd
ab
53.1
43.5
39.0d
21.4a
27.1a
19.2a
46.0ac
57.7abc 46.5e
48.1ac
39.6ab 38.3c
42.882
33.196
6.051
57.853
44.785
8.164
0.0063
0.0019
0.0023
S1
h
39.4
27.0f
16.5b
38.5g
15.8a
25.4e
41.6j
39.9i
22.7c
24.0d
0.358
0.483
0.0017
S2
g
38.9
26.8d
13.3a
49.0 j
20.4b
26.4c
39.8h
48.1i
30.5f
29.5e
0.267
0.360
0.0063
h
41.0
24.4c
12.5a
36.8f
21.1b
24.6c
39.4g
49.4i
27.2d
29.5e
0.389
0.524
0.0055
S1
cd
À2.8
À3.3bc
À6.0a
À0.5g
À4.1b
À3.1cd
À1.5ef
À1.0fg
À2.3de
À2.8cd
0.988
1.332
0.0001
S2
f
À0.2
À0.8e
À4.0b
À2.5d
À0.6ef
À5.4a
À3.4c
1.2h
0.4g
À4.9a
0.516
0.696
0.0012
e
À2.4
À2.4e
À2.9d
À1.0f
À5.0b
À7.1a
À4.8b
À2.1e
À2.0e
À4.2c
0.404
0.546
0.0067
S1
f
8.9
9.3f
À4.7c
7.6e
À8.1a
9.3f
À6.3b
À4.1c
2.5d
9.3f
0.834
1.126
0.0053
S2
f
11.1
7.0e
À2.2bc
7.2e
À6.3a
16.4h
À2.9b
À1.6c
2.2d
13.9g
0.705
0.951
0.0000
g
10.7
5.8e
À0.2c
6.8f
À7.5a
18.6i
À3.3b
À0.5c
0.9d
16.0h
0.676
0.912
0.0009
Protein Content
S1
j
34.5
0.4b
21.2h
22.9i
19.7g
16.6f
8.2d
0.8c
À0.6a
12.0e
0.046
0.062
0.0085
S2
g
S0
j
13.2
25.7
À4.1c
À4.1c
18.9j
22.2i
12.6f
14.8g
d
4.5
6.4f
18.8i
21.2h
18.4h
5.5e
À8.2a
À7.9b
À6.4b
À10.4a
5.5e
0.0 d
0.014
0.014
0.020
0.020
0.0030
0.0064
S1
a
S2
c
À8.5
À7.2
À4.1ef
À1.9e
À7.6c
À3.3f
d
f
À3.4
2.9
À4.5ef
À4.4cd À15.3a
À8.5c
c
e
À5.5
À0.3
À6.5d
6.8g
6.5h
À3.1f
b
b
À6.8
À8.7
À8.7c
À9.0a
À7.4c
À12.0b
3.5f
5.3g
À4.9e
À3.8d
À4.4d
-15.6a
1.197
1.056
1.281
1.615
1.425
1.729
0.0007
0.0003
0.00005
The means with the same letter indicate non significant differences, while the means with different letters indicate significant difference.
863
864
H.A. Obiadalla-Ali et al.
and S2 levels. The heterosis values for this trait differed across
the generation levels, for instance it ranged from À8.1 to +9.3
in the S0 generation.
Significant mid-parent heterosis for greater pod filling (%)
was detected in all crosses, except the cross P3 · P5 which
showed significant negative heterosis in the three levels of
inbreeding, whereas P3 · P4 and P1 · P3 showed significant
negative heterosis in hybrids derived from both the S1 and S2
generations. Only one cross (P1 · P4) at S1 level and two
crosses (P2 · P4 and P3 · P5) at both S0 and S1 levels showed
a significant positive increase in protein content percentage.
On the other hand, significant negative heterosis was noticed
in all levels of crosses for P1 · P2, P1 · P3, P1 · P5, P2 · P3,
P2 · P5, P3 · P4 and P4 · P5. Abd El-Aziz [36] found significant estimates for heterosis and inbreeding depression for most
of the studied traits in most crosses in F2 generation. Bargale
and Billore [32] studied 21 F1 and F2 faba bean hybrids and
concluded that parental diversity was not associated with
greater heterosis. High heterosis was found to be coupled with
high inbreeding depression in a number of cross-combinations
for yield and some yield components.
In this study mid-parent heterosis values (%) were estimated for all traits of the 10 F1-hybrids at the 3 levels of
inbreeding. For most characters some hybrids showed significant positive heterosis over mid-parent value. These results
were in accordance with those of many investigators such as
Ibrahim [5] who found several crosses recorded significant
positive heterosis percentages relative to mid parent and better
parent for seed yield per plant and 100-seed weight ranging
from 17.46–84.95% and, 8.53–23.26% relative to mid-parent,
respectively. Obiadalla-Ali et al. [6] stated that, the majority
of crosses exhibited significant better parents heterosis estimates for all studied traits.
On the other hand, some crosses in our investigation,
showed significant negative values of heterosis i.e. heterosis
depression. Some hybrids in faba bean show negative heterosis
for some traits [5,9,37,38]. Additive gene action was predominant for these traits. Significant effect for several traits such as
number of branches per plant, pod setting percentage, number
of pods per plant, 100-seed weight, shellout percentage and
pod filling percentage [34,39]. These heterotic effects may
range from significantly positive to significantly negative for
various traits according to genetic makeup of the parents. Heterotic effects over mid and better parents were detected in most
crosses by EL-Harty et al. [28]. Positive and significant heterosis percentages over mid-parents or better parent were
reported for faba bean characters which varied according to
the cross combinations and traits [38,39], Generally, high
SCA effects in faba bean for yield and related traits were associated with genetic diversity of parents.
There was a wide range in level of heterosis value over the
mid-parent in respect of the level of hybrid vigor (Table 4)
obtained in the studied traits. The highest values of heterosis
over the mid-parent occurred for total dry seed (128.8%) followed by No. of pods/plant (49.4%), pod filling percentage
(34.5%), pod setting percentage (34.0%), No. of branches/
plant (24.7%), shellout percentage (18.6%), plant height
(8.8%) and protein content percentage (6.8%). The lowest
value of heterosis was shown by weight of 100-seeds (1.2%).
The highest values of heterosis were generally obtained
when P2 (Giza 843) was included in the cross, so it can be concluded that the genotype P2 can be considered the best general
combiner for most traits. Moreover, it was also found that specific combinations among the studied parents gave the highest
heterosis values over mid-parent. For example cross (P1 · P2)
was the best cross for total dry seed yield and pod filling percentage, cross (P2 · P3) for No. of branches/plant and pod setting percentage, cross (P2 · P4) for shellout percentage and
protein content percentage and cross (P3 · P4) for No. of
pods/plant. The frequency and level of heterosis were related
more to SCA than to the genetic divergence of the parents in
faba bean [5,6,28,39].
Level of polymorphism
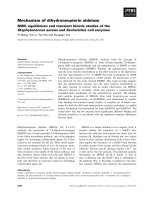
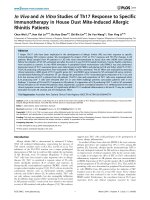
Twelve out of 20 arbitrary primers revealed genetic polymorphism among the five parental genotypes (Table 5). A total
of 65 amplification products were scored polymorphic (Fig. 1
and Table 5). The percentage of polymorphic bands detected
ranged from 33% (OPA-13) to 100% (OPG-09) with an average of 66.47% (Table 5). The range of polymorphic bands was
Table 5 Primers used in RAPD analysis, total number of fragments detected by each primer and polymorphism among five parental
faba bean genotypes.
Primer Name
Primer sequence (50 fi 30 )
1
2
3
4
5
6
7
8
9
10
11
12
TCACGTACGG
GACCGCTTGT
CTGACGTCAC
CCCCGGTAAC
GGTCGGAGAA
GTTGTTTGCC
AAGTGCACGG
TCCTCGTGGG
CACAGCGACA
CAGCACCCAC
CATACCTGCC
GGTCGGAGAA
Amplified bands
Polymorphic bands (%) Fragments size base pair
Fragments number Polymorphic bands
Total
Mean
OPAM-01
OPA-17
OPG-09
OPP-05
OPH-01
OPAW-10
OPAD-06
OPAT-08
OPW-13
OPA-13
OPAR-05
OPF-20
9
12
8
11
9
5
9
4
7
3
10
4
8
9
8
6
7
2
6
2
5
1
9
2
88.9
75.0
100
54.5
78.0
40.0
66.7
50.0
71.0
33.0
90.0
50.0
91
7.58
65
5.42
66.47%
Larger
Smaller
687
1150
1018
1088
1300
720
1237
555
915
573
1228
900
188
97
435
230
325
202
178
245
200
255
160
315
Breeding and RAPD studies of faba bean
865
1500bp
500bp
100bp
OPAM-01
1500bp
OPA-17
500bp
300bp
OPG-09
1500bp
OPP-05
500bp
OPAW-10
OPH-01
500bp
OPAD-06
100bp
OPAT-08
500bp
OPW-13
100bp
1500bp
OPA-13
500bp
100bp
OPAR-05
Fig. 1
OPF-20
RAPD profiles obtained for five parental faba bean genotypes amplified with 12 primers and M = 100 bp ladder size marker.
1 to 9 with an average of 5.42 per primer. Similar results of
level of polymorphism were obtained using different DNA
markers such as: RFLP (61.9%) [40]; RAPD (76.6%) [17];
SSR (72%) [41] and SSAP (71%) [42]. The level of polymorphism obtained in this study was smaller than 86.90%
obtained by Alghamdi [43] using RAPD markers. The overall
numbers of amplified bands per primer were in agreement with
those obtained by Abdel Sattar and El-Mouhamady [44] but
smaller than those obtained by Tanttawi et al. [17], who
reported a range from 3 to 21 bands with an average of 11.8
bands. The fragments sizes obtained were from 97 (OPA-17)
to 1300 bp (OPH-01) (Table 5). Similar results were obtained
866
H.A. Obiadalla-Ali et al.
by El-Sayed et al. [18], applying RAPD markers on Egyptian
faba bean.
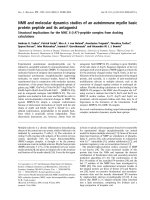
Dendrogram analysis
Genetic relationships based on RAPD markers revealed that
the genetic similarities among faba bean genotypes ranged
from 0.61 (Giza 40 and Giza 843) to 0.77 (Misr 1 and Misr
2) (Table 6). The genetic similarity values ranged from 0.55
to 0.83 among 6 different varieties using RAPD markers
[17]. Zeid [45] reported similar values, ranging from 0.53 to
0.88 among 79 inbred lines of recent elite faba bean using
ALFP markers. The five parental genotypes separated into
three clusters (Fig. 2). The first cluster contained Misr 1 and
Misr 2 at a relatively high level of similarity of 0.77. Giza 40
and Giza 429 clustered at 0.75 level of similarity on the second
cluster. Giza 843 was alone in the third cluster which clustered
at 0.66 level of similarity with the other genotypes in this study.
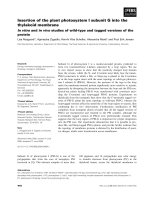
The Euclidean distance, based on the means of quantitative
traits was calculated to establish the relationship among genotypes. The range of Euclidean distance among the genotypes
was relatively wide from 18.54 (Misr 2 and Giza 429) to
233.44 (Misr 1 and Giza 40) (Table 7). Our result indicated
that the amount of phenotypic variation among these parental
lines was relatively high and reflects the genetic diversity of the
genes controlling these characters. The five genotypes divided
into two distinct clusters. Bootstrap values (Fig. 3) showed a
pattern of high genetic variation, where Misr 1 was in the first
cluster separated from the other genotypes at a wide Euclidean
distance of 169.57. The second cluster sub-divided into three
sub-clusters, the first sub-cluster included Misr 2 and Giza
429, which separated at relatively low Euclidean distance of
18.54. The second sub-cluster contained Giza 843 which clustered at 53.48 with the first sub-cluster, and Giza 40 was alone
in the third sub-cluster.
Table 7 Euclidean distance matrix of five parental faba bean
genotypes using means of all studied characters.
Genotypes
Misr 2
Giza 429
Misr 1
Giza 40
Giza 843
Misr
Giza
Misr
Giza
Giza
0.00
18.54
156.58
78.35
47.54
0.00
172.19
61.73
60.14
0.00
233.44
116.07
0.00
120.79
0.00
2
429
1
40
843
Table 6 Similarity matrix (%) for five parental faba bean
genotypes according to Nei and Li’s coefficient obtained from
91 RAPD bands.
Genotypes
Misr 2
Giza 429
Misr 1
Giza 40
Giza 843
Misr
Giza
Misr
Giza
Giza
1.00
0.70
0.77
0.71
0.72
1.00
0.72
0.75
0.61
1.00
0.69
0.69
1.00
0.61
1.00
2
429
1
40
843
Fig. 2 Dendrogram generated by UPGMA cluster analysis
according to Nei and Li’s coefficient using 91 RAPD bands among
five parental faba bean genotypes.
Fig. 3 Dendrogram based on UPGMA cluster analysis showing
the Euclidean distances among five parental faba bean genotypes
using means of all studied characters.
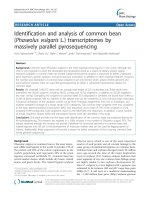
Fig. 4 Correlation between Euclidean distance and RAPD
distance methods generated by NTSYS-pc Ver. 2.1 program.
Breeding and RAPD studies of faba bean
The correlation between Euclidean distance and RAPD distance was not significant r = (0.085) (Fig. 4). A negative correlation of À0.40 between Euclidean and RAPD distances
was obtained by Tanttawi et al. [17]. The observed relationships using molecular markers may provide information on
the history and biology of cultivars but it does not necessarily
reflect what may be observed with respect to agronomic traits
[46]. Genetic markers such as RAPDs may accurately assay the
degree of genetic change between two genomes, but they may
not necessarily reflect the divergence in terms of changes in
traits of agronomic importance.
Conclusions
From the data presented in this investigation, it can be concluded that improvement of most traits of faba bean could
be achieved by hybridization among the studied parental genotypes. While some specific combinations among these parents
produced the highest values of heterosis over mid-parent, P2
(Giza 429) can be considered to be the best general combiner
for most traits.
Some traits of faba bean showed some inbreeding depression after the first cycle of selfing (S1) whereas no further,
decrease was found at the S2 generation. This indicates that
stability of the genetic constituent of these parental genotypes
could be achieved after one selfing generation. Therefore,
hybridization among these parents at the S1 or S2 generations
is recommended. Hybrid progeny of stable parents exhibited
stability for its traits. RAPD markers and agronomic characterization will be useful tools for assessing the genetic diversity,
and understanding the breeding patterns of faba bean.
Conflict of Interest
The authors have declared no conflict of interest.
Compliance with Ethics Requirements
This article does not contain any studies with human or animal
subjects.
References
[1] Bond DA, Lawes DA, Hawtin GC, Saxena MC, Stephens JS.
Faba Bean (Vicia faba L.). In: Summerfield RJ, Roberts EH,
editors. Grain Legume Crops. 8 Grafton Street, London, WIX
3LA, UK: William Collins Sons Co. Ltd.; 1985. p. 199–265.
[2] Jambunathan R, Blain HL, Dhindsa KH, Hussein LA, Kogure
K, Li-Juan L, et al. Diversifying use of cool season food
legumes through processing. In: Muehlbauer FJ, Kaiser WJ,
editors. Expanding the production and use of cool season food
legumes. Dordrecht, The Netherlands: Kluwer Academic
Publishers; 1994. p. 98–112.
[3] Chavan JK, Kute LS, Kadam SS. In: Salunkhe DD, Kadam SS,
editors. CRC hand book of world legumes. Boca Raton,
Florida, USA: CRC Press; 1989. p. 223–45.
[4] Haciseferogullari H, Gezer I, Bahtiyarca Y, Menges HO.
Determination of some chemical and physical properties of Sakiz
faba bean (Vicia faba L. var. major).. J Food Eng 2003;60:475–9.
[5] Ibrahim HM. Heterosis, combining ability and components of
genetic variance in faba bean (Vicia faba L.). JKAU: Met
Environ Arid Land Agric Sci 2010;21(1):35–50.
867
[6] Obiadalla-Ali HA, Mohamed NEM, Glala AAA, Eldekashy
MHZ. Heterosis and nature of gene action for yield and its
components in faba bean (Vicia faba L.). J Plant Breed Crop Sci
2013;5(3):34–40.
[7] Suso MJ, Moreno MT. Variation in outcrossing rate and genetic
structure on six cultivars of Vicia faba L. as affected by
geographic location and year. Plant Breed 1999;118:347–50.
[8] Gasim S, Abdelmula A, Khalifa J. Analysis of the degree of
cross fertilization and autofertility and their impact on breeding
faba bean (Vicia faba L.) cultivars grown in Sudan. Afr J Agric
Res 2011;6(30):6387–90.
[9] Gasim S, Hejien H, Khalifa J, Awadalla A. Effect of selffertilization on performance, breeding and germplasm
management of four local faba bean cultivars. J Agric Sci
Tech 2013;B3:182–8.
[10] Gasim S, Link W. Agronomic performance and the effect of selffertilization on German winter faba beans. J Cent Eur Agric
2007;8(1):121–8.
[11] Hebblethwaite PD, Scott RK, Kogbe GOS. The effect of
irrigation and bees on the yield and yield components of Vicia
faba L. In: Hebblethwaite PD, Dawkins TCK, Health MC,
Lockwood G, editors. Vicia faba: agronomy, physiology
and breeding. The Hague: Martinus Nijhoff/W. Junk; 1984.
p. 71–94.
[12] Poulsen MH, Knudsen JCN. Breeding for many small seeds/pod
in Vicia faba L.. FABIS Newslett 1980;2:26–8.
[13] Young ND, Mudge J, Ellis TN. Legume genomes: more than
peas in a pod. Curr Opin Plant Biol 2003;6(2):199–204.
[14] Pearce SR, Harrison G, Li D, Heslop-Harrison D, Kumar A,
Flavell A. The Ty1-copia group retrotransposon in Vicia species:
copy number, sequence heterogeneity and chromosome
localisation. Mol Gen Genet 1996;250:305–15.
[15] Torres AM, Weeden NF, Martı´ n A. Linkage among isozymes,
RFLP and RAPD markers in (Vicia faba L.). Theor Appl Genet
1993;85:937–45.
[16] Vaz Patto MC, Torres AM, Koblizkova A, Macas J, Cubero JL.
Development of a genetic composite map of Vicia faba using F2
populations derived from trisomic plants. Theor Appl Genet
1999;98:736–43.
[17] Tanttawi DM, Khaled AGS, Husni MH. Genetic studies for
some agronomic characters in faba bean (Vicia faba L.). Assiut J
Agric Sci 2007;38(4):117–37.
[18] El-Sayed FA, Soliman SSA, Ismail TA, Sabah MA. Molecular
markers for Orobanche crenata resistance in faba bean (Vicia
Faba L.) using Bulked Segregant Analysis (BSA). Nat Sci
2013;11:102–9.
[19] Gomez KA, Gomez AA. Statistical procedures for agricultural
research. 2nd ed. USA: John Wiley & Sons, Inc.; 1984.
[20] Poresbski SL, Bailey G, Baum RB. Modification of CTAB DNA
extraction protocol for plants containing high polysaccharide
and polyphenol components. Plant Mol Biol Rep 1997;12:8–15.
[21] Williams JGJ, Kubelik AR, Livak KJ, Rafalski JA, Tingey SV.
DNA polymorphisms amplified by arbitrary primers are useful
as genetic markers. Nucl Acids Res 1990;18:6531–5.
[22] Nei M, Li WH. Mathematical model for studying genetic
variation in terms of restriction endonucleases. Proc Natl Acad
Sci USA 1979;76:5269–73.
[23] Laghetti G, Pignone D, Sonnante G. Statistical approaches to
analyse gene bank using lentil germplasm collection as a case
study. Agr Constr Sci 2008;73:175–81.
[24] Mantel NA. The detection of disease clustering and generalized
regression approach. Cancer Res 1967;27:209–20.
[25] Rohlf FJ. NTSYS-pc: Numerical taxonomy and multivariate
analysis system. Version 2.1 Exeter Software, Setauket, USA;
2000.
[26] Nassib AM, Khalil SA. Population improvement in faba bean.
In:
Hawtin
G,
Webb
C,
editors.
Faba
Bean
Improvement. ICARDA; 1982. p. 71–4.
868
[27] EI-Hady MM, Omar MA, Nasr SM, Ali KA, Essa MS. Gene
action on seed yield and some yield components in F1 and F2
crosses among five faba bean (Vicia faba L.) genotypes. Bulletin
of Faculty of Agriculture. University of Cairo; 1998. p. 369–88,
49.
[28] EL-Harty EH, Shaaban M, Omran MM, Ragheb SB. Heterosis
and genetic analysis of yield and some characters in Faba bean
(Vicia faba L.) Minia. J Agric Res Develop 2007;27(5):897–913.
[29] Abdalla MMF, Fischbeck G. Hybrids between subspecies and
types of (Vicia faba L.) grown under cages and in growth
chambers. In: 1st Conf. of agron. Egypt. soc. of crop sci., Cairo
April; 1983. pp. 51–71
[30] Abdalla MMF, Metwally AA. Selection in early segregating
generation of faba beans, Egypt. J Genet Cytol 1983;12:41–51.
[31] Attia SM. Performance of some faba bean genotypes and
hybrids and reaction to Orobanche. Ph.D. Thesis, Fac. Agric.,
Cairo University. Egypt; 1998.
[32] Bargale M, Billore SD. Parental diversity, heterosis and
inbreeding depression over environments in faba bean. Crop
Improve 1990;17(2):133–7.
[33] Lawes DA, Bond DA, Poulsen MH. Classification, breeding
methods and objectives. In: Habblethwaite PD, editor. The faba
bean (Vicia faba L.). London: Butterworth; 1983. p. 23–76,
231.
[34] Farag HIA, Afiah SA. Analysis of gene action in diallel crosses
among some faba bean (Vicia faba L.) genotypes under Maryout
conditions. Ann Agric Sci 2012;57(1):37–46.
[35] Abdelmula AA, Link W, von Kittlitz E, Stelling D. Heterosis
and inheritance of drought tolerance in faba bean, Vicia faba L..
Plant Breed 1999;118:485–90.
[36] Abd El-Aziz AM. Diallel analysis of some quantitative traits in
faba bean (Vicia faba L.). M. Sc. Thesis, Fac. Agric., Zagazig
University Egypt; 1993.
H.A. Obiadalla-Ali et al.
[37] Link W, Balko C, Stoddard FL. Winter hardiness in faba bean:
physiology and breeding. Field Crops Res 2008;115:287–96.
[38] Darwish DS, Abdalla MMF, El-Hady MM, El-Emam EAA.
Investigation on faba beans (Vicia faba L.) diallel and triallel
mating using five parents. Egypt J Plant Breed 2005;9:197–208.
[39] El-Hady MM, Attia Olaa SM, El-Galaly AM, Salem MM.
Heterosis and combining ability analysis of some faba bean
genotypes. J Agric Res Tanta Univ 2006;32:134–48.
[40] Gresta F, Avola G, Albertini E, Raggi R, Abbate V. A study of
variability in Sicilian faba bean landrace ‘Larga di Leonforte’.
Genet Resour Crop Evol 2010;57:523–31.
[41] Zeid M, Mitchell S, Link W, Carter M, Nawar A, Fulton T,
et al. Simple sequence repeats (SSRs) in faba bean: new loci
from Orobanche-resistant cultivar ‘Giza 402’. Plant Breed 2009;
128:149–55.
[42] Ouji A, El Bok S, Syed HN, Abdellaoui R, Rouaissi M, Flavell
AJ, et al. Genetic diversity of faba bean (Vicia faba L.)
populations revealed by sequence specific amplified
polymorphism (SSAP) markers. Afr J Biot 2012;11:2162–8.
[43] Alghamdi SS. Varietal identification and genetic purity
assessment of F1 hybrid seeds using RAPD markers in faba
bean (Vicia faba L.). ISHS Acta Horticulturae No. 829; 2009. p.
269–274.
[44] Abdel Sattar AA, El-Mouhamady AA. Genetic analysis and
molecular markers for yield and its components traits in faba
bean (Vicia Faba L.). Aust J Basic Appl Sci 2012;7:458–66.
[45] Zeid MM. Analysis of genetic diversity based on molecular
markers (AFLP) and of heterosis in faba bean (Vicia faba L.)
PhD Thesis, Faculty of Agricultural Science, Georg-AugustUniv. Goettingen; 2003.
[46] Metais I, Aubry C, Hamon B, Jalouzot R. Description and
analysis of genetic diversity between commercial bean lines
(Phaseolus vulgaris L.). Theor Appl Genet 2000;101:1207–14.