Evaluation of a new recombinant inbred line mapping population for genetic mapping in groundnut (Arachis hypogaea L.)
Bạn đang xem bản rút gọn của tài liệu. Xem và tải ngay bản đầy đủ của tài liệu tại đây (559.24 KB, 10 trang )
Int.J.Curr.Microbiol.App.Sci (2019) 8(1): 2956-2965
International Journal of Current Microbiology and Applied Sciences
ISSN: 2319-7706 Volume 8 Number 01 (2019)
Journal homepage:
Original Research Article
/>
Evaluation of a New Recombinant Inbred Line Mapping Population for
Genetic Mapping in Groundnut (Arachis hypogaea L.)
M. Sukruth, K. Shirasawa and R.S. Bhat*
Department of Biotechnology, UAS, Dharwad, Karnataka (580 005), India
*Corresponding author
ABSTRACT
Keywords
Groundnut, Recombinant
inbred lines, Late leaf
spot and rust diseases,
Productivity traits,
Variability, Parental
polymorphism
Article Info
Accepted:
20 December 2018
Available Online:
10 January 2019
A new recombinant inbred line (RIL) population was developed from a late leaf spot
(LLS) susceptible mutant (VL 1) and its secondary mutant (110) which was resistant to
LLS. The RILs (114) were evaluated for yield, yield components, nutritional and oil
quality traits, and response to LLS and rust diseases during the rainy season of 2015 to
assess the suitability of the mapping population for mapping these traits. The RILs differed
significantly for all the traits studied. Phenotypic coefficient of variation and genotypic
coefficient of variation were moderate to high for pod yield, number of pods per plant, pod
weight per plant, shelling percentage, test weight, protein, oleic to linoleic acid ratio,
kernel yield, oil yield, and LLS and rust score at 70, 80 and 90 days after sowing (DAS).
The RILs exhibited normal distribution for all the studied traits except for rust score at 80
and 90 DAS, and shelling percentage. VL 1 and 110 despite being the primary and
secondary mutants, showed polymorphism in terms of SNP, CNV and transposable
element insertion. Therefore, this RIL population could be of importance for mapping the
agronomic and productivity traits.
Introduction
The cultivated allotetraploid (2n = 4x = 40)
groundnut (Arachis hypogaea L.) is an
important oilseed, food and legume crop with
a global production of 42.29 mt from 25.46
mha area. India has the largest groundnutgrowing area of 5.50 mha with 6.30 mt
production and 1,150 kg/ha productivity
(FAO, 2017). Groundnut is regarded as “king
of oilseed crops” on account of its diversified
uses. Groundnut is an excellent source of plant
protein (25–28%), oil (48–50%), calcium, iron
and vitamin B complex like thiamine,
riboflavin, niacin and vitamin A. The haulms
are used as livestock feed. Groundnut offers
many health benefits like weight gain control
(Alper and Mattes, 2002), prevention of
cardiovascular diseases, protection against
Alzheimer disease and cancer inhibition
(Awad et al., 2000).
Groundnut is affected by various diseases and
pests
which
limit
its
productivity.
Conventional breeding had less impact on
delivering
disease/pest
resistant/tolerant
cultivars to the farmers because of complex
inheritance of the gene controlling the trait,
narrow genetic diversity (Pandey et al., 2012)
and more over it is highly dependent on
2956
Int.J.Curr.Microbiol.App.Sci (2019) 8(1): 2956-2965
phenotypic selection. So, with the aid of
molecular markers, n number of genotypes
can be screened and best genotype/line can be
selected based on genotype of the material
rather than phenotype, which further enhances
the breeding efficacy in identifying promising
progeny/line for the trait of interest.
Genomics-assisted breeding (GAB) has
accelerated crop improvement programs for
development of improved cultivars. Likewise,
LLS (Phaeoisariopsis personata [(Berk. and
Curt) Deighton)] and rust (Puccinia arachidis
Speg.) is a highly devastating disease among
all cultivable areas. Many conventional and
molecular breeding strategies were utilised in
developing several mapping populations
(RILs, NILs, MABCs) to identify significant
and major QTL controlling the trait. Many
molecular marker systems had been validated
using RFLP, AFLP, DAF, SSR, DArT, AhTE
and SNPs. In groundnut, GAB has been
successful for rust resistance.
QTL and markers were identified (Khedikar et
al., 2010; Sujay et al., 2012; Varshney et al.,
2014; Kolekar et al., 2016; Zhou et al., 2016,
Yeri and Bhat, 2016), validated (Khedikar et
al., 2010; Yeri et al., 2014; Sukruth et al.,
2015) and used for marker-assisted
backcrossing (MABC) (Varshney et al., 2014;
Yeri et al., 2016; Pasupuleti et al., 2016;
Kolekar et al., 2017). Recently, MABC was
also attempted to develop LLS resistant
genotypes. However, genomic dissection of
LLS resistance is expected to enhance the
efficiency of MABC further.
This could be achieved with the use of
appropriate mapping populations. In this
regard, VL 1, a Valencia type rust resistant
mutant was obtained from Dharwad Early
Runner (DER), a cross between two fastigiata
cultivars, viz. Dh 3-20 and CGC-1 (Gowda et
al., 1989). Further EMS mutagenesis in VL 1
gave rise to a Spanish type LLS resistant
mutant (110) (Gowda et al., 2010). VL 1 and
110 also differed for main stem length,
primary and secondary branches, leaves, pods,
kernels, and response to late leaf spot and rust
disease.
Considering these phenotypic differences, a
RIL population was developed by crossing VL
1 with 110 at UAS, Dharwad, India. The RILs
derived from the closely related parents have
been shown to be useful in mapping the traits
(Hake et al., 2017). Therefore, an effort was
made in this study to assess the extent of
polymorphism between VL 1 and 110, and to
evaluate their RILs for suitability to map the
traits in groundnut.
Materials and Methods
The present study employed a RIL mapping
population (MP) derived from VL 1 × 110.
The field evaluation of 114 RILs along with
the parents (VL 1 and 110) was carried out
during the rainy season of 2015 (R–15) at
IABT Garden (E115) of Main Agricultural
Research Station, UAS, Dharwad. The
experiment was laid out in randomized block
design (RBD) with two replications where the
plants were spaced at 30 × 10 cm. All
recommended package of practices was
followed to raise good crop.
Observations were recorded on the
productivity and nutritional traits. Pod yield
(PY), number of pods per plant (NPPP), pod
weight per plant (PWPP), shelling percentage
(SP), test weight (TW) and sound mature
kernel weight (SMKW) were recorded as per
the groundnut descriptor (IBPGR\ICRISAT,
1992). Nutritional traits such as percent
protein and oil content of each genotype was
estimated by near infrared spectroscopy
(NIRS) using FOSS NIR System, 6500
Composite (FOSS Analytical A/S, Denmark)
at Seed Quality Testing and Research
Laboratory, Seed Unit, UAS, Dharwad.
2957
Int.J.Curr.Microbiol.App.Sci (2019) 8(1): 2956-2965
Response to LLS and rust were recorded at 70,
80 and 90 days after sowing (DAS) using the
modified 9-point scale (1–9 score) (Subbarao
et al., 1990) on randomly selected five plants
from each genotype. The phenotypic data
were analysed for ANOVA, variability and
association using Windostat Version 9.1.
Frequency distribution of the RILs checked
using SPSS Version 16.0. VL 1 and 110 were
subjected for whole genome re-sequencing
(WGRS) to identify the single nucleotide
polymorphism (SNP) and copy number
variation (CNV) (Shirasawa et al., 2016).
Results and Discussion
Groundnut improvement through application
of genomic tools requires identification of
gene/QTL linked to trait of interest.
Development of mapping populations, marker
discovery and screening with DNA/molecular
markers and identification of QTL associated
with economically important target traits are
the most important steps in marker assisted
selection. Contrasting parents differing for rust
and LLS disease could help in dissecting the
QTL (Pandey et al., 2017). VL 1 being rust
resistant and LLS susceptible and 110 being
LLS resistant and rust susceptible allow
dissection of rust and LLS resistance.
Therefore, the RILs derived from these
parents were evaluated for various traits. The
RILs differed significantly for all productivity
and nutritional traits and response to LLS and
rust disease at 70, 80 and 90 DAS (Table 2).
VL 1 recorded a score of 8 for LLS at 90
DAS, whereas 110 recorded a score of 3.5.
However, not much difference was observed
between the parents for the score of rust. The
parents also differed significantly for pod
yield, number of pods per plant, pod weight
per plant, shelling percentage, test weight,
sound mature kernel weight, protein, oil, oleic
to linoleic acid ratio, kernel and oil yield
(presented in table 2 along with CV and CD).
Considerably wide range was observed among
the RILs for all productivity, nutritional and,
LLS and rust disease reaction traits.
High PCV and GCV were observed for
number of pods per plant, pod weight per
plant, oleic to linoleic acid ratio. Traits such as
test weight, protein and LLS disease reaction
at 90 DAS exhibited moderate PCV and GCV,
whereas low PCV and GCV was observed for
sound mature kernel weight and oil content
(Table 4). Pod yield, kernel yield, oil yield,
LLS disease response at 70 and 80 DAS, and
rust disease response at 70, 80 and 90 DAS
recorded high PCV and moderate GCV.
Shelling percentage exhibited moderate PCV
with low GCV.
The distribution of the RILs of VL 1 × 110 for
quantitative characters (productivity, nutrition
and disease reaction) was studied by working
out the Skewness and kurtosis (Zhang et al.,
2014) using SPSS version 16.0 software.
Skewness ranging from -2 to +2 suggested a
normal distribution, where 0 skewness
indicated a perfect symmetric distribution.
Skewness below or above the range (-2 to +2)
indicated a negatively and positively skewed
distribution, respectively (Lomax and HahsVaughn, 2013). Kurtosis ranging from -3 to
+3 indicated a normal distribution. RILs
showed normal distribution for all the traits
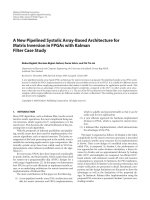
studied except for shelling percentage. Rust
disease score at 80 and 90 DAS showed
skewed kurtosis (Table 1 and Fig. 1).
Knowledge on the trait association would help
in trait mapping. Pod yield had positive and
significant association with pod weight per
plant, shelling percentage, test weight, sound
mature kernel weight, kernel and oil yield.
Number of pods per plant was positively and
significantly associated with test weight, LLS
score at 90 DAS, and rust score at 80 and 90
DAS. Pod weight per plant, shelling
percentage, test weight and sound mature
2958
Int.J.Curr.Microbiol.App.Sci (2019) 8(1): 2956-2965
kernel weight had positive and significant
association with kernel and oil yield.
Similarly, kernel and oil yield, LLS and rust
disease response at 70, 80 and 90 DAS are
positively and significantly associated with
each other. But, LLS and rust disease reaction
was observed to be negatively associated with
each other (Table 3).
Fig.1 Frequency distribution of the RILs of VL 1 × 110 population for LLS and rust reaction
2959
Int.J.Curr.Microbiol.App.Sci (2019) 8(1): 2956-2965
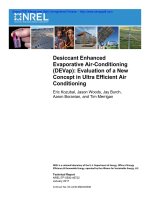
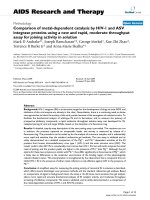
Fig.2 Copy number variation in 110 when compared to VL 1
Table.1 Frequency distribution of the RILS of VL 1 × 110 for productivity, nutritional and
disease reaction traits
Traits
PY
NPPP
PWPP
SP
TW
SMKW
PROTEIN
OIL
O/L
KY
OY
LLS_70
LLS_80
LLS_90
RUST_70
RUST_80
RUST_90
Skewness
-0.27
0.402
1.269
-3.923
-0.032
-1.141
-0.846
-0.316
1.495
-0.564
-0.433
-0.561
-0.954
-1.235
0.996
2.015
2.094
Kurtosis
-0.192
-0.45
2.335
23.169
-0.397
1.484
1.231
0.959
2.231
0.956
0.742
-0.139
0.53
1.094
-0.458
4.415
4.738
Distribution
Normal
Normal
Normal
Skewed kurtosis
Normal
Normal
Normal
Normal
Normal
Normal
Normal
Normal
Normal
Normal
Normal
Skewed kurtosis
Skewed kurtosis
PY: Pod yield (kg/ha); NPPP: Number of pods per plant; PWPP: Pod weight per plant (g); SP: Shelling percentage
(%); TW: Test weight (g); SMKW: Sound mature kernel weight (%);O/L: Oleic to linoleic acid ratio; KY: Kernel
yield (kg/ha); OY: Oil yield (kg/ha); LLS_70: Late leaf spot score at 70 days after sowing (DAS); LLS_80: Late leaf
spot score at 80 DAS; LLS_90: Late leaf spot score at 90 DAS; RUST_70: Rust score at 70 DAS; RUST_80: Rust
score at 80 DAS; RUST_90: Rust score at 90 DAS
2960
Int.J.Curr.Microbiol.App.Sci (2019) 8(1): 2956-2965
Table.2 ANOVA for productivity, nutritional and disease reaction traits in the RIL population of VL 1 × 110
Source of
variation
Replication
MSS
Genotype
MSS
Error MSS
CV
CD at 5%
SEm±
df
PY
NPPP
PWPP
SP
TW
SMKW
PROTEIN
OIL
O/L
KY
OY
LLS_70
LLS_80
LLS_90
RUST_70
RUST_80
RUST_90
1
68.2E03
1.46
0.21
11.65
44.31
0.34
0.03
1.70
0.22
33.4E02
33.3E02
1.24
2.08
5.28
0.15
0.52
0.06
115
80.1E04**
31.55**
105.95**
85.85**
158.63**
10.06**
20.18**
11.58**
0.59**
53.5E04**
13.4E04**
0.97**
2.19**
2.67**
0.27**
0.77**
1.22**
115
34.6E04
14.95
641.09
433.05
1.87
7.85
1.97
1.37
1.00
10.47
2.43
1.65
41.02
9.50
7.93
5.64
28.79
8.15
5.90
4.05
6.00
2.47
3.19
2.29
0.98
3.30
1.20
0.97
0.79
1.71
1.01
0.82
0.11
18.93
0.42
0.33
22.3E04
18.42
507.95
339.45
52.0E03
18.75
245.69
164.48
0.51
19.23
0.87
0.62
1.09
17.59
1.23
0.87
1.54
16.91
1.55
1.11
0.17
11.47
0.42
0.25
0.25
11.47
0.50
0.30
0.23
8.43
0.48
0.28
*, **: Significant at 5% and 1%, respectively; df: degrees of freedom; CV: Coefficient of variation; CD: Critical difference; SEm±: Standard error of mean;
MSS: Mean sum of square: PY: Pod yield (kg/ha); NPPP: Number of pods per plant; PWPP: Pod weight per plant (g); SP: Shelling percentage (%); TW: Test
weight (g); SMKW: Sound mature kernel weight (%);O/L: Oleic to linoleic acid ratio; KY: Kernel yield (kg/ha); OY: Oil yield (kg/ha); LLS_70: Late leaf spot
score at 70 days after sowing (DAS); LLS_80: Late leaf spot score at 80 DAS; LLS_90: Late leaf spot score at 90 DAS; RUST_70: Rust score at 70 DAS;
RUST_80: Rust score at 80 DAS; RUST_90: Rust score at 90 DAS
Table.3 Phenotypic correlation coefficients for productivity, nutritional and disease reaction traits in the RILs of VL1 × 110
population
Traits
PY
NPPP
PWPP
SP
TW
SMKW
PROTEIN
OIL
OLR
KY
OY
LLS_70
LLS_80
PY
1
0.146
0.204*
0.728**
0.250**
0.236*
-0.018
0.069
0.084
0.967**
0.954**
0.005
-0.044
NPPP
PWPP
SP
TW
SMKW
PROTEIN
OIL
O/L
KY
1
0.082
0.077
0.194*
-0.069
-0.036
-0.022
0.002
0.113
0.113
0.134
0.096
1
0.159
0.132
-0.007
-0.038
0.086
0.107
0.201*
0.211*
-0.032
-0.101
1
0.250**
0.338**
-0.105
-0.038
0.112
0.848**
0.819**
-0.034
-0.013
1
-0.034
0.019
-0.031
0.048
0.282**
0.261**
-0.002
0.003
1
-0.027
0.007
0.118
0.281**
0.272**
0.001
-0.048
1
-0.078
-0.207*
-0.055
-0.068
-0.067
-0.043
1
-0.017
0.054
0.229*
0.111
0.002
1
0.091
0.081
0.137
-0.017
1
0.983**
0.005
-0.025
LLS_90
RUST_70
RUST_80
RUST_90
0.138
0.032
0.095
0.134
0.183*
0.172
0.214*
0.216*
-0.092
0.038
0.126
0.016
0.182*
-0.004
0.001
0.066
0.089
-0.024
0.270**
0.163
0.098
-0.041
0.004
0.081
-0.133
-0.052
-0.015
-0.022
0.028
0.118
-0.064
-0.015
0.065
0.203*
0.176
0.082
0.178
0.015
0.063
0.108
OY
1
0.028
0.029
0.176
0.041
0.044
0.111
LLS_70
LLS_80
1
0.568**
1
0.451**
0.069
-0.068
-0.096
0.766**
0.113
-0.066
-0.166
LLS_90
RUST_70
RUST_80
RUST_90
1
0.131
0.082
-0.051
1
0.458**
0.268**
1
0.630**
1
PY: Pod yield (kg/ha); NPPP: Number of pods per plant; PWPP: Pod weight per plant (g); SP: Shelling percentage (%); TW: Test weight (g); SMKW: Sound
mature kernel weight (%); O/L: Oleic to linoleic acid ratio; KY: Kernel yield (kg/ha); OY: Oil yield (kg/ha); LLS_70: Late leaf spot score at 70 days after sowing
(DAS); LLS_80: Late leaf spot score at 80 DAS; LLS_90: Late leaf spot score at 90 DAS; RUST_70: Rust score at 70 DAS; RUST_80: Rust score at 80 DAS;
RUST_90: Rust score at 90 DAS
2961
Int.J.Curr.Microbiol.App.Sci (2019) 8(1): 2956-2965
Table.4 Mean, range and genetic variability components for productivity, nutritional and disease
resistance traits among the RILs of VL1 × 110
Traits
PY
NPPP
PWPP
SP
TW
SMKW
PROTEIN
OIL
O/L
KY
OY
LLS_70
LLS_80
LLS_90
RUST_70
RUST_80
RUST_90
Mean
2944.44
18.50
24.50
50.83
52.38
91.75
27.76
46.22
2.21
1875.03
902.80
3.50
5.00
6.00
2.50
3.75
4.75
Minimum
1322.22
9.83
4.37
23.50
30.95
86.00
19.11
38.98
0.82
357.39
165.45
2.00
2.50
3.50
2.00
2.00
3.00
Maximum
4566.67
27.17
44.62
78.15
73.80
97.50
36.42
53.46
3.60
3392.67
1640.15
5.00
7.50
8.50
3.00
5.50
6.50
GCV (%)
14.51
22.03
46.59
6.74
15.47
1.51
10.48
4.87
28.06
16.92
18.19
12.50
13.01
10.29
9.86
18.63
19.81
PCV (%)
23.05
23.37
47.03
11.34
18.59
3.01
11.00
5.21
33.88
26.38
27.36
22.42
22.47
19.86
20.69
26.09
23.97
h2bs
39.63
88.81
98.13
35.34
69.28
25.28
90.74
87.23
68.57
41.12
44.17
31.08
33.54
26.84
22.73
50.98
68.28
GAM
18.82
42.76
95.08
8.25
26.53
7.57
20.56
9.37
47.86
22.35
24.90
14.36
15.53
10.98
9.69
27.40
33.72
Vg: Genotypic variance; Vp: Phenotypic variance; GCV: Genotypic coefficient of variation (%); PCV: Phenotypic
coefficient of variation (%); h2bs: Heritability in broad sense (%); GAM: Genetic advance as percent of mean; PY:
Pod yield (kg/ha); NPPP: Number of pods per plant; PWPP: Pod weight per plant (g); SP: Shelling percentage (%);
TW: Test weight (g); SMKW: Sound mature kernel weight (%); O/L: Oleic to linoleic acid ratio; KY: Kernel yield
(kg/ha); OY: Oil yield (kg/ha); LLS_70: Late leaf spot score at 70 days after sowing (DAS); LLS_80: Late leaf spot
score at 80 DAS; LLS_90: Late leaf spot score at 90 DAS; RUST_70: Rust score at 70 DAS; RUST_80: Rust score
at 80 DAS; RUST_90: Rust score at 90 DAS
Table.5 Total number of SNPs between VL 1 and 110
Sl. No.
1
2
3
4
5
6
7
8
9
10
Total
A chromosome
Aradu.A01
Aradu.A02
Aradu.A03
Aradu.A04
Aradu.A05
Aradu.A06
Aradu.A07
Aradu.A08
Aradu.A09
Aradu.A10
No. of SNPs
2,54,108
8,083
6,659
4,032
7,315
6,554
4,289
2,180
8,289
6,536
3,08,045
Aradu: Arachis duranensis; Araip: Arachis ipaensis
2962
B chromosome
Araip.B01
Araip.B02
Araip.B03
Araip.B04
Araip.B05
Araip.B06
Araip.B07
Araip.B08
Araip.B09
Araip.B10
No. of SNPs
13,661
11,064
9,065
9,263
15,964
14,351
14,065
8,837
1,514
15,046
1,12,830
Int.J.Curr.Microbiol.App.Sci (2019) 8(1): 2956-2965
Apart from the presence of significant
variability among the RILs, genetic
relatedness/similarity between the parents
would also contribute for efficient detection
of QTL by avoiding background noise (Chen
et al., 2008). With this objective, VL 1 and
110 were compared using the WGRS data for
SNP and CNV.
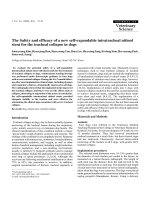
The WGRS reads of VL 1 and 110 were
compared with those of the two groundnut
progenitors i.e., A. duranensis (A genome)
and A. ipaensis (B genome). A total of
4,20,875 SNPs (3,08,045 from A sub-genome
and 1,12,830 from B sub-genome) were
detected (Table 5; Fig. 3). The number of
SNPs ranged from 2,180 (A08 chromosome)
to 2,54,108 (A01 chromosome). In B subgenome SNPs ranged from 1,514 (B09
chromosome) to 15,964 (B05 chromosome).
CNVs are genomic rearrangements resulting
from gains or losses of DNA segments. This
type of polymorphism has recently been
shown to be a key contributor to intra-species
genetic variation, along with single-nucleotide
polymorphisms and short insertion-deletion
polymorphisms. In many of the cases, CNVs
of specific genes have been linked to
important traits such as flowering time, plant
height and resistance to biotic and abiotic
stress. Hence, an effort was made to check the
copy number variations (CNVs) between VL
1 and 110 mutant genotypes. A total of 600
genomic regions showed significant CNVs
across 18 chromosomes (Fig 2). A and B
chromosome consists of 163 and 437
significant CNVs.
VL 1 and 110 also showed polymorphism of
2.7 to 66.1 % with AhTE markers (Hake et
al., 2017). The genetic differences between
VL 1 and 110 in terms of SNPs and CNVs
could be useful in mapping the traits which
showed considerable variability among the
RILs. The QTL and the markers identified
from the marker-trait association studies will
be useful for molecular breeding in
groundnut.
Acknowledgement
Funds received from BRNS project (no.
2013/35/12/BRNS), and the DST-JSPS
Bilateral Program is gratefully acknowledged.
References
Alper, C. and Mattes, R. 2002. Effects of
chronic peanut consumption on energy
balance and hedonics. Int. J. Obes.
Relat. Metab. Disord. 26 (8): 1129–
1137.
Awad, A., Downie, A., Fink, C., and Kim, U.
2000. Dietary phytosterol inhibits the
growth and metastasis of MDA-MB231 human breast cancer cells grown in
SCID mice. Anticancer Res. 20 (2A):
821–824.
Chen, Y., Chao, Q., Tan, G., Zhao, J., Zhang,
M., and Ji, Q. 2008. Identification and
fine-mapping of a major QTL
conferring resistance against head smut
in maize. Theor Appl Genet. 117 (8):
1241.
FAO. 2017. Food and agriculture organization
of the United Nations. FAOSTAT
database.
/>ubset=Agriculture.
Gowda, M. V. C., Bhat, R. S., Motagi, B. N.,
Sujay, V., Varshakumari and Bhat, R. S.
2010. Association of high-frequency
origin of late leaf spot resistant mutants
with AhMITE1 transposition in peanut.
Plant Breed. 129 (5): 567-569.
Gowda, M., Nadaf, H. L., and Giriraj, K.
1989. A new growth habit variant of
taxonomical importance in groundnut
(Arachis hypogaea L.). Intl. Arachis
Newslet. 6 (6): 48-54.
2963
Int.J.Curr.Microbiol.App.Sci (2019) 8(1): 2956-2965
Hake A. A., Shirasawa, K., Yadawad, A.,
Sukruth, M., Patil, M., Nayak, S. N.,
Lingaraju, S., Patil, P.V., Nadaf, H. L.,
Gowda, M.V.C., and Bhat, R. S. 2017.
Mapping of important taxonomic and
productivity traits using genic and nongenic transposable element markers in
peanut (Arachis hypogaea L.). PLoS
One. 12: e0186113.
IBPGR\ICRISAT. 1992. Descriptors for
groundnut. IBPGR, Roam, Italy and
ICRISAT, Patancheru, Andhra Pradesh,
India, pp. 125.
Khedikar, Y., Gowda, M. V. C.,
Sarvamangala,
C.,
Patgar,
K.,
Upadhyaya, H., and Varshney, R. 2010.
A QTL study on late leaf spot and rust
revealed one major QTL for molecular
breeding for rust resistance in
groundnut (Arachis hypogaea L.).
Theor Appl Genet. 121: 971–984.
Kolekar, R. M., Sujay, V., Shirasawa, K.,
Sukruth, M., Khedikar, Y. P., Gowda,
M. V. C., and Bhat, R. S. 2016. QTL
mapping for late leaf spot and rust
resistance using an improved genetic
map and extensive phenotypic data on a
recombinant inbred line population in
peanut
(Arachis
hypogaea
L.).
Euphytica. 209: 147–156.
Kolekar, R. M., Sukruth, M., Shirasawa, K.,
Nadaf, H. L., Motagi, B. N., Lingaraju,
S., Patil, P. V., and Bhat, R. S. 2017.
Marker-assisted
backcrossing
to
develop
foliar
disease
resistant
genotypes in TMV 2 variety of peanut
(Arachis hypogaea L.). Plant Breed.
136: 948–953.
Lomax, R. G., and Hahs-Vaughn, D. L. 2013.
An Introduction to Statistical Concepts3rd edition. Routledge, Taylor and
Francis group, New York, United States
of America.
Pandey, M. K., Gautami, B., Jayakumar, T.,
Sriswathi, M., Upadhyaya, H. D.,
Gowda, M. V. C., Radhakrishnan, T.,
Bertioli, D. J., Knapp, S. J., Cook, D.
R., and Varshney, R. K. 2012. Highly
informative genic and genomic SSR
markers to facilitate molecular breeding
in cultivated groundnut (Arachis
hypogaea L.). Plant Breed. 131: 139–
147.
Pandey, M. K., Khan Amir, W., Singh, V. K.,
Vishwakarma, M. K., Yaduru, S.,
Kumar, V., and Varshney, R. K. 2016.
QTL-seq approach identified genomic
regions and diagnostic markers for rust
and late leaf spot resistance in
groundnut (Arachis hypogaea L.). Plant
Biotechnology J. 15, 927–941.
Pandey, M. K., Wang, H., Khera, P.,
Vishwakarma, M. K., Kale, S. M.,
Culbreath, A. K., Holbrook, C. C.,
Wang, X., Varshney, R. K., and Guo, B.
2017. Genetic dissection of novel QTLs
for resistance to leaf spots and tomato
spotted wilt virus in peanut (Arachis
hypogaea L.). Front Plant Sci 8: 25
Pasupuleti, J., Pandey, M. K., Manohar, S. S.,
Variath, M. T., Nallathambi, P., Nadaf,
H. L., and Varshney, R. K. 2016. Foliar
fungal disease resistant introgression
lines of groundnut (Arachis hypogaea
L.) record higher pod and haulm yield
in multilocation testing. Plant Breed.
135: 355–366.
Shirasawa, K., Hirakawa, H., Nunome, T.,
Tabata, S., and Isobe, S. 2016. Genomewide survey of artificial mutations
induced by ethyl methanesulfonate and
gamma rays in tomato. Plant Biotechnol
J. 14 (1): 51–60.
Subbarao, P.V., Subramanyam, P., and
Reddy. P. M. 1990. A modified nine
points diseases scale for assessment of
rust and late leaf spot of groundnut.
Paper
presented
In:
Second
International Congress of French
Phytopathological Society, Montpellier,
France. pp. 25.
2964
Int.J.Curr.Microbiol.App.Sci (2019) 8(1): 2956-2965
Sujay, V., Gowda, M. V. C., Pandey, M. K.,
Bhat, R. S., Khedikar, Y. P., Nadaf, H.
L., and Varshney, R. K. 2012. QTL
analysis and construction of consensus
genetic map for foliar disease resistance
based on two RIL populations in
cultivated groundnut (Arachis hypogaea
L.). Mol Breed. 30, 773–788.
Sukruth, M., Paratwagh, S. A., Sujay, V.,
Kumari, V., Gowda, M. V. C., Nadaf,
H. L., and Bhat, R. S. 2015. Validation
of markers linked to late leaf spot and
rust resistance, and selection of superior
genotypes among diverse recombinant
inbred lines and backcross lines in
peanut
(Arachis
hypogaea
L.).
Euphytica. 204: 343–351.
Varshney, R. K., Pandey, M. K., Pasupuleti,
J., Nigam, S. N., Sudini, H., Gowda, M.
V. C., Sriswathi, M., Radhakrishan, T.,
Manohar, S. S., and Patne, N. 2014.
Marker-assisted introgression of a QTL
region to improve rust resistance in
three elite and popular varieties of
peanut (Arachis hypogaea L.). Theor
Appl Genet. 127 (8): 1771-1781.
Yeri,
S. B. and Bhat, R. S. 2016.
Development of late leaf spot and rust
resistant backcross lines in JL 24 variety
of groundnut (Arachis hypogaea L.).
Electronic Journal of Plant Breed. 7,
37–41.
Yeri, S. B., Shirasawa, K., Pandey, M. K.,
Gowda, M. V. C., Sujay, V., Shriswathi,
M., and Bhat, R. S. 2014. Development
of NILs from heterogeneous inbred
families for validating the rust
resistance QTLs in peanut (Arachis
hypogaea L.). Plant Breed. 133: 80–85.
Zhang, H., Hui, G., Luo, Q., Sun, Y., and Liu,
X. 2014. Descriptive statistics and
correlation analysis of agronomic traits
in a maize recombinant inbred line
population. Genet. Mol. Res. 13 (1):
457-461.
Zhou, X., Xia, Y., Liao, J., Liu, K., Li, Q.,
Dong, Y., Ren, X., Chen, Y., Huang, L.,
and Liao, B. 2016. Quantitative trait
locus analysis of late leaf spot resistance
and
plant-type-related
traits
in
cultivated peanut (Arachis hypogaea L.)
under multi-environments. PLoS ONE.
11: e0166873.
How to cite this article:
Sukruth, M., K. Shirasawa and Bhat, R.S. 2019. Evaluation of a New Recombinant Inbred Line
Mapping Population for Genetic Mapping in Groundnut (Arachis hypogaea L.).
Int.J.Curr.Microbiol.App.Sci. 7(08): 2956-2965. doi: />
2965