Studies on character association and path coefficient analysis for anaerobic germination traits, yield and its contributing characters in rice (Oryza sativa L.)
Bạn đang xem bản rút gọn của tài liệu. Xem và tải ngay bản đầy đủ của tài liệu tại đây (259.42 KB, 8 trang )
Int.J.Curr.Microbiol.App.Sci (2019) 8(4): 355-362
International Journal of Current Microbiology and Applied Sciences
ISSN: 2319-7706 Volume 8 Number 04 (2019)
Journal homepage:
Original Research Article
/>
Studies on Character Association and Path Coefficient Analysis for
Anaerobic Germination Traits, Yield and its Contributing Characters in
Rice (Oryza sativa L.)
E. Umarani1*, V. Hemalatha1, L.V. Subbarao2, C.N. Neeraja2,
Suneetha Kota2 and S. Narender Reddy1
1
2
College of Agriculture, PJTSAU, Rajendranagar, Hyderabad-500030, India
Crop Improvement Section, ICAR-Indian Institute of Rice Research, Rajendranagar,
Hyderabad-500030, India
*Corresponding author
ABSTRACT
Keywords
Rice, correlations,
Direct and indirect
effects, Anaerobic
germination, Yield
Article Info
Accepted:
04 March 2019
Available Online:
10 April 2019
In the present investigation cause of association and direct and indirect effects were
estimated between anaerobic germination traits, yield and its contributing traits in twenty
five hybrids, along with their ten parents and three checks of rice (Oryza sativa L.). Single
plant yield registered positive significant association with number of tillers per hill,
number of productive tillers per hill, panicle length, spikelet fertility, number of grains per
panicle and 1000-grain weight indicating that these characters were important for yield
improvement. Path coefficient analysis revealed that number of number of grains per
panicle exserted the highest positive direct effect on grain yield followed by plant height,
panicle length, spikelet fertility, anaerobic germination percentage, number of productive
tillers per hill, seedling length and number of tillers per hill indicating that the selection for
these characters was likely to bring about an overall improvement in single plant yield
directly.
becoming less profitable as these resources
are becoming increasingly scarce. It also
deteriorates the physical properties of soil,
adversely affects the performance of
succeeding upland crops and contributes to
methane emissions. These factors demand a
major shift from puddled transplanting to
direct seeding of rice (DSR) in irrigated rice
ecosystems. However, large scale adoption of
DSR practices has been held back by poor
crop establishment or a total loss of the crop
Introduction
Rice is the only crop in the world that is
grown in most fragile ecosystem and hence
second green revolution is possible only if
rice research is undertaken vigorously and
persistently to address specific abiotic and
biotic stress problems. Rice is commonly
grown by transplanting seedlings into puddled
soils in Asia. This production system is
labour, water and energy intensive and is
355
Int.J.Curr.Microbiol.App.Sci (2019) 8(4): 355-362
stand due to improper levelled fields, heavy
rainfall and poor drainage, which lead to the
accumulation of water of varying depths
immediately after sowing or during the early
stages of seedling growth. The hazards of
flooding right after sowing or during
germination can discourage farmers from
adopting DSR technology or force them to
abandon this practice.
was carried out with the objective of
determining the interrelationship between
anaerobic germination traits, yield and its
contributing characters as well as identifying
the characters to be considered for selecting
better genotypes suitable for the development
of high yielding varieties with tolerance to the
submergence during the germination.
Materials and Methods
Consequently, developing high yielding
varieties that can withstand flooding during
germination and early growth is essential for
sustainability of practicing direct seeding for
rice crop establishment. Availability of
suitable genetic donors will be a key to
introduce tolerance to anaerobic germination
into elite cultivars and popular genotypes.
The field experiment was conducted during
kharif, 2016 at ICAR-Indian Institute of Rice
Research
Farm,
ICRISAT
campus,
Patancheru, Hyderabad, India, situated at
17.530 N latitude, 78.270 E longitude and
altitude of 545 m above mean sea level.
Twenty five F1 hybrids of rice along with
their ten parents and three standard checks
were sown separately in raised bed nursery.
Thirty days old seedlings of each genotype
were transplanted in 5 rows of 3 m length by
adopting a spacing of 20 cm between rows
and 15 cm between plants within a row in
Randomized Block Design replicated thrice.
All the necessary precautions were taken to
maintain uniform plant population of each
genotype
per
replication.
All
the
recommended package of practices was
adopted
besides
providing
necessary
prophylactic plant protection measures to
raise a good crop.
Several studies revealed that rice has
enormous exploitable variation in tolerance of
flooding during germination. This high
magnitude of variability provides an
opportunity for selection to evolve a variety
having desirable characters. Information on
character association, direct and indirect
effects contributed by each character towards
yield will be an added advantage in aiding the
selection process.
Yield is the end product of multiplicative
interaction between various yield components
and this necessitates a thorough understanding
of character association and direct and
indirect effects contributed by each character
on grain yield before launching any breeding
programme. Correlation and path analysis
establish the extent of association between
yield and its components and also bring out
relative importance of their direct and indirect
effects, thus giving an obvious understanding
of their association with grain yield.
Ultimately, this kind of analysis could help
the breeder to design the selection strategies
for improving grain yield. Hence, in the light
of above scenario, the present investigation
Data were recorded on a total of twelve
metric characters. Among them seven
characters viz., plant height, total number of
tillers per hill, number of productive tillers
per hill, panicle length, total number of grains
per panicle, spikelet fertility and single plant
yield were recorded on five randomly selected
plants in each plot. Days to 50 % flowering
was recorded on plot basis. 1000-grain weight
was recorded per replication in each
genotype. While three anaerobic germination
traits were viz., anaerobic germination
percentage (%), seedling length (cm) and
356
Int.J.Curr.Microbiol.App.Sci (2019) 8(4): 355-362
seedling vigour index I recorded as per the
standard procedure given by ICAR-IIRR..
The data collected on all the characters were
subjected to standard methods of analysis of
variance (Panse and Sukhatme, 1985). The
genotypic and phenotypic correlation
coefficients were calculated using the method
given by Falconer (1981) and path coefficient
analysis were worked as suggested by Wright
(1921) and Dewey and Lu (1959).
increased single plant yield. Panicle length
(0.5292**/0.4850**)
expressed
positive
significant association with single plant yield
by accommodating more number of grains per
panicle. Similar reports were recorded earlier
by Umarani et al., (2014) and Devi et al.,
(2017).
Spikelet
fertility
(0.4485**/0.4008**), number of grains per
panicle (0.3696**/0.3402**) and 1000-grain
weight
(0.1832**/0.1841**)
exhibited
positive significant association with single
plant yield, which was quite expected, as
increased expression of these traits ultimately
had direct bearing on single plant yield.
Results and Discussion
The analysis of variance revealed the
existence of significant differences among the
genotypes for all the traits, indicating the
existence of sufficient variation in the
material studied.
These results are in agreement with the
findings of Hasan et al., (2013) and Tiwari
(2017) for spikelet fertility, Umarani et al.,
(2014) and Patel et al., (2017) for number of
grains per panicle and Tiwari (2017) for
1000-grain weight indicating that these
characters were important for yield
improvement.
Hence, the data were further subjected to
correlation (Table 1) and path coefficient
analyses (Table 2) to estimate the association
existing between anaerobic germination traits,
yield and its contributing characters and the
direct and indirect effects of these traits on
yield, respectively.
Positive but non-significant association of
single plant yield was observed with plant
height (0.1458/0.1411), days to 50 %
flowering (0.0858/0.0881) and anaerobic
germination percentage (0.0545/0.0519).
Patel et al., (2017) reported similar results for
plant height and days to 50 % flowering.
Negative but non-significant correlation was
reported with seedling length (-0.0882/0.0840) and seedling vigour index I (-0.0354/0.0337).
High genotypic correlations, in general, as
compared to their phenotypic counterparts
indicated the existence of strong inherent
association between the characters which
might be due to the masking or modifying
effect of the environment on the genetic
association between the characters.
Single plant yield registered positive
significant association with number of tiller
per hill (0.5661**/0.5376**) and number of
productive
tillers
per
hill
(0.5478**/0.5207**)
which
were
in
agreement with the findings of Patel et al.,
(2017) for number of tillers per hill and Devi
et al., (2017) for number of productive tillers
per hill. From the results, it was evident that
increased number of tillers and productive
tillers per plant which inturn helped to
increase number of panicles, leading to
According to NeWall and Eberhart (1961)
when two characters show negative
phenotypic and genotypic correlation it would
be difficult to exercise simultaneous selection
for these characters in the development of a
variety. Hence, under such situations,
judicious selection programme might be
formulated for simultaneous improvement of
such important developmental and component
characters.
357
Int.J.Curr.Microbiol.App.Sci (2019) 8(4): 355-362
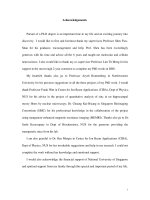
Table.1 Estimates of genotypic and phenotypic correlation coefficients for anaerobic germination traits, yield and its contributing
traits in rice
Trait
AGP
(%)
G
AGP
(%)
1.0000
P
1.0000
SL (cm)
G
1.0000
0.9373**
-0.0601
0.2837**
0.2704**
0.3946**
-0.2007*
-0.1167
-0.5555**
0.2504**
-0.0882
P
1.0000
0.9366 **
-0.0567
0.2801**
0.2575 **
0.3762 **
-0.1920*
-0.1081
-0.4742**
0.2408**
-0.0840
G
1.0000
0.0357
0.4620**
0.2080*
0.3392**
-0.0055
-0.2632**
-0.4161**
0.3124**
-0.0354
P
1.0000
0.0346
0.4572**
0.1987*
0.3266**
-0.0116
-0.2458**
-0.3595**
0.2990**
-0.0337
G
1.0000
0.4775**
-0.0307
0.0626
0.2484**
-0.0759
-0.1361
-0.5418**
0.0858
P
1.0000
0.4655**
-0.0222
0.0640
0.2388*
-0.0826
-0.1182
-0.5099**
0.0881
G
1.0000
-0.1573
-0.0651
0.5486**
-0.5725**
-0.1198
-0.0418
0.1458
P
1.0000
-0.1555
-0.0640
0.5155**
-0.5375**
-0.1118
-0.0361
0.1411
G
1.0000
0.8914**
0.0361
0.2565**
0.0293
0.1740
0.5661**
P
1.0000
0.8784**
0.0169
0.2131*
0.0402
0.1762
0.5376**
G
1.0000
-0.0094
0.2109*
0.0157
0.2267*
0.5478**
P
1.0000
-0.0172
0.1839
0.0210
0.2244*
0.5207**
G
1.0000
-0.1737
0.2145
-0.0638
0.5292**
P
1.0000
-0.1422
0.1613
-0.0700
0.4850**
G
1.0000
0.0860
-0.0766
0.3696**
P
1.0000
0.0045
-0.0771
0.3402**
SVI I
DFF
PH (cm)
NTPH
NPTPH
PL (cm)
NGPP
SL (cm)
DFF
P H (cm)
0.8517**
0.2589**
0.6349**
0.0811
0.2477**
0.1698
-0.4320**
0.6796**
0.8485**
0.2519**
0.6324**
0.0799
0.2423**
0.1569
0.6839**
SVI I
NTPH
NPTPH
PL (cm)
NGPP
SF (%)
-0.1624
1000GW (g)
0.3014**
SPY (g)
0.0545
-0.4094**
-0.1410
0.2841**
0.0519
SF (%)
G
1.0000
0.4228**
0.4485**
P
1.0000
0.3364**
0.4008**
1000GW (g)
G
1.0000
0.1832*
P
1.0000
0.1841**
*Significant at 5 per cent level; **Significant at 1 per cent level
G - Genotypic level; P - Phenotypic level
*AGP (%) – Anaerobic germination percentage (%); SL (cm) – Seedling length (cm); SVI I – Seedling vigour index I; DFF – Days to 50 % flowering; PH (cm) – Plant height;
NTPP - Number of tillers per plant; NPTP - Number of productive tillers per plant; PL (cm) - Panicle length (cm); NGPP - Number of grains per panicle; SF (%) - Spikelet
fertility (%); 1000-GW (g) - 1000-grain weight (g); SPY (g) – Single plant yield (g)
358
Int.J.Curr.Microbiol.App.Sci (2019) 8(4): 355-362
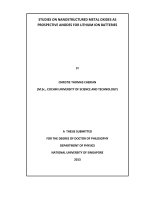
Table.2 Estimates of direct and indirect effects of anaerobic germination traits, yield contributing traits on single plant yield in rice
Trait
AGP (%)
SL (cm)
SVI I
DFF
P H (cm)
NTPH
NPTPH
PL (cm)
NGPP
SF (%)
G
0.2960
0.2025
0.2521
0.0767
0.1880
0.0240
0.0733
0.0503
-0.1279
P
0.1955
0.1329
0.1659
0.0492
0.1236
0.0156
0.0474
0.0307
G
0.1945
0.2844
0.2665
-0.0171
0.0807
0.0769
0.1122
P
0.1448
0.2131
0.1996
-0.0121
0.0597
0.0549
0.0802
G
-0.5404
-0.5947
-0.6345
-0.0226
-0.2932
-0.1319
P
-0.4433
-0.4894
-0.5225
-0.0181
-0.2389
G
-0.0624
0.0145
-0.0086
-0.2410
P
-0.0336
0.0076
-0.0046
PH (cm)
G
0.3202
0.1431
0.2330
P
0.2908
0.1288
0.2102
NTPH
G
0.0213
0.0709
0.0545
P
0.0245
0.0791
0.0610
G
0.0733
0.1168
P
0.0566
G
AGP (%)
SL (cm)
SVI I
DFF
NPTPH
PL (cm)
NGPP
SF (%)
1000-GW (g)
SPY (g)
-0.0481
1000GW (g)
0.0892
-0.0800
-0.0276
0.0555
0.0519
-0.0571
-0.0332
-0.1580
0.0712
-0.0882
-0.0409
-0.0230
-0.1011
0.0513
-0.0840
-0.2152
0.0035
0.1670
0.2640
-0.1982
-0.0354
-0.1038
-0.1707
0.0061
0.1285
0.1879
-0.1562
-0.0337
-0.1151
0.0074
-0.0151
-0.0599
0.0183
0.0328
0.1306
0.0858
-0.1333
-0.0620
0.0030
-0.0085
-0.0318
0.0110
0.0158
0.0680
0.0881
0.2408
0.5043
-0.0793
-0.0328
0.2766
-0.2887
-0.0604
-0.0211
0.1458
0.2140
0.4598
-0.0715
-0.0294
0.2370
-0.2472
-0.0514
-0.0166
0.1411
-0.0081
-0.0412
0.2620
0.2336
0.0095
0.0672
0.0077
0.0456
0.5661**
-0.0068
-0.0478
0.3072
0.2698
0.0052
0.0655
0.0124
0.0541
0.5376**
0.1004
0.0185
-0.0193
0.2638
0.2959
-0.0028
0.0624
0.0047
0.0671
0.5478**
0.0878
0.0763
0.0149
-0.0149
0.2051
0.2335
-0.0040
0.0429
0.0049
0.0524
0.5207**
0.0554
-0.0655
-0.0018
0.0811
0.1791
0.0118
-0.0031
0.3266
-0.0567
0.0701
-0.0208
0.5292**
P
0.0481
-0.0589
-0.0036
0.0733
0.1581
0.0052
-0.0053
0.3068
-0.0436
0.0495
-0.0215
0.4850**
G
-0.2279
-0.0616
-0.1389
-0.0400
-0.3021
0.1353
0.1113
-0.0916
0.5276
0.0454
-0.0404
0.3696**
P
-0.1996
-0.0527
-0.1199
-0.0403
-0.2621
0.1039
0.0896
-0.0694
0.4876
0.0022
-0.0376
0.3402**
G
-0.0524
-0.1792
-0.1343
-0.0439
-0.0387
0.0094
0.0051
0.0692
0.0277
0.3226
0.1364
0.4485**
P
-0.0418
-0.1406
-0.1066
-0.0351
-0.0332
0.0119
0.0062
0.0478
0.0013
0.2966
0.0998
0.4008**
G
-0.0230
-0.0191
-0.0239
0.0414
0.0032
-0.0133
-0.0173
0.0049
0.0058
-0.0323
-0.0764
0.1832*
P
0.0099
0.0084
0.0104
-0.0178
-0.0013
0.0062
0.0078
-0.0024
-0.0027
0.0117
0.0349
0.1841**
0.0545
G - Genotypic level; P - Phenotypic level
Genotypic residual effect = 0.35; Phenotypic residual effect= 0.46
Bold values - direct effects; Normal values - indirect effects
** Significant at 1 per cent level; *Significant at 5 per cent level
*AGP (%) – Anaerobic germination percentage (%); SL (cm) – Seedling length (cm); SVI I – Seedling vigour index I; DFF – Days to 50 % flowering; PH (cm) – Plant height; NTPP Number of tillers per plant; NPTP - Number of productive tillers per plant; PL (cm) - Panicle length (cm); NGPP - Number of grains per panicle; SF (%) - Spikelet fertility (%);
1000-GW (g) - 1000-grain weight (g); SPY (g) – Single plant yield (g)
359
Int.J.Curr.Microbiol.App.Sci (2019) 8(4): 355-362
Grain yield, which is the major economic
character in rice depends on several
component traits, which are mutually related.
Mere change in any one of the component
trait would ultimately disturb the complex.
Hence, these related traits have to be analyzed
for their direct effects as well as the indirect
effects through other component characters on
grain yield. Therefore, the total correlations
were partitioned into direct and indirect
effects.
respectively. While, 1000-grain weight
recorded both negative (-0.0764) and positive
direct (0.0349) effects on grain yield at
phenotypic and genotypic levels, respectively.
These results were in confirmity with the
findings of Rao et al., (2014) and Devi et al.,
(2017) days to 50 % flowering.
In conclusion, critical analysis of results
obtained from character association and path
analysis indicated that the traits viz., number
of number of grains per panicle, panicle
length, spikelet fertility, number of productive
tillers per hill and number of tillers per hill
displayed significant positive correlation as
well as positive direct effect on single plant
yield. The positive direct effects of these traits
on yield might have resulted in strong genetic
correlations.
Plant
height,
anaerobic
germination percentage and seedling length
exserted the positive direct effect on grain
yield, but it had positive-non significant
association with yield which might be due to
the negative indirect effects manifested
through other component traits. Hence, due
emphasis should be given to these traits in
formulating selection criteria to bring yield as
well as tolerance to the submergence during
germination.
Path coefficient analysis revealed that number
of grains per panicle (0.5276/0.4876) exserted
the highest positive direct effect on grain
yield
followed
by
plant
height
(0.5043/0.4598),
panicle
length
(0.3266/0.3068),
spikelet
fertility
(0.3226/0.2966),
anaerobic
germination
percentage (0.2960/0.1955), number of
productive tillers per hill (0.2959/0.2335),
seedling length (0.2844/0.2131) and number
of tillers per hill (0.2620/0.3072) indicating
that the selection for these characters was
likely to bring about an overall improvement
in single plant yield directly. Therefore, it is
suggested that preference should be given to
these characters in the selection programme to
isolate superior lines with genetic potentiality
for high yield in rice genotypes.
Acknowledgements
These results are in agreement with the
findings of Nagaraju et al., (2013) and
Umarani et al., (2014) for total number of
grains per panicle, Kishore et al., (2015) and
Lakshmi et al., (2017) for plant height,
Lingaiah et al., (2014) and Moosavi et al.,
(2015) for panicle length, Hasan et al., (2013)
and Umarani et al., (2014) for spikelet
fertility and Gangashetty et al., (2013) and
Kalyan et al., (2017) for number of
productive tillers per hill and number of tillers
per hill. Negative direct effects on grain yield
were exhibited by seedling vigour index I (0.6345/0.5225) and days to 50 % flowering (0.2410/-0.333)
in
decreasing
order,
I humbly thank the Chairman and members of
my advisory committee for their technical
guidance and support and authorities of
“PJTSAU, Rajendranagar, Hyderabad” and
“DST-INSPIRE Programme”, Government of
India for the financial help rendered in the
form of fellowship during during my study
period.
References
Devi, K.R., Satish, B., Chandra, N., Lingaiah,
Y., Hari and Venkanna, V. 2017.
Analysis of variability, correlation and
360
Int.J.Curr.Microbiol.App.Sci (2019) 8(4): 355-362
path coefficient studies for yield and
quality traits in rice (Oryza sativa L.).
Agricultural Science Digest. 37 (1): 1-9.
Dewey, O.R. and Lu, K.H. 1959. Correlation
and path coefficient analysis of
components of crested wheat grass seed
production. Journal of Agronomy. 51:
515-518.
Falconer, D.S. 1981. Introduction to
Quantitative Genetics. Oliver and Boyd,
London. 340.
Gangashetty, P.I., Salimath, P.M and
Hanamaratti, N.G. 2013. Genetic
variability studies in genetically diverse
non-basmati local aromatic genotypes
of rice (Oryza sativa L.). Rice Genomics
and Genetics. 4 (2): 4-8.
Hasan, M.U., Kulsum, M.J., Akter, A.,
Masuduzzaman, A.S.M and Ramesha,
M.S. 2013. Genetic variability and
character association for agronomic
traits in hybrid rice (Oryza sativa L.).
Bangladesh Journal of Plant Breeding
and Genetics. 24 (1): 45-51.
Kalyan, B., Krishna, K.V.R and Rao, L.V.S.
2017. Path coefficient analysis for yield
and yield contributing traits in rice
(Oryza
sativa
L.)
genotypes.
International Journal of Current
Microbiology and Applied Sciences. 6
(7): 2680-2687.
Kishore, N.S., Srinivas, T., Nagabhushanam,
U., Pallavi, M and Sameera, S.K. 2015.
Genetic variability, correlation and path
analysis for yield and yield components
in promising rice (Oryza sativa L.)
genotypes.
SAARC
Journal
of
Agriculture. 13 (1): 99-108.
Lakshmi, Rao, M.V.B., Raju, Ch.S and
Reddy,
S.N.
2017.
Variability,
correlation and path analysis in
advanced generation of aromatic rice
(Oryza sativa L.). International Journal
of Current Microbiology and Applied
Sciences. 6 (7): 1798-1806.
Lingaiah, N., Venkanna, V., Cheralu, C and
Chandra, B.S. 2014. Correlation and
path analysis for yield and yield
attributes in mid early group genotypes
of rice (Oryza sativa L.). International
Journal
of
Innovative
Science,
Engineering & Technology. 1 (9): 7982.
Moosavi, M., Ranjbar, G., Zarrini, H.N and
Gilani, A. 2015. Correlation between
morphological and physiological traits
and path analysis of grain yield in rice
genotypes under Khuzestan conditions.
An International Journal. 7 (1): 43- 47.
Nagaraju, C., Sekhar, M.R., Reddy, K.H and
Sudhakar, P. 2013. Correlation between
traits and path coefficient analysis for
grain yield and other components in rice
(Oryza
sativa
L.)
genotypes.
International Journal of Biology and
Pharmaceutical Technology. 4 (3): 137142.
NeWall, L.C and Eberhart, S.A. 1961. Clone
and progeny evaluation in the
improvement of switch grass (Panicum
virgatum L.). Crop Science. 1: 117-121.
Panse, V.G and Sukhatme, P.V. 1985.
Statistical Methods for Agricultural
Workers. ICAR, New Delhi. 235 - 246.
Patel, J.R., Dixita, K., Patel, K.N., Prajapati,
N.V., Soni and Patel, A. 2017.
Correlation and path coefficient analysis
in rainfed upland rice (Oryza sativa L.).
Environment and Ecology. 35 (2): 789794.
Rao, V.T., Mohan, Y.C., Bhadru, D.,
Bharathi, D and Venkanna, V. 2014.
Genetic variability and association
analysis in rice. International Journal of
Applied Biology and Pharmaceutical
Technology. 5(2): 63-65.
Tiwari, J.K. 2017. Association analysis and
selection strategies for various yield
contributing traits in rice genotypes.
Applied Biological Research. 19 (1):
35-40.
361
Int.J.Curr.Microbiol.App.Sci (2019) 8(4): 355-362
Umarani, E., Radhika, K., Subbarao, L.V. and
Padma,
V.
2014.
Studies
on
interrelationships, cause and effects for
yield, its contributing traits and grain
quality parameters in landraces of rice
(Oryza
sativa
L.).
Progressive
Research-an International Journal. 3:
609-613.
Wright, S. 1921. Correlation and causation.
Journal of Agricultural Research. 20:
557-585.
How to cite this article:
Umarani, E., V. Hemalatha, L.V. Subbarao, C.N. Neeraja, Suneetha Kota and Narender Reddy,
S. 2019. Studies on Character Association and Path Coefficient Analysis for Anaerobic
Germination Traits, Yield and its Contributing Characters in Rice (Oryza sativa L.).
Int.J.Curr.Microbiol.App.Sci. 8(04): 355-362. doi: />
362