Estimation of genetic variability and heritability in selected mulberry germplasm accessions (Morus spp.)
Bạn đang xem bản rút gọn của tài liệu. Xem và tải ngay bản đầy đủ của tài liệu tại đây (254.05 KB, 7 trang )
Int.J.Curr.Microbiol.App.Sci (2019) 8(2): 493-499
International Journal of Current Microbiology and Applied Sciences
ISSN: 2319-7706 Volume 8 Number 02 (2019)
Journal homepage:
Original Research Article
/>
Estimation of Genetic Variability and Heritability in Selected Mulberry
Germplasm Accessions (Morus spp.)
Suraksha Chanotra*, Ramesh Kumar Bali and Kamlesh Bali
Division of Sericulture, SKUAST-J, Chatha, India
*Corresponding author
ABSTRACT
Keywords
Mulberry, PCV,
GCV, Variability,
Heritability,
Characterization
Article Info
Accepted:
07 January 2019
Available Online:
10 February 2019
Genetic variability analysis and heritability of different yield contributing characters were
investigated in 44 mulberry genotypes for six morphological and eight physiological traits
to understand the available genetic variability for future improvement of mulberry.
Phenotypic coefficient of variation (PCV %) was found to be higher than the respective
genotypic coefficient of variation (GCV %) for all the characters denoting variability
among genotypes. Estimates of phenotypic and genotypic coefficient of variation were
high for fresh leaf weight (39.72, 35.06%) moderate for other traits (10-30%) and least in
moisture percentage (9.24, 6.81% respectively). High genetic advance coupled with
heritability was observed in the characters namely, fresh leaf weight (77.9 %), followed by
number of leaves per meter twig (68.6%), internodal distance (64.4%), leaf length
(61.4%), dry leaf weight, moisture percentage (54.3%) and actual leaf area (48.2%) and
least in leaf width (36.7%). High genetic advance coupled with high heritability revealed
significant contribution of fresh leaf weight among studied components. The study
revealed importance of agro-morphological traits in characterization of germplasm
accessions and in selection for future breeding programmes.
world, of which 35 species are found in Asia
and 14 in continental America. Sericulture
and silk production is directly correlated with
production of high quality mulberry leaves.
Hence, development of improved mulberry
varieties with high leaf productivity and
quality is essential for horizontal and vertical
growth of sericulture in the country.
Introduction
Mulberry is the primary host of silkworms
(Bombyx mori L.), which belongs to family
Moraceae and it is exploited on a commercial
scale for silk production. It is a perennial
plant belonging to the genus Morus of family
Moraceae, division Magnoliophyta, class
Magnoliopsida falling under order Urticales.
The origin of mulberry is Asia. The original
home of the genus is lower Himalayan belt of
Indo-China. Genus Morus has 68 recognized
species available in different parts of the
Breeding activities aiming towards increase in
productivity can benefit from a thorough
understanding of the genetic variability and
diversity within a set of germplasm
493
Int.J.Curr.Microbiol.App.Sci (2019) 8(2): 493-499
accessions. Genetic variability is the prerequisite for initiation of any crop
improvement programme including mulberry
and selection acts upon the variability which
is present in the genotypes. The precise
information on the nature and degree of
genetic diversity helps the plant breeder in
choosing the diverse parents for purposeful
hybridization. Genetic variation is also
fundamental for species conservation to meet
present and future requirement. The extent of
magnitude of genetic variability in the
mulberry germplasm helps in the crop
improvement through conventional breeding.
For making effective selection based on the
metric traits estimation of genetic variability
parameters heritability and genetic advance
indicates the extent of trait transmissibility
generation to generation. Hence, in the
present investigation foliage yield and some
important growth traits of indigenous and
exotic accessions of mulberry was carried out
to determine genetic variability among 44
mulberry genotypes conserved in the
germplasm bank of SKUAST-J.
weight in g (100 leaves), moisture percentage,
internodal distance and number of leaves per
meter twig were recorded from randomly
sampled replications. Leaf length and width
was measured with measuring scale and
actual leaf area was determined by graphical
analysis. For obtaining fresh leaf weight 100,
leaves were picked up randomly from
selected
replications
and
weighed
immediately on electronic balance and same
leaves were oven dried at 70oC till constant
weight was achieved and again weighed on
electronic balance to determine the oven dry
weight. For determining number of leaves per
meter twig, one meter length of each branch
was measured and total number of leaves
counted. Moisture content and internodal
distance was calculated in percentage by
using the formulas given below:
Materials and Methods
Internodal distance=
100 cm
Number of nodes
Moisture percentage=
Fresh leaf weight- Oven dry weight
X 100
Fresh leaf weight
Experimental site and material
Statistical analysis
genetic parameters
The present study was conducted at the
Mulberry Germplasm Bank, Udheywalla
campus, Sher-e-Kashmir University of
Agricultural Sciences and Technology of
Jammu. The experimental material comprised
of 44 mulberry genotypes (Table 1)
maintained at of 1 x 1meter spacing as bush
plantation.
and
estimation
of
The mean data of the above mentioned traits
were statistically analyzed using R software
version 3.5.1 2018 for estimation of mean
square treatment, environmental variance,
genotypic variance, phenotypic variance,
heritability percentage, phenotypic coefficient
of variation (PCV), genotypic coefficient of
variation (GCV) and genetic advance.
Experimental data
60 days mature leaves were picked up
randomly for three replications for recording
data. Eight quantitative traits viz., leaf length
(cm), leaf width (cm), actual leaf area (cm2),
fresh leaf weight in g (100 leaves), dry leaf
Results and Discussion
Results obtained for studied parameters are
presented in Table 2. The extent of variability
present among the yield and yield attributes is
494
Int.J.Curr.Microbiol.App.Sci (2019) 8(2): 493-499
presented in Table 3. A perusal of data
indicated that the characters were greatly
influenced by phenotypic variances and
reflected impact on genotypic variances also.
The analysis of genetic parameters for various
quantitative traits revealed significant mean
square estimates for all the characters
indicating sufficient diversity among the
genotypes. Mean square treatment revealed
maximum value for fresh leaf weight (24071)
and minimum for leaf width (5.5). This
variation in genotypes is helpful in selection
of superior parental material for development
of promising genotypes.
35.0 %), actual leaf area (30.2, 20.9%),
internodal distance (29.5, 23.6 %), number of
leaves per meter twig (27.7, 22.9%), leaf
width (16.9, 10.2 %), leaf length (16.7,
13.1%) and dry leaf weight (15.8, 11.7%).
Lowest PCV and GCV values were recorded
in moisture percentage (9.2 and 6.8%)
respectively. High genetic advance was
recorded for fresh leaf weight (63.7) followed
by actual leaf area (30.0), leaf length (21.2),
dry leaf weight (17.8), leaf width (12.8),
moisture percentage (10.3), number of leaves
per meter twig (3.9) and internodal distance
(0.3).
Phenotypic variations were high as compared
to genotypic variation for all traits under
study. Genotypic variance was maximum in
fresh leaf weight (7329.7) followed by actual
leaf area (1781.8), dry leaf weight and
moisture percentage (29.8), number of leaves
per meter twig (12.1), leaf length (5.9) and
internodal distance (1.7), while leaf width
(1.1) showed least genotypic variance and
phenotypic variations was maximum in fresh
leaf weight (9411.1) followed by actual leaf
area (3697.7), dry leaf weight and moisture
percentage (54.9), number of leaves per meter
twig (17.7), leaf length (9.7) and leaf width
(3.2), while least phenotypic variance was
recorded in internodal distance (2.7).
These findings for genetic analysis of
genotypes suggested greater phenotypic and
genotypic variability among the accessions
and sensitiveness of the attributes for making
future improvement through selection. Wide
differences between GCV and PCV for actual
leaf area and leaf width implied its
susceptibility to agro-climatic fluctuations
and genetic constitution attributed for
internodal
distance,
whereas
narrow
difference between GCV and PCV for other
characters suggests their relative resistance to
environmental alterations. PCV was higher
than the respective GCV for all the characters
denoting environmental factors influencing
their expression to some degree or other. High
estimates of genetic gain coupled with high
values of GCV portrayed that these are
controlled by additive genes and phenotypic
selection for their improvement could be
achieved by simple selection.
All parameters studied recorded high
heritability estimates and showed high
genotypic
variance
also.
Maximum
heritability percentage was observed for fresh
leaf weight (77.9) whereas least heritability
percentage was recorded for leaf width
(36.7%) distance indicating their reliability
for effecting selection for high leaf yield
parameters. Results depicted significant
correlation of heritability percentage with that
of genetic variance. Phenotypic coefficient of
variation was more than genotypic coefficient
of variation for all studied parameters. The
phenotypic and genotypic coefficient of
variation was high for fresh leaf weight (39.7,
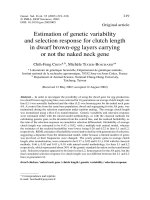
PCV was found to be higher than the
respective GCV for all the characters
denoting variability among genotypes.
Estimates of phenotypic and genotypic
coefficient of variation were high for fresh
leaf weight (39.72, 35.06%) moderate for
other traits (10-30%) and least in moisture
percentage (9.24, 6.81% respectively) (Fig.
1).
495
Int.J.Curr.Microbiol.App.Sci (2019) 8(2): 493-499
Table.1 Pedigree record of genotypes used for analysis
S.No.
1.
2.
3.
4.
5.
6.
7.
8.
9.
10.
11.
12.
13.
14.
15.
16.
17.
18.
19.
20.
21.
22.
23.
24.
25.
26.
27.
28.
29.
30.
31.
32.
33.
34.
35.
36.
37.
38.
39.
40.
41.
42.
43.
44.
Name of genotype
Asayuki
Enshutukasuka
Fukushima
Goshyerami
Ichinose
Kairyoroso
Kamabori
Kokuso-20
Kokuso-27
Limencina
Miuraso
Rokokyoso
Shimanouchi
BC-259
Bhrem C-776
Behrampur
C-763
Chakmajra
Chinese white
Dhar local
Kanva-2
KNG
LF-1
LF-2
NS-1
NS-2
NS-3
S-1
S-30
S-36
S-41
S-54
S-146
S-799
S-1531
S-1608
S-1635
S-1708
Sujanpur
Tr-1
Tr-4
Tr-8
Tr-10
V-1
Donor Name
CSR & TI, Mysore
CSR & TI, Mysore
CSR & TI, Berhampore
CSR & TI, Mysore
RSRS, Kodathi
CSR & TI, Mysore
CSR & TI, Mysore
CSR & TI, Mysore
CSR & TI, Mysore
CSR & TI, Mysore
CSR & TI, Mysore
RSRS, Kodathi
CSR & TI, Mysore
CSR & TI, Berhampore
CSR & TI, Pampore
CSR & TI, Berhampore
CSR & TI, Mysore
DOS, J&k Govt.
CSR & TI, Mysore
DOS, J&k Govt.
CSR & TI, Mysore
CSR & TI, Mysore
CSR & TI, Mysore
CSR & TI, Mysore
Div. of Sericulture, SKUAST-J.
Div. of Sericulture, SKUAST-J.
Div. of Sericulture, SKUAST-J.
CSR & TI, Mysore
CSR & TI, Mysore
CSR & TI, Mysore
CSR & TI, Mysore
CSR & TI, Mysore
RSRS, Kodathi
CSR & TI, Mysore
CSR & TI, Mysore
CSR & TI, Berhampore
CSR & TI, Berhampore
CSR & TI, Berhampore
DOS, J&K Govt.
CSR & TI, Berhampore
RSRS, Kodathi
RSRS, Kodathi
RSRS, Kodathi
CSR & TI, Mysore
496
Origin
Cross Pollinated Hybrid
Collection
Collection
Selection
Cross Pollinated Selection
Cross Pollinated Hybrid
Cross Pollinated Hybrid
Mutation
Cross Pollinated Hybrid
Collection
Collection
Clonal Selection
Cross Pollinated Hybrid
Back Cross Selection
Cross Pollinated Selection
Clonal Selection
Cross Pollinated Hybrid
Natural Selection
Collection
Open Pollinated Hybrid
Cross Pollinated Hybrid
Clonal Selection
Clonal Selection
Clonal Selection
Open Pollinated
Open Pollinated
Open Pollinated
Clonal Selection
Mutation
Mutation
Mutation
Mutation
Open Pollinated Selection
Open Pollinated Hybrid
Open Pollinated Selection
Open Pollinated Hybrid
OPH Selection
Open Pollinated Selection
Open Pollinated Collection
Colchiploid
Polyploid
Polyploid
Polyploid
Cross Pollinated Hybrid
Int.J.Curr.Microbiol.App.Sci (2019) 8(2): 493-499
Table.2 Pooled mean values of eight quantitative traits of mulberry genotypes for the year 2017-18
S.No.
1.
2.
3.
4.
5.
6.
7.
8.
9.
10.
11.
12.
13.
14.
15.
16.
17.
18.
19.
20.
21.
22.
23.
24.
25.
26.
27.
28.
29.
30.
31.
32.
33.
34.
35.
36.
37.
38.
39.
40.
41.
42.
43.
44.
Genotype
Asayuki
Enshutukasuka
Fukushima
Goshyerami
Ichinose
Kairyoroso
Kamabori
Kokuso-20
Kokuso-27
Limencina
Miuraso
Rokokyoso
Shimanouchi
BC-259
Bhrem C-776
Behrampur
C-763
Chakmajra
Chinese white
Dhar local
Kanva-2
KNG
LF-1
LF-2
NS-1
NS-2
NS-3
S-1
S-30
S-36
S-41
S-54
S-146
S-799
S-1531
S-1608
S-1635
S-1708
Sujanpur
Tr-1
Tr-4
Tr-8
Tr-10
V-1
Mean
S.D.
Leaf
length
(cm)
Leaf
width
(cm)
Leaf
area
(cm2)
Fresh
weight 100
leaves (g)
16.8
15.1
19.1
21.8
16.2
4.8
17.5
18.1
11.4
14.8
19.3
18.0
17.6
16.0
19.6
21.1
21.8
22.0
19.5
16.6
18.5
15.0
16.5
20.6
23.2
22.9
18.1
17.5
18.1
16.8
21.7
23.3
22.2
34.8
19.3
21
19.6
19.6
20.6
17.1
18.8
18.5
16.0
20.4
18.6
3.09
11.2
08.1
11.1
12.6
09.6
09.6
10.6
10.9
6.9
09.8
09.3
8.8
12.1
10.9
09.7
13.0
10.7
11.8
11.1
10.3
10.4
08.2
09.9
10.5
11.5
12.5
12.0
09.1
10.4
09.3
11.6
12.5
12.5
08.4
10.1
09.8
11.6
11.7
11.2
09.6
12.1
11.8
10.7
10.3
10.6
1.78
191.7
123.9
213.0
278.0
156.5
141.0
188.9
197.5
80.1
147.5
181.1
159.4
215.7
175.9
190.6
276.0
237.0
261.5
222.3
172.5
195.4
125.6
163.7
216.8
271.6
288.4
218.4
161.4
191.8
158.3
253.4
295.0
272.6
122.4
194.6
206.6
227.7
233.1
232.0
164.7
228.5
223.4
172.3
212.1
201.0
60.41
141.4
156.7
177.5
240.3
205.4
102.9
133.1
155.4
98.3
125.8
362.4
161.7
149.9
235.3
306.8
216.7
217.2
258.6
356.9
346.0
243.5
191.7
306.1
208.1
232.1
244.6
279.1
178.9
266.3
233.4
322.9
400.6
299.1
126.6
225.3
341.4
376.6
320.1
246.2
216.7
494.8
358.1
153.8
333.2
224.1
96.36
497
Dry
weight
100
leaves (g)
22.8
21.9
20.4
52.4
35.2
24.2
26.4
30.2
14.1
22.4
69.6
37.3
26.2
44.2
42.6
24.9
32.7
36.7
64.4
63.7
77.2
29.5
84.8
63.7
30.5
38.9
48.6
31.3
60.0
72.2
54.7
64.1
79.8
38.6
57.8
76.2
81.3
31.4
24.9
28.0
91.9
75.8
52.6
47.7
46.7
22.16
Leaf
moisture
(%)
Internodal
distance
(cm)
Leaves/
meter
twig (no.
83.8
86.0
88.5
78.1
82.8
76.4
80.1
80.5
85.1
82.1
80.7
77.0
82.5
81.2
86.1
88.5
85.0
85.8
82.0
81.5
68.2
84.6
72.2
69.3
86.8
84.0
82.5
82.5
77.4
69.0
83.0
84.1
73.3
69.5
74.3
77.6
78.4
90.1
89.8
87.0
81.4
78.8
65.7
85.6
80.2
7.41
4.0
4.6
3.8
4.6
4.3
4.5
4.7
5.0
3.2
4.7
6.3
5.1
3.4
5.4
9.0
4.7
6.9
3.9
7.0
6.6
5.0
4.1
4.7
6.8
4.8
9.7
5.8
5.6
4.7
4.9
5.2
5.1
5.6
5.0
6.5
7.1
6.7
7.0
5.6
8.0
7.4
8.4
5.8
6.4
5.6
1.67
23
19
17
17
17
18
18
17
30
19
14
18
19
12
10
11
12
11
11
12
12
19
18
12
12
12
13
14
15
15
13
17
14
13
12
13
14
13
11
14
13
12
13
14
15.2
4.20
Int.J.Curr.Microbiol.App.Sci (2019) 8(2): 493-499
Table.3 Coefficient of variations (PCV and GCV), heritability percentage and genetic advance
for eight quantitative traits of 44 mulberry genotypes
PCV
(%)
39.72
GCV
(%)
35.06
GA
24071 2081
H2
(%)
7329.7 9411.1 77.9
114.7
25.1
29.8
54.9
54.3
15.87
11.70
17.8
114.7
25.1
29.8
54.9
54.3
9.24
6.81
10.3
S.No. Character
MST
1.
Range
Min.
Max.
Fresh
leaf 98.3
494.8
weight (g)
Dry
leaf 4.1
91.9
weight (g)
Moisture
65.7
90.1
content (%)
Internodal
distance
(cm)
Leaves/m
(no.)
Leaf length
(cm)
Leaf width
(cm)
2.
3.
4.
5.
6.
7.
8.
EV
GV
PV
63.7
3.2
9.7
6.3
0.9
1.7
2.7
64.4
29.50
23.68
0.3
10.0
30.0
42.1
5.5
12.1
17.7
68.6
27.72
22.95
3.9
4.8
34.8
21.6
3.7
5.9
9.7
61.4
16.75
13.13
21.2
6.9
13.0
5.5
2.0
1.1
3.2
36.7
16.92
10.25
12.8
1916
1781.8 3697.7 48.2
30.24
20.99
30.0
Actual leaf 80.1
area (cm²)
295.0 7261
Note: MST: Mean square treatment, EV: environmental variance, GV: genetic variance, PV: phenotypic variance,
H2: heritability percentage, PCV: phenotypic cofficient of variance, GCV: genotypic cofficient of variance and GA:
genetic advance
Fig.1 Genetic parameters for eight quantitative traits of 44 mulberry genotypes
Tikader and Rao (2002) supported the current
observations and highlighted the important of
variability estimates for selection of parents in
breeding programme. Similar results were also
obtained by Puttarama et al., (2000), Siddiqui et
al., (2003), Tikader et al., (2004), Banerjee et al.,
(2007) and Murthy et al., (2010) and stated that
phenotypic variations were high as compared to
498
Int.J.Curr.Microbiol.App.Sci (2019) 8(2): 493-499
genotypic variation. Maximum heritability
percentage was observed for fresh leaf weight
(77.9) whereas least for leaf width (36.7%) which
supports the earlier observations made by Tikader
and Roy (1999) and Chikkalingaiah et al., (2008).
High genetic advance was recorded for fresh leaf
weight (63.7) followed by actual leaf area (30.0),
leaf length (21.2), dry leaf weight (17.8), leaf
width (12.8), moisture percentage (10.3), number
of leaves per meter twig (3.9) and internodal
distance (0.3). Similar kinds of results were also
reported by Banerjee et al., (2008),
Mallaikarjunappa et al., (2008) and Suresh et al.,
(2017).
JGG, 34(8): 691-697.
Chikkalingaiah., Chinnaswamy, K. P., Devi, G. T.
and Venkatesh, M. 2008. Evaluation of
mulberry germplasm for different growth
parameters in Morus indica. International
conference on trends in Seribiotechnology,
March.27-29, Ananthapur, P.4.
Mallikarjunappa, R. S., Venkateshaiah, H. V.,
Rao, M. S. E., Anantharaman, M. N., and
Bongale, U. D. (2008). Genetic variability
and correlation studies in mulberry
germplasm. IJS, 47(2): 226-229.
Murthy, B. C. K., Puttaraju, H. P., and Hittalmani,
S. (2010). Genetic variability and
correlation studies in selected mulberry
(Morus spp.) germplasm accessions.
Electron J Plant Breed, 1(3): 351-355.
Puttarama, N., Rangaiah, S., Govindan, R., Nehru,
S.D., and Dandin, S.B. (2000). Genetic
variability for leaf yield and quality traits in
mulberry (Morus sp.). Environment and
Ecology, 18(2): 295-298.
Siddiqui, A. A., Babu, L., and Khatri, R. K.
(2003). Genetic variability in mulberry for
foliar traits. Indian Journal of Forestry,
26(3): 217-219.
Suresh, K., Jalaja, S. K., Banerjee, R., and
Trivedy, K. (2017). Genetic variability,
correlation
and
path
analysis
in
physiological and yield attributes in
mulberry (Morus spp.). Journal of Crop and
Weed, 13(1): 28-33.
Tikadar, A., and Roy, B. N. (1999). Genetic
variability and character association in
mulberry (Morus spp.). Indian Journal of
Forestry, 22(2): 26-29.
Tikader, A. and Roy, A. 2002. Phenotypic
variation in mulberry (Morus spp.)
germplasm. Sericologia, 42(2): 221-233.
Tikader, A., Thangavelu, K., and Ananda, A. R.
(2004). Characterisation and evaluation of
mulberry (Morus spp.) Germplasm. IJS,
43(1): 106-110.
High estimates of genetic gain coupled with high
values of GCV depicted that these traits are under
the control of additive genes and therefore
phenotypic selection plays significant role in
selection of parental material for improvement
and development of promising genotypes by
simple selection procedures.
Acknowledgement
The author is highly thankful to Dr. M. Iqbal
Jeelani Bhat Assistant Professor (Statistics) Shere-Kashmir University of Agriculture Sciences and
Technology-Jammu, for his valuable guidance and
support for completion of this study.
References
Banerjee, R., Chowdhuri, S. R., Sau, H., Das, B.
K., Ghosh, P. L., and Sarkar, A. (2008).
Multiple yield traits for selection of
mulberry (Morus spp.) germplasm for
higher productivity. INDIAN J AGR SCI,
78(2): 142-145.
Banerjee, R., Roychowdhuri, S., Sau, S., Das, B.
K., Ghosh, P., and Saratchandra, P.
(2007).Genetic
diversity
and
interrelationship among mulberry genotype.
How to cite this article:
Suraksha Chanotra, Ramesh Kumar Bali and Kamlesh Bali. 2019. Estimation of Genetic Variability and
Heritability in Selected Mulberry Germplasm Accessions (Morus spp.). Int.J.Curr.Microbiol.App.Sci.
8(02): 493-499. doi: />
499