Correlation studies of growth and flowering of Dendrobium cv. sonia with microclimatic variables in different protected structures
Bạn đang xem bản rút gọn của tài liệu. Xem và tải ngay bản đầy đủ của tài liệu tại đây (366.79 KB, 9 trang )
Int.J.Curr.Microbiol.App.Sci (2019) 8(4): 954-962
International Journal of Current Microbiology and Applied Sciences
ISSN: 2319-7706 Volume 8 Number 04 (2019)
Journal homepage:
Original Research Article
/>
Correlation Studies of Growth and Flowering of Dendrobium cv. Sonia with
Microclimatic Variables in Different Protected Structures
Punam Saikia*, Pradip Mahanta and Rajib Lusan Deka
Department of Horticulture, Assam Agricultural University Jorhat, Assam-785013, India
*Corresponding author
ABSTRACT
Keywords
Correlation,
Dendrobium,
Growth, Flowering,
Microclimate,
Protected structure
Article Info
Accepted:
10 March 2019
Available Online:
10 April 2019
The present investigation entitled “Correlation studies of growth and flowering of
Dendrobium cv. Sonia with microclimatic variables in different protected structures” was
conducted in the Experimental Farm, Department of Horticulture, Assam Agricultural
University, Jorhat during 2017-2018. The experiment was laid out with 5 treatments
replicated three times viz. G1 (Bamboo frame structure covered with fixed 200 micron UV
film with top ventilated and 50% agro shade net as ceiling), G2 (Bamboo frame structure
with fixed 50% agro shade net as cladding material), G3 (Bamboo frame structure covered
with fixed 200 micron UV film with side removable and 50% agro shade net as ceiling),
G4 (Bamboo frame structure with fixed 50% agro shade net and 200 micron UV film as top
covering) and G5(Bamboo frame structure with 200 micron UV film side removable and
fixed 50% agro shade net as covering). It was observed that all the microclimatic
parameters of protected structures were found to be lower than the open field condition.
The highest maximum and minimum temperature were found in G 3 while the highest
morning and evening humidity were found in G2 during 2017 and 2018, respectively. The
highest average light intensity was found in G1. It was found that all the growth characters
highly correlated with maximum temperature and minimum temperature under G 1
condition. For flower characters mean microclimatic parameters calculated from 5
different phenophases viz. PP1 (planting to bud visibility), PP2 (planting to full bloom), PP3
(bud visibility to opening of first floret), PP 4 (bud visibility to full bloom) and PP 5
(opening of first floret to full bloom). The highest negative correlation coefficient of most
of the flower characters was found at PP1 and PP4 phase in respect of maximum
temperature and minimum temperature.
cut flower trade of the world mostly consists
of 70-80 per cent Dendrobium species
(Cheamuangphan and Panmanee, 2013).
About 103 species of Dendrobium orchids are
reported from India (Singh et al., 2001). Out
of them, 82 species are from North East
Region. Dendrobium cv. Sonia flowered
Introduction
Dendrobiums are most popular tropical orchid
getting fame as cut flowers in India as well as
in the world. It comprises approximately
1200-1500 species and more than thousand
types of hybrids in the world. The total orchid
954
Int.J.Curr.Microbiol.App.Sci (2019) 8(4): 954-962
throughout the year with peak flowering
during August to October and March to June
under North East Region. Dendrobium
orchids are specialty flowers and require
special
attention
during
cultivation.
Dendrobium grows best at night temperatures
between 15-180C and day temperatures 23290C. They prefer 60-80 per cent of relative
humidity. They grow well both in tropical and
subtropical climate and require warm bright
light (25,000-30,000 lux) as well as good
ventilation. Therefore, Dendrobiums are
grown under protected condition for both
plant sale and cut flowers production. But, in
North East India, Dendrobium orchids are
normally grown under shade net houses
which are quite vulnerable to cold injury
during extreme winter period which causes
severe impediment in growth and flowering.
Therefore, attention should be given to the
climate demands of flowers grown to allow
achieving better productivity and high quality
flowers according to the consumer preference.
Hence, the present investigation is aimed to
study the correlation of growth and flowering
habit of Dendrobium cv. Sonia with
microclimatic variables in different protected
structures.
covered with fixed 200 micron UV film with
side removable and 50% agro shade net as
ceiling), G4 (Bamboo frame structure with
fixed 50% agro shade net and 200 micron UV
film as top covering), G5 (Bamboo frame
structure with 200 micron UV film side
removable and fixed 50% agro shade net as
covering). These were oriented in NorthSouth direction with a size of 4 m length, 4 m
width and central height of 3 m. Plantlets
were planted in the plastic basket of size 6"
depth and 4" diameter and basket was filled
laying 1" at the top with a mixture of
charcoal, coco husk and coco peat. These
were arranged at the rate of 20 plants on
bamboo bench at a size of 1m breath and 3 m
length. Fertilizer mixture NPK- 19:19:19 @
2g/L was given twice a week as foliar spray.
All the observations were recorded for two
growing season i.e. 2017 and 2018. Karl
Pearson’s correlation coefficient (r) was
calculated and the test of significance was
applied as per the procedure outlined by
Fisher and Yates (1963).
Materials and Methods
The meteorological data viz. maximum
(Tmax) and minimum (Tmin) temperature,
morning (RH I) and evening (RHII) relative
humidity, light intensity were recorded in
daily basis and monthly mean values were
computed (Table 1–5).
Results and Discussion
Microclimatic variation
The
present
investigation
entitled
“Correlation studies of growth and flowering
of Dendrobium cv. Sonia with microclimatic
variables in different protected structures”
was conducted in the Experimental Farm,
Department
of
Horticulture,
Assam
Agricultural University, Jorhat during the
period of 2017-2018 for two seasons. The
experiment was laid out in Completely
Randomized Design with 5 treatments
replicated three times viz. G1(Bamboo frame
structure covered with fixed 200 micron UV
film with top ventilated and 50% agro shade
net as ceiling), G2 (Bamboo frame structure
with fixed 50% agro shade net as cladding
material),G3 (Bamboo frame structure
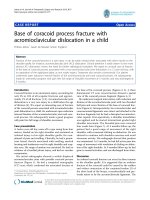
Temperature (0C)
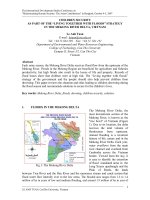
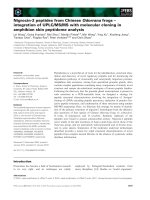
Prevalence of high maximum temperature
was more pronounced under open field
condition. Further, amongst the growing
structures, G3 exhibited the highest average
maximum and minimum temperature as
compared to the others. The lowest minimum
temperature was observed on January during
2017 and 2018, respectively (Fig. 1 and 2).
955
Int.J.Curr.Microbiol.App.Sci (2019) 8(4): 954-962
leaves per plant had positive and significant
correlation with maximum temperature
(0.632) of G2 whereas minimum temperature
(0.560) and light intensity (0.317) of G1
treatment. There was negative correlation
between relative humidity and leaves per
plant under the growing structures. Leaf area
per plant was also positively correlated with
maximum temperature and minimum
temperature. Highest positive correlation
coefficient was obtained in respect of
maximum temperature (0.666) of G2 while
minimum temperature (0.592) of G4
treatments. Height of pseudobulb was
positively
correlated
with
maximum
temperature and minimum temperature.
Highest correlation coefficient was obtained
in respect of maximum temperature (0.630)
under G2 while minimum temperature (0.584)
under G1.Pseudobulbs per plant was also
positively
correlated
with
maximum
temperature and minimum temperature.
Highest positive correlation coefficient was
obtained in respect of maximum temperature
(0.462)
and
light
intensity (0.552)
corresponding to the treatment G1.
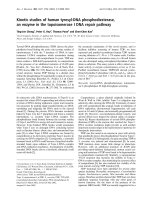
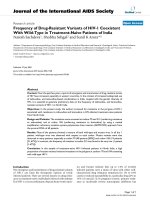
Relative humidity (%)
It was observed that relative humidity inside
the growing structures was always less than
the open field condition. In case of protected
structures, the highest morning relative
humidity was found on January whereas the
lowest morning relative humidity was
observed on May during 2017 as well as on
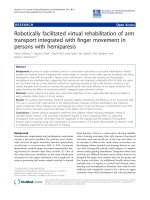
April during 2018 (Fig. 3 and 4). The highest
evening relative humidity was found during
the months of July to August. The lowest
evening relative humidity was observed on
February for both years. The highest average
relative humidity irrespective of the
microclimatic regimes was found in G2.
Light intensity (lux)
It was observed that relative humidity inside
the growing structures was always less than
the open field condition. A glance at the
monthly light intensity graph showed that the
highest average light intensity was found in
G1 followed by G4 for both the years. The
highest light intensity was observed on
February as well as the lowest one on August
in different growing structures for both the
years (Fig. 5).
The results indicate that correlation for all
growth characters was found highly
significant. The possible reason is that the
control of the microclimatic variables inside
the protective structure is an extremely
dynamic process. Most of the climatic
parameters dependent on the ventilation rate,
shading which in turn were either due to
buoyancy effect or by wind effect or both. In
the present study, G1 (Bamboo frame
structure covered with fixed 200 micron UV
film with top ventilated and 50% agro shade
net as ceiling) was found to be superior
among growing structures. This phenomenon
could be attributed to the favorable
environmental conditions viz., optimum
temperature, relative humidity, light intensity
and proper air circulation inside the growing
system which may drastically influence the
Growth characters
The growth characters and microclimatic
parameters were subjected to correlation
analysis based on five protected structures
namely G1, G2, G3, G4 and G5.
The data explained that plant height was
highly
influenced
by
microclimatic
parameters
showing
highest
positive
significant correlation coefficient in respect of
maximum temperature (0.629) of G2 as well
as minimum temperature (0.551) of G1
treatment. On the other hand, light intensity
was negatively correlated with plant height in
most of the treatments. It was found that
956
Int.J.Curr.Microbiol.App.Sci (2019) 8(4): 954-962
growth of the plants. Similar findings have
been reported by Zou and Liu (2010) and Taiz
and Zieger (2002).
phenophase. Similarly, vase life was
positively correlated with evening relative
humidity (0.842) during PP4 followed by PP5
(0.814) phenophase.
Flower characters
It was evident that flower quality and yield
highly influence by microclimatic variables.
This might be due to that the flower induction
is a complex systemic process regulated by
numerous genes, promoters and inhibitors,
which are triggered by various signals, such
as photoperiod and temperature. High
temperature (above 25-30 0C) experienced
during the period when flower induction and
initiation normally occur also delays them,
but under these conditions, the flowering
capacity of plants is maintained.
Correlation of different flower characters with
microclimatic parameters at 5 different
phonological phases viz. PP1 (planting to bud
visibility), PP2 (planting to full bloom), PP3
(bud visibility to opening of first floret), PP4
(bud visibility to full bloom) and PP5 (opening
of first floret to full bloom) in respect of
different crop growth stages.
Spikes per plant were negatively or positively
correlated with most of the microclimatic
parameters at different phonological phases.
The results revealed that spikes per plant was
highly
influenced
by
microclimatic
parameters showing highest significant
correlation coefficient in respect of minimum
temperature (-0.933) during PP1 phenophase
followed by PP3. The correlation for spike
length was found highly significant at
different
phenophase,
but
negatively
correlated with maximum temperature (0.558) and minimum temperature (-0.872)
during PP1 phenophase followed by PP3.
Florets per plant was highly influenced by
microclimate showing highest significant
correlation coefficient in respect of maximum
temperature
(-0.654)
and
minimum
temperature (-0.842) during PP1 phenophase
followed by PP5.
But, too low temperature reduced the
respiration and other biochemical activities,
as well as the length of stem and number of
flowers, which are considered the main
parameters for cut stem grading. From the
data it was observed that with the onset of
spring in March, there was a rise in
temperature, which breaks the vegetative
dormancy set in the winter and induces
flowering in many Dendrobium. Correlation
between light intensity and flowering showed
that light intensity during flower initiation
affected the flower or plant quality. Sayed
(2001) also reported similar effect of
temperature on Phalaenopsis and Robinson
(2002) observed that air temperature has high
correlation with quality of the flowers.
Floret diameter was highly influenced by
minimum temperature (-0.856), light intensity
(-0.837) showing highest negative significant
correlation coefficient during PP4.Shelf life of
spike was highly influenced by maximum
temperature
(-0.734)
and
minimum
temperature (-0.591) showing highest
negative significant correlation coefficient at
PP2 phenophase whereas positively correlated
with evening relative humidity (0.866) at PP4
In conclusion, better growth, development
and yield of flower were achieved under G1
due to the higher (optimum) temperature and
lower relative humidity during the winter
months (January to February) and lower
temperature and relatively higher relative
humidity during summer month (March to
May), so growers are benefited by being able
to produce higher yield and quality which
fetched premium prices in the market.
957
Int.J.Curr.Microbiol.App.Sci (2019) 8(4): 954-962
Table.1 Correlations between microclimatic parameters and plant height and leaves per plant of Dendrobium cv. Sonia (mean over
two years)
Microclimatic
Plant height (cm)
Leaves per plant
parameters
G1
G2
G3
G4
G5
G1
G2
G3
G4
G5
0.584** 0.629**
0.525*
0.582**
0.582**
0.614**
0.632**
0.551*
0.598**
0.599**
Tmax
0.551*
0.511*
0.468*
0.524*
0.502*
0.560*
0.511*
0.477*
0.537*
0.521*
Tmin
0.050
-0.170
-0.175
-0.062
0.268
-0.026
-0.251
-0.129
-0.124
0.172
RH I
0.021
0.122
-0.189
-0.037
0.082
0.045
0.164
-0.161
0.007
0.128
RH II
0.344
-0.827** -0.829**
0.249
-0.524*
0.317*
-0.800*
-0.750**
0.220*
-0.482
Light intensity
Table.2 Correlations between microclimatic parameters and leaf area per plants and height of pseudobulb of Dendrobium cv. Sonia
(mean over two years)
2
Microclimatic
Leaf area per plant (cm )
Height of pseudobulb(cm)
parameters
G1
G2
G3
G4
G5
G1
G2
G3
G4
G5
0.612** 0.666** 0.571**
0.641** 0.636**
0.598**
0.630**
0.579**
0.606**
0.605**
Tmax
0.586**
0.533*
0.502*
0.592** 0.574**
0.584**
0.524*
0.534*
0.563**
0.542*
Tmin
0.067
-0.145
-0.138
-0.090
0.261
0.078
-0.091
-0.111
-0.05
0.280
RH I
0.041
0.155
-0.215
-0.046
0.066
0.041
0.144
-0.233
-0.100
-0.009
RH II
0.287
-0.781* -0.714**
0.132
-0.496
0.374
-0.806**
-0.800**
0.246
-0.548*
Light
intensity
Table.3 Correlation coefficient of microclimatic parameters at different phenophases with spikes per plant and spike length of
Dendrobium cv. Sonia (mean over two years)
Microclimatic
parameters
T max
T min
RH I
RH II
Light
intensity
PP1
-0.605
**
-0.933
-0.325
-0.251
-0.241
PP2
-0.337
-0.498
-0.297
-0.134
-0.298
Spikes per plant
PP3
PP4
-0.588
-0.565
**
-0.837
-0.144
0.043
-0.299
**
-0.811
0.029
0.040
-0.271
PP5
-0.436
-0.522
PP1
-0.558*
-0.872**
0.238
0.071
-0.545
-0.308
-0.252
-0.113
958
Spike length(cm)
PP2
PP3
PP4
-0.279
-0.473
-0.493
**
-0.504
-0.817**
-0.833
PP5
-0.380
-0.454
-0.281
-0.105
-0.191
0.234
0.184
-0.681*
-0.142
0.099
-0.263
0.019
0.116
-0.262
Int.J.Curr.Microbiol.App.Sci (2019) 8(4): 954-962
Table.4 Correlation coefficient of microclimatic parameters at different phenophases with florets per spike and floret diameter of
Dendrobium cv.Sonia (mean over two years)
Microclimatic
parameters
T max
T min
PP1
-0.654*
-0.842**
RI
RH II
Light intensity
-0.240
-0.083
-0.290
Florets per spike
PP2
PP3
PP4
PP5
-0.454
-0.613*
-0.610
-0.454
**
-0.567
-0.864** -0.594*
-0.847
-0.181
0.048
-0.346
-0.031
0.214
-0.306
0.145
0.336
0.224
0.229
-0.866** -0.582*
PP1
-0.471
-0.829**
-0.339
-0.228
-0.251
Floret diameter (cm)
PP2
PP3
PP4
-0.284
-0.472
-0.481
**
-0.615*
-0.856**
-0.856
-0.347
-0.090
-0.310
-0.239
0.106
-0.279
-0.102
0.105
-0.837**
PP5
-0.332
-0.558*
0.090
0.136
*
-0.650
Table.5 Correlation coefficient of microclimatic parameters at different phenophases with shelf life and vase life of Dendrobium
cv.Sonia (mean over two years)
Microclimatic
parameters
T max
PP1
-0.464
T min
RH I
RH II
0.039
0.470
0.768**
Light intensity
-0.080
Shelf life of spike (days)
PP2
PP3
PP4
*
-0.441
-0.552
-0.734
PP5
-0.464
PP1
-0.616*
Vase life of spike (days)
PP2
PP3
PP4
-0.405
-0.556*
-0.569
PP5
-0.431
-0.600
0.570
-0.591*
0.476
-0.836**
-0.222
-0.117
-0.624*
-0.162
0.042
-0.894**
0.029
0.232
-0.896**
0.138
0.270
-0.572*
0.346
0.341
-0.139
-0.215
-0.284
-0.817**
-0.634*
**
0.840
-0.085
-0.460
0.536
**
0.807
0.030
-0.585
0.541
0.866**
-0.223
**
0.785
-0.191
*Significant at 5 % level, ** Significant at 1% level
959
Int.J.Curr.Microbiol.App.Sci (2019) 8(4): 954-962
Fig.1 Monthly temperature (ºC) variation in different growing structures and open
field during 2017
Fig.2 Monthly temperature variation (ºC) in different growing structures and open
field during 2018
Fig.3 Monthly humidity (%) variation in different growing structures and open field during 2017
960
Int.J.Curr.Microbiol.App.Sci (2019) 8(4): 954-962
Fig.4 Monthly humidity (%) variation in different growing structures and open field during 2018
Fig.5 Monthly light intensity (lux) variation in different growing structures and open field during
2017-2018
This information indicated that the study of
correlation among various climatic variables
and growth and flower characters are an
important aspect for better planning of
selection programs and choice of protected
system can be effective tool for the yield
improvement of Dendrobium cv. Sonia.
Microclimatic parameters play a unique role
in the growth and development of
Dendrobium orchids. So, the environment
control of greenhouse is necessary to achieve
a reasonable spatial distribution of the desired
961
Int.J.Curr.Microbiol.App.Sci (2019) 8(4): 954-962
temperature, relative humidity and light
intensity for crop growth.
thesis. Mich. State Univ. East Lansing.
Sayed, O. H. 2001. Crassulacean Acid
Metabolism
a
check
list,
Photosynthetica 5:748–754.
Singh, K.P., Phukan, S. and Bujarbarua, P.
(2001).
Floristic
Diversity
and
Conservation Strategies in India. Bot.
Surv. Ind., 4: 1736-1764.
Taiz, L., and Zieger, E. 2002. Petal abscission
in rose flowers: Effects of water
potential, light intensity and light
quality. Annals of Botany, 78: 619-623.
Zou, C.Y. and Liu, Y. 2010. Research
advances in Dendrobium research in
China. J. Anhui Agr., Sci. 38:61646166.
References
Cheamuangphan, A., Panmanee, C. and
Tanusuchat, R. 2013.Value chain
Analysis for orchid cut flower business
in Chiang Mai. Business and
information, 7-9.
Fisher, R.A. and Yates, F., 1963. Statistical
tables for Biological, Agricultural and
Medical research. Oliver and Boyd Ltd.,
Edin burgh.
Robinson, K.A. 2002. Effect of temperature
on the flower development rate and
morphology of Phalaenopsis orchid. MS
How to cite this article:
Punam Saikia, Pradip Mahanta and Rajib Lusan Deka. 2019. Correlation Studies of Growth
and Flowering of Dendrobium cv. Sonia with Microclimatic Variables in Different Protected
Structures. Int.J.Curr.Microbiol.App.Sci. 8(04): 954-962.
doi: />
962