Modelling the respiration rate of fresh-cut pear (Pyrus communis L.) packaged in modified atmosphere
Bạn đang xem bản rút gọn của tài liệu. Xem và tải ngay bản đầy đủ của tài liệu tại đây (464.01 KB, 11 trang )
Int.J.Curr.Microbiol.App.Sci (2019) 8(4): 574-584
International Journal of Current Microbiology and Applied Sciences
ISSN: 2319-7706 Volume 8 Number 04 (2019)
Journal homepage:
Original Research Article
/>
Modelling the Respiration Rate of Fresh-Cut Pear (Pyrus communis L.)
Packaged in Modified Atmosphere
Ram Prakash Kumar* and T.K. Goswami
Department of Agriculture and Food Engineering, Indian Institute of Technology,
Kharagpur, India
*Corresponding author
ABSTRACT
Keywords
Modified
atmosphere
packaging,
Chemical treatment,
Polypropylene,
Respiration,
Enzyme kinetics
Article Info
Accepted:
07 March 2019
Available Online:
10 April 2019
Respiration rate is the important factor involved in creating a modified atmosphere
inside a package that will extend the shelf life of fresh fruits and vegetables. Thus,
modelling respiration rate of the selected produce is crucial to develop a modified
atmosphere packaging (MAP) system. In this study, MAP has been combined with
1% Calcium chloride and 1% citric acid solution. Respiration rates of fresh-cut
pear packaged in polypropylene pouches at 8 ˚C. A mathematical model
describing the dynamics of O2 and CO2 concentrations inside the MAP package of
fresh-cut pear was formulated. It was found that the Michaelis-Menten equation
with uncompetitive inhibition kinetic fitted best with the experimental results. The
results of the model agreed well with the experimental results with the values of
the correlation coefficient, r2>0.90. The model could be used to develop a
modified atmosphere packaging (MAP) for fresh-cut pear.
high cholesterol (Velmurugan and Bhargava,
2013). It possesses multiple medicinal
properties such as anti-inflammatory,
sedative,
anti-pyretic,
anti-oxidants,
hypolipidemic, hypoglycaemic, anti-ageing,
anti-tussive,
anti-diarrheal,
and
hepatoprotective (Parle and Arzoo, 2016).
Introduction
Pear (Pyrus communis L.) is a gently sweet
juicy fruit with glitter texture and delicious
taste. Pears are a rich source of vitamin C,
quercetin and copper, which protect cells
from damage by free radicals. Pears are high
in dietary fibre, containing 6 g per serving
(Reiland and Slavin, 2015). The fruit contains
a high amount of pectin, which lowers down
the levels of low-density lipoprotein (LDL)
and triglycerides thereby reducing the risk of
Respiration
biochemical
oxygen are
water, and
574
of fruits and vegetables is the
process in which sugars and
converted into carbon dioxide,
heat. Controlling respiration is
Int.J.Curr.Microbiol.App.Sci (2019) 8(4): 574-584
essential to store produce for a long time. By
storing a commodity at low temperature,
respiration is reduced and senescence is
delayed, thus extending storage life
(Halachmy and Mannheim, 1991). Proper
control of the oxygen and carbon dioxide
concentrations surrounding a commodity is
also effective in reducing the rate of
respiration. Modified atmosphere packaging
(MAP) is a technique used for prolonging the
shelf-life of fresh or processed foods by
modifying the air surrounding the food in the
package to a different composition. Inside
packages, O2 concentration is reduced while
CO2concentration is increased, causing a
reduction in product’s respiration rate and a
consequent slowing down of senescence and
decay phenomena (Das et al., 2006).
However, modified atmosphere packaging
(MAP) alone does not completely control the
post-cutting enzymatic browning of fresh-cut
fruits (Gorny et al., 2002). The greatest
hurdles to the commercial marketing of freshcut fruit products are limited shelf-life due to
the browning of cut surface and rapid loss of
firmness. Cut surface browning in sliced is
caused by the action of polyphenol oxidase
(PPO) on phenolic compounds released
during the process of cutting (Amiot et al.,
1995). Fruit tissue softening during ripening
and senescence is a consequence of
alterations in cell wall metabolism triggered
by ethylene. There are numerous chemical
and physical preservation strategies that can
be used to reduce enzymatic browning and
fruit tissue softening after cutting. A great
number of studies have been conducted to
avoid browning surfaces on fresh-cut fruits
using selected agents such as ascorbic acid, 4hexylresorcinol, cysteine, N-acetylcysteine
and sodium erythorbate (Arias et al., 2008;
Dong et al., 2000; Oms-Oliu et al., 2006;
Sapers and Miller, 1998; Soliva-Fortuny et
al., 2002). Another concern related to the
extension of shelf life for fresh-cut fruit is
softening, which is primarily due to
enzymatic degradation of the cell wall.
Calcium salts, and particularly calcium
chloride and lactate, are generally used in
combination with browning inhibitors as
firmness-maintaining agents in a wide range
of cultivars of fresh-cut fruit and vegetables
(Alandes et al., 2006).
Combinations of modified atmosphere
packaging (MAP) and chemical treatment
have been successfully studied to increase the
shelf-life of various fruit such as strawberry
(Aguayo et al., 2006), litchi (Sivakumar and
Korsten, 2006), banana (Vilas- Boas and
Kader, 2006), apple (Rocculi et al., 2004) and
fresh-cut pear (Sapers and Miller, 1998).
The objectives of this study were developing
a suitable model for determining the
respiration rate of fresh-cut pear and to find
out the combined effect of chemical treatment
with MAP on the respiration rate of freshly
cut pear.
Materials and Methods
Sample preparation
The fresh William Bartlett variety pears were
purchased from the local fruit market in
Kharagpur. The pears were stored in the
refrigerator for 3 hours at 0°C to assure its
freshness. The selected quantity of pears was
washed by running tap water, dried by cotton
and peeled by peeler manually. Then each
pear was cut into 7-8 wedges using a sharp
knife. Then the cut pears were dipped in water
to avoid frequent surface browning by contact
of air. After that, each wedge of pear dried by
tissue paper dipped in a chemical solution
(1% citric acid + 1% calcium chloride which
was previously prepared) for 5 minutes. Then
samples were removed from the container and
put in a glass plate. Pear slices were subjected
to four different treatments: (1) Map +
Treated -(1% citric acid + 1% CaCl2) and
575
Int.J.Curr.Microbiol.App.Sci (2019) 8(4): 574-584
stored in MAP at 8°C, (2) Treated -(1% citric
acid + 1% CaCl2) and stored at room
temperature and regular atmosphere, (3) MAP
+ Untreated -No chemical treatment and
stored in MAP at 8°C, (4) Untreated - No
chemical treatment and stored at room
temperature and regular atmosphere. The
samples of all groups were replicated three
times and stored for 8 days.
consumption or CO2production per unit
weight of the fruit per unit time. Letthe head
space inside the container was V (mL) and the
weight of fruit kept in the container was W
(kg). At time θi, the concentrations of O2 and
CO2 were yi and zi, respectively andafter time
θi+1, the concentrations of O2 and CO2
changed to yi+1 and zi+1, respectively.
Therefore, the rates of O2 consumption, Ry
(mL kg-1 h-1) and of CO2 production, Rz (mL
kg-1 h-1) at a given temperature were
calculated using the following Equations (1)
and (2) as given by Kays (1991):
Packaging material
Pear wedges were packaged in polypropylene
(PP) pouches of size 12 × 20 cm from inside
and 0.025 mm thickness (Nath et al., 2012).
The gas permeability of packaging material
was 2660cc µm m-2 h-1for O2 and 14958cc µm
m-2 h-1for CO2 at 1 atm.
(1)
(2)
Respiration data
The experimental respiration rates for O2
consumption and CO2were calculated by
putting the respiration data obtained from
respirometer in Equations (1) and (2).
The respiration data of samples in MAP were
estimated by sealed chamber technique
(Forcier et al., 1987). A special type of
container (respirometer) made out of acrylic
sheet was fabricated for measurement of the
rate of O2 utilized and CO2 produced (Plate
1). The dimensions and volume of the
container were 23.5 × 18 × 13.5 cm, and 5600
ml, respectively. The container was filled one
with treated and another one with untreated
pear such that the free volume was minimum.
Then the container was sealed and kept in a
refrigeration chamber at a pre-set temperature
(8°C). The concentrations of O2 and CO2 were
measured using a gas analyzer (PBI;
Dansensor, Ringsted, Denmark) after every 8
hours. The procedure was repeated three
times for both treated and untreated pear. The
concentrations of O2 and CO2 were recorded
till the CO2 concentration reaches 18%.
When the variation of y and z with θ is
expressed by a continuous functional
relationship, the Equations (1) and (2) can be
expressed as
) (3)
(4) where dy and dz,
respectively are the concentration differences
of O2 and CO2 within the time difference
between two gas measurements dθ.
It was assumed that the respiration rate
reached a stable condition when Equation (1)
was verified for:
Ry(θ) -Ry (θ-dθ) ≤ ±0.05(5)
Modelling of respiration rate
The experiment was performed at a given
temperature withthreereplications.
Respiration rates can be measured by
observing
the
concentration
of
O2
576
Int.J.Curr.Microbiol.App.Sci (2019) 8(4): 574-584
Inside a hermetically sealed container, the
variation of y and z as a function of θ was
observed by Hagger et al., (1992) as per the
following relationships:
predicting the respiration rate of fresh cut
pear. Equations (10) and (11) express the
uncompetitive inhibition mechanisms for the
respiration process in terms of O2
consumption and CO2production rate,
respectively. The model has three parameters
viz., Rm, Km, and Ki for both O2 consumption
and CO2 production.
(6)
(7)
Ry =
where 0.21 is the initial value in a fraction of
O2 in atmospheric air; ,
are
constants and θ is the storage time in h. After
finding dy/dθ and dz/dθ from Equations (6)
and (7) and putting them into Equations (3)
and (4) we get,
Ry=
(8)
Rz =
(9)
(10)
Rz =
(11)
Where Rm denotes the maximum rates
(mLkg-1 h-1), Km denotes the MichaelisMenten constant and Ki denotes the inhibition
constant. The model parameters were
determined using the experimental respiration
data using MS-EXCEL software.
Variation of O2 and CO2 concentration
inside modified atmosphere package
Using Equations (8) and (9) the values of Ry
and Rz at different values of θ were obtained
from the data available for pear kept inside
hermetically sealed container. At different
values of θ, values of y, z, Ry and Rz were
computed from Equations (6), (7), (8) and (9),
respectively. The values of Ry and Rz were
then related to the values of y and z by using
regression equations.
Let the concentrations (mL) of O2 and
CO2inside the package arey and z,
respectively. Similarly, ya and za are the
concentrations (mL) of O2 and CO2in
atmospheric air, respectively. For the transfer
of oxygen from atmospheric air through
packaging material into the package space,
following generalized equation was applied:
Considering that CO2 acts as a respiration
inhibitor, the effect of CO2 on the product
respiration can be described by the uncompetitive inhibition (McLaughlin and
O’Beirne, 1999). The maximum respiration
rate is not much influenced at high CO2
concentration. At high levels of CO2
concentration (17-18%), however, the
respiration mechanism changes from aerobic
to the anaerobic pathway (Mahajan, 2001).
Hence Michaelis-Menten enzyme kinetics
equation with uncompetitive inhibition (Lee
et al., 1991) was used to develop a modelfor
The rate of O2 entry into package space - Rate
of O2accumulation = Rate of O2accumulation
inside package space
That is, AP ky (ya-y) - WP × Ry= Ve ×
or
=-
Ry +
(12)
(ya- y) (13)
where
is the rate of change of O2
concentration within the package at θ
storagetime, Wp (kg) is the weight of fruit
stored inside the packaging material, Ve is the
577
Int.J.Curr.Microbiol.App.Sci (2019) 8(4): 574-584
headspace inside the packaging material
(mL), Ry (mL kg-1 h-1) is the respiration rate
of fruit for O2, Ap(m2) is the surface area of
packaging material through which O2 and
CO2 permeates, ky [mLh-1m-2 (concentration
difference of O2 infraction)-1] is the O2
permeability of packaging material and t is
the thickness of the packaging material.
Similarly, the transfer rate for CO2 from
inside to outside of packaging material can be
written as:
The respiration rates of treated and untreated
fresh-cut pear are shown in Table 1. It was
found that the decrease in concentration of
O2was almost proportional to the increase in
CO2 concentration with storage period.
Similar results were reported by Mangaraj
and Goswami (2011) for guava.
Modelling of respiration rate
A model based on principles of enzyme
kinetics and a regression model was
developed to predict the respiration rate of
fresh-cut pear at any combination of O2 and
CO2 concentrations.
The rate of CO2 generated by fruit - Rate of
CO2 leaving out of package space by fruit =
Rate of accumulation CO2 inside package
space.
Prediction of respiration rate based on
experimental data using regression analysis
That is,
Wp× Rz-Ap kz (za- z) = Ve
or
=
Rz-
Instantaneous O2 consumption and CO2
production rates were obtained by plotting gas
concentrations versus time and measuring the
slopes from linear regression line and
substituting the values of (dy/dθ) and (dz/dθ)
in Equations (3) and (4). Regression function
is often used to fit the data of gas
concentration versus time and the respiration
rate at the given time is determined from the
first derivative of the regression function
(Kang and Lee, 1998). By using the generated
respiration data, a non-linear regression
analysis was done to fit O2 and CO2
concentrations at different storage times.
(14)
(za-z) (15)
where,
is the rate of change of CO2
concentration within the package at θ
storagetime, Rz (mL kg-1 h-1) is the respiration
rate of fruit for CO2, Ap (m2) is the surface
area of the packaging material through which
CO2 permeation takes place.
Kz(mLh-1m-2 (concentration difference of CO2
infraction)-1) is the CO2 permeability of
packaging material and using regression
coefficient,
simultaneous
solution
of
Equations (13) and (15) by numerical means
the variation of oxygen concentration y and
carbon dioxide concentration zinside the
package with a time of storageθ were
calculated.
The regression coefficient ay, by and az, bz of
equations (6) and (7) and correlation
coefficients (r2) of both the sample are shown
in Table 2. Respiration rate was calculated
using equations (8) and (9).
The respiration rate as predicted by equations
(8) and (9) was found to be decreased with the
time due to depletion of O2 and accumulation
of CO2 inside respirometer in both conditions.
Similar observation was reported by Mangaraj
et al., (2014) forguava.
Results and Discussion
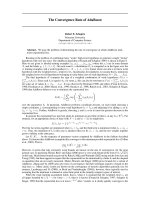
Respiration rate
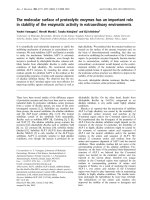
The respiration data obtained from closed
system respirometer are shown in Figure 1.
578
Int.J.Curr.Microbiol.App.Sci (2019) 8(4): 574-584
Equations (8) and (9) were verified with
experimental respiration rates calculated
using Equations (1) and (2).
Verification of the regression model
The respiration rates of fresh-cut pear
predicted through regression model shown in
Table.1 O2 consumption rate (Ry), CO2 production rate (RZ) and respiratory quotient
Sample
Treated pear
Untreated pear
Ry (mL kg-1 h-1)
7.844
8.78
Rz (mL kg-1 h-1)
6.97
7.90
Respiratory Quotient (Rz/Ry)
0.89
0.90
Table.2 Regression coefficients for O2 consumption and CO2 production
Regression coefficients
For O2 consumption
Sample
Treated pear
Untreated pear
ay
6.922
6.658
by
624.075
486.126
r2
Regression coefficients
For CO2production
az
0.9993 7.0012
0.9988 5.5014
bz
811.967
698.839
r2
0.9997
0.9998
Table.3 Model parameters of enzyme kinetics for treated and untreated fresh-cut pear
Km (%
O2 )
55.6448
46.0486
16.1176
Ki (%
CO2)
0.7295
1.1344
1.6461
r2
O2
CO2
O2
Rm(mL kg-1
h-1)
64.77
42.15
35.62
CO2
34.40
50.7237
2.7996
0.996
Sample
Treated pear
Untreated pear
Fig.1 Changes in O2and CO2concentration with storage time inside respirometer
579
0.989
0.992
0.990
Int.J.Curr.Microbiol.App.Sci (2019) 8(4): 574-584
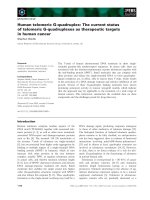
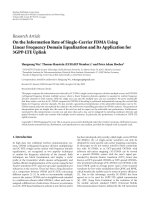
Fig.2 Experimentally estimated and predicted respiration rates for treated pear
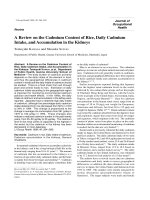
Fig.3 Experimentally estimated and predicted respiration rates for untreated pear
580
Int.J.Curr.Microbiol.App.Sci (2019) 8(4): 574-584
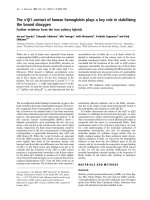
Fig.4 Change in gaseous composition inside the package for treated cut-pear
Fig.5 Change in gaseous composition inside the package for untreated cut-pear
Plate.1 Measurement of respiration data for Fresh-cut pears
581
Int.J.Curr.Microbiol.App.Sci (2019) 8(4): 574-584
The experimental and predicted respiration
rates for treated and untreated fresh-cut pear
at different time intervals are shown in Figure
2 and 3, respectively. The mean relative
deviation moduli between predicted and those
of experimentally determined respiration rates
for treated were found to be 9.35 % and 6.96
% for O2 consumption and CO2 evolution for
untreated 8.77% and 9.53 % for O2
consumption and CO2 evolution respectively.
This suggests that the respiration rates
predicted by the regression model are in
reasonably
good
agreement
with
experimentally determined respiration rates
for cut-pear.
different time intervals were fairly good
agreement with experimental respiration rates.
Effect of modified Atmospheric packaging
on chemically treated and untreated cutpear
Headspace O2 and CO2 compositions of both
the samples were measured. The level of O2
and CO2 concentration maintained by
respiration of commodity and permeability of
packaging film is shown in Figure 4 for
treated pear and Figure 5 for untreated pear.
Under all the packaging treatments, initially, a
rapid decrease in O2 and a corresponding
increase in CO2 concentrations were observed
on the first day to the fifth day, which may be
attributed to the initial adjustment and high
respiratory behaviour of fruits in the transient
state of equilibrium as well as the
permeability of the packaging film. For both
the samples equilibrium of gases established
on fifth days of storage. The maximum
decrease in O2 was 2.5% in 96 h then slightly
increased and maintained equilibrium to
2.7%in 112 h. For CO2, maximum
concentration increase was 8.9% in 80 h and
then decreased and maintained equilibrium
to6.6% in 112 h depends on permeability.
Similarly, for untreated pear sample, the
maximum decrease in O2 was observed to be
3.4% in 144 hand maintained equilibrium to
2.4% in 144 hand for CO2maximum decreases
to 10.1% in 80 h and then decreased and
maintained equilibrium to 6.8% in 144 h
throughout the storage period.
Prediction of respiration rates based on
enzyme kinetics model
Multiple linear regression analysis was done
to obtain the parameters of enzyme kinetics
model such as Rm, Km, Ki. In equations (10)
and (11), dependent variables such as the rate
of respiration (Ry) or (Rz) were obtained from
equations (8) and (9), respectively. The
independent
variables
such
as
O2
concentration (y) and CO2 concentration (z)
were obtained through experiments as shown
in Figure 1. The model parameters of the
uncompetitive inhibition enzyme kinetics as
shown in equations (10) and (11) were
calculated from the coefficients of multiple
linear regression analysis. The model
parameters and coefficients of determination
(r2) for both the sample is shown in Table 3.
By using the model parameters and equations
(3) and (4), respiration rates for both the
sample predicted for different combinations
of O2 and CO2 concentrations as shown in
Figure 2 and 3. The mean relative deviation
moduli between predicted and those of
experimentally determined respiration rates
were found to be 3.31 % and 6.68% for O2
consumption and CO2 evolution respectively.
This suggests that the respiration rates
predicted by the enzyme-kinetic model at
In conclusion, the respiration rates were found
to decrease with storage time. The respiration
rate of fresh-cut pear was well described by a
Michaelis–Menten model. The effect of O2
and CO2 concentration on respiration rate was
found to fit well with the uncompetitive
inhibition enzyme kinetics for both the
sample. The mean relative deviation moduli
between
predicted
and
those
of
582
Int.J.Curr.Microbiol.App.Sci (2019) 8(4): 574-584
experimentally determined respiration rates
for treated were found to be 9.35 % and 6.96
% for O2 consumption and CO2 evolution for
untreated 8.77% and 9.53 % for O2
consumption and CO2 evolution respectively.
Based on the results of the investigation it
maybe concluded that polypropylene film can
be used to maintain the proper gaseous
composition inside modified atmospheric
packaging for both freshly cut-pear
chemically treated and untreated pear.The
model can successfully be used to develop a
modified atmosphere package.
cherry tomatoes. Food Microbiology,
23, 430-438.
Dong, X., Wrolstad, R. E., and Sugar, D.
(2000). Extending the shelf life of freshcut pears. Journal of Food Science,
65(1), 181-186.
Forcier, F., Raghavan, G.S.V., Gariepy,
Y.(1987). Electronic sensor for the
determination of fruit and vegetable
respiration. International Journal of
Refrigeration, 10, 353-356.
Gorny, J. R., Hess-Pierce, B., Cifuentes, R.
A., and Kader, A. A. (2002). Quality
changes in fresh-cut pear slices as
affected by controlled atmospheres and
chemical preservatives. Postharvest
Biology and Technology, 24(3), 271278.
Hagger, P.E., Lee, D. S., Yam, K. L. (1992).
Application of an Enzyme Kinetics
Based Respiration Model to Closed
System Experiments for Fresh Produce.
Journal of Food Process Engineering,
15, 143-157.
Halachmy, I.B., and C.H. Mannheim. (1991).
Modified Atmosphere Packaging of
Fresh
Mushrooms.
Packaging
Technology and Science, 4(5), 279-286.
Kang, J. S., and Lee, S. (1998). A kinetic
model for transpiration of fresh produce
in a controlled atmosphere. Journal of
Food Engineering, 35, 65-73.
Kays, S. J. (1991). Metabolic Processes in
Harvested Products Respiration. In Post
Harvest Physiology of Perishable Plant
Products, Kay, S. J. (Ed.), Van
Nostrand Reinhold Publication, New
York, 75-79.
Lee, D. S., Haggar, P. E., Lee, J., and Yam,
K. L. (1991). Model for fresh produce
respiration in modified atmospheres
based on principles of enzyme kinetics.
Journal of Food Science, 56(6), 15801585.
Mahajan, P. V. (2001). Studies on Control
atmosphere storage for apple and litchi
References
Aguayo, E., Jansasithorn, R., and Kader, A.
A. (2006). Combined effects of 1methylcyclopropene, calcium chloride
dip, and/or atmospheric modification on
quality
changes
in
fresh-cut
strawberries. Postharvest Biology and
Technology, 40 269-278.
Alandes, L., Hernando, I., Quiles, A., PerezMunuera, I., and Lluch, M. A. (2006).
Cell wall stability of fresh-cut Fuji
apples treated with calcium lactate.
Journal of Food Science, 71(9), 615620.
Amiot, M. J., Tacchini, M., Aubert, S. Y., and
Oleszek, W. (1995). Influence of
cultivar, maturity stage, and storage
conditions on phenolic composition and
enzymatic browning in pear fruits.
Journal of Agricultural and Food
Chemistry, 43, 1132-1137.
Arias, E., Gonzalez, J., Lopez-Buesa, P., and
Oria, R. (2008). Optimization of
processing of fresh-cut pear. Journal of
the Science of Food and Agriculture,
88(10), 1755-1763.
Das, E., Gurakan, G. C., and Bayindirli, A.
(2006). Effect of controlled atmosphere
storage, modified atmosphere packaging
and gaseous ozone treatment on the
survival of Salmonella Enteritidis on
583
Int.J.Curr.Microbiol.App.Sci (2019) 8(4): 574-584
using liquid nitrogen. PhD Thesis,
Department of Agriculture and Food
Engineering, Indian
Institute of
Technology, Kharagpur, India.
Mangaraj, S., Goswami, T. K., Giri, S. K.,
and Joshy, C. G. (2014). Design and
development of a modified atmosphere
packaging system for guava (cv.
Baruipur). Journal of Food Science and
Technology, 5(11), 2925-2946.
Mangaraj, S., andGoswami, T. K. (2011).
Measurement and modelling of the
respiration rate of guava (cv. Baruipur)
for modified atmosphere packaging.
International
Journal
of
Food
Properties, 14(3), 609-628.
McLaughlin, C. P., and O’Beirne, D. (1999).
Respiration rate of a dry coleslaw mix
as affected by storage temperature and
respiratory gas concentrations. Journal
of Food Science, 64, 116-119.
Nath, A., Deka, B. C., Singh, A., Patel, R.K.,
Paul, D., Misra, L.K., and Ojha, H.
(2012). Extension of the shelf life of
pear fruits using different packaging
materials. Journal of Food Science and
Technology,49(5), 556-563.
Oms-Oliu, G., Aguilo-Aguayo, I., and MartinBelloso, O. (2006). Inhibition of
browning on fresh-cut pear wedges by
natural compounds. Journal of Food
Science, 71(3), 216-224.
Parle, M., and Arzoo. (2016). Why is pear so
dear. International Journal of Research
in Ayurveda and Pharmacy, 7(1), 108113.
Rocculi, P., Romani, S., and Rosa, M. D.
(2004). Evaluation of physicochemical
parameters of minimally processed
apples packed in non-conventional
modified atmosphere. Food Research
International,37(4), 329-335.
Reiland, H., and Slavin, J. (2015). Systematic
Review of Pears and Health. Nutrition
Today,50(6), 301-305.
Sapers, G.M., andMiller, R. L. (1998).
Browning inhibition in fresh-cut
pears.Journal of Food Science, 63(2),
342-346.
Sivakumar, D., and Korsten, L. (2006).
Influence of modified atmosphere
packaging and postharvest treatments
on quality retention of litchi cv.
Mauritius. Postharvest Biology and
Technology, 41(2), 135-142.
Soliva-Fortuny, R.C., Biosca-Biosca, M.,
Grigelmo-Miguel, N., and MartinBelloso,
O.(2002)
Browning,
polyphenol oxidase activity and
headspace gas composition during
storage of minimally processed pears
using modified atmosphere packaging.
Journal of the Science of Food and
Agriculture, 82(13), 1490-1496.
Velmurugan, C., and Bhargava, A. (2013).
Anti-Diabetic
and
hypolipidemic
activity of fruit of Pyrus communis L. in
hyperglycaemic rats. Asian Journal of
Pharmaceutical and Clinical Research,
6, 108-111.
Vilas-Boas, E. V. de B., and Kader, A. A.
(2006).
Effect
of
atmospheric
modification, 1-MCP and chemicals on
quality of fresh-cut banana. Postharvest
Biology and Technology, 39, 155-162.
How to cite this article:
Ram Prakash Kumar and Goswami, T.K. 2019. Modelling the Respiration Rate of Fresh-Cut
Pear (Pyrus communis L.) Packaged in Modified Atmosphere. Int.J.Curr.Microbiol.App.Sci.
8(04): 574-584. doi: />
584