Genetic analysis of egg production and allied characters in two long term selected strains of white Leghorn
Bạn đang xem bản rút gọn của tài liệu. Xem và tải ngay bản đầy đủ của tài liệu tại đây (308.63 KB, 10 trang )
Int.J.Curr.Microbiol.App.Sci (2019) 8(3): 1669-1678
International Journal of Current Microbiology and Applied Sciences
ISSN: 2319-7706 Volume 8 Number 03 (2019)
Journal homepage:
Original Research Article
/>
Genetic Analysis of Egg Production and Allied Characters in Two Long
Term Selected Strains of White Leghorn
R.R. Churchil*, Lijo John, Binoj Chacko, P. Ezhil Praveena and P. Anitha
All India Co-ordinated Research Project on Poultry, Kerala Veterinary and Animal Sciences
University, Mannuthy, Thrissur-680 651, Kerala, India
*Corresponding author
ABSTRACT
Keywords
Egg Production,
Genetic Parameters,
White Leghorn
Article Info
Accepted:
12 February 2019
Available Online:
10 March 2019
The genetic parameters like population mean and genetic and phenotypic correlations were
analyzed from IWN and IWP strains of White Leghorn, which were selectively bred for
egg production for 23 generations. The traits analyzed were hen housed egg number up to
40 (EN40) and 64 (EN64) weeks of age, age at first egg (AFE), body weights at 16
(BW16), 40 (BW40) and 64 (BW64) weeks of age and egg weights at 28 (EW28), 40
(EW40) and 64 (EN64) weeks of age in 23 rd selected generation (S23). The mean values
for different traits in IWN and IWP strains respectively were 110.67 and 105.64 eggs for
EN40, 248.27 and 234.46 eggs for EN64, 154.24 and 152.65 days for AFE, 1064.48 and
1024.67g for BW16, 1560.47 and 1587.34g for BW40, 1547.13 and 1628.28g for BW64,
51.12 and 50.37g for EW28, 54.54 and 55.04g for EW40 and 59.46 and 60.38g for EW64.
Moderate to high heritability estimates were recorded for EN40 (0.284), EN64 (0.182),
AFE (0.349), BW16 (0.488), BW40 (0.388), BW64 (0.284), EW28 (0.375) EW40 (0.447)
and EW64 (0.390) in IWN strain. Barring AFE which exhibited low magnitude (0.090),
other traits like EN40 (0.239), EN64 (0.220), BW16 (0.318), BW40 (0.285), BW64
(0.242), EW28 (0.460) EW40 (0.491) and EW64 (0.505) showed moderate to high
magnitude of heritability in IWP strain. Estimated genetic correlations of EN64, the
primary trait of selection with other related traits viz., EN40, AFE, BW16, BW40, BW64,
EW28, EW40 and EW64 were 0.824, -0.497, -0.234, -0.070, -0.094, -0.293, -0.455 and 0.274 respectively for IWN strain and the corresponding figures for IWP strain were
0.944, -0.516, -0.030, -0.061, -0.092, 0.006, -0.073 and 0.0. From the heritability estimates
for egg number it can be conclude that the good amount of additive genetic variance for
egg production can exist in White Leghorn populations undergoing selection for long
period for more than 20 generations.
Introduction
The genetic parameters of a population are
required not only for predictions of responses,
but also used as a base for the future selection
and breeding strategies. In poultry breeding
programmes, selection plays major role for
the improvement of egg production
performances of the flock. Pureline selection
is the most commonly employed breeding
technique for the production of commercial
layers (Cole and Hutt, 1973). Dryden (1921)
1669
Int.J.Curr.Microbiol.App.Sci (2019) 8(3): 1669-1678
was among the first workers to demonstrate
substantial improvement in egg production
due to selection, selecting females on their
own individual records and males on the
performance of their dams. Selection for partor whole-record egg number or laying rate is
a usual approach for improving egg
production, which has been shown to yield
positive genetic progress, as reviewed by
Fairfull and Gowe (1990).
Selection greatly alters the properties of a
population. The heritabilities and the genetic
correlations are expected to change in a
population after selection (Falconer, 1989).
These estimates from selected strains are
generally lower than those from unselected
strains.
Results of long term studies can provide
valuable information for scientific community
and commercial breeders as well. Although
there is considerable literature on genetic
parameters of various economic traits in
White Leghorn for a specific short or medium
period or pooled over few generations of
study (Johari et al., 1988; Chaudhary et al.,
1996; Sharma et al., 1996), there is, a dearth
of information on genetic estimates from
populations which were undergone selection
for a long period. Moreover, heritability
estimates for part-period egg production upto
40 weeks of age is commonly reported but
one calculated for full-record egg production
is scarce.
Therefore the aim of the present study was to
estimate heritability and genetic correlations
from IWN and IWP strains of single comb
White Leghorn populations selectively bred
for full record egg production by pure line
selection using Osborne’s index (Osborne,
1957b) for more than three decades since
1975 at All India Co-ordinated Research
Project on Poultry, Mannuthy, Thrissur,
Kerala, India.
Materials and Methods
Genetic stock and data
The hatching eggs of base populations of
IWN and IWP strains of White Leghorn were
supplied by the Indian Council of Agricultural
Research in the year 1978. These populations
were selectively bred for egg production
based on part-record egg production up to 40
weeks until 16th generation. The testing period
was then enhanced upto 60 weeks (17th
generation) to 64 weeks (18th through 23rd
generation).
Intra-population
combined
selection using an index (Osborne, 1957a, b)
was practiced. Pressure for egg weight was
included in the selection programme from
third generation as an independent culling
level. Initially these populations were
reproduced utilizing 40 sires and 240 dams
(1:6) until 13th generation. The sire and dam
bases were then modified to 50 and 400
respectively (1:8) in 14th generation, then to
50 and 300 (1:6) in 15th through 23rd
generation. In order to keep inbreeding low,
full-sib and half-sib matings were avoided. A
random bred control population was
maintained along with the selected
populations.
The summary of selection records of parent
generation is given in Table 1. Fifty sires and
300 dams were used to produce S23
generation. All the sires but only 298 dams of
IWN and 296 dams of IWP contributed the
new generation. The selection intensity in
producing new generation was 0.496 and
0.358 respectively in IWN and IWP
respectively. The data was obtained from
2000 and 2014 pedigreed hens of IWN and
IWP strains respectively, spread in four
hatches taken at ten days interval. The hens
were housed at the start of 17th week,
distributed
randomly
in
double-deck
individual Californian cages and maintained
till to the end of the study to facilitate
individual data collection.
1670
Int.J.Curr.Microbiol.App.Sci (2019) 8(3): 1669-1678
Traits studied
The following traits were measured from
these populations:
1) Hen housed egg production (HHEP) up to
40 (EN40) and 64 (EN64) weeks of age
was recorded on individual basis as
cumulative numbers.
2) Age at First Egg (AFE) was recorded as
the age of the pullet in days when she laid
her first egg.
3) Mature (BW16), adult (BW40) and final
(BW64) body weights were recorded
individually at 16, 40 and 64 weeks of age
respectively to the nearest 5g.
4) Egg weight at 28 (EW28), 40 (EW40) and
64 (EW64) weeks, and of age obtained as
mean egg weight of four consecutive eggs
recorded to the accuracy of one tenth of a
gram.
Genetic Analysis
The data was corrected for hatch effect using
least square analysis of variance by fitting
least square constants within strain as per
Harvey (1966). Using the hatch-corrected
data, the heritability, phenotypic and genetic
correlations were estimated as per Falconer
(1989). The significance of mean difference
between the strains was determined by
Student’s t-test (Snedecor and Cochran,
1989).
Results and Discussion
Descriptive statistics of traits
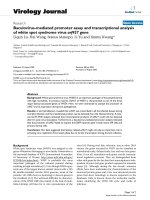
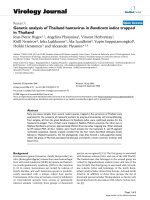
The frequency distribution of EN64, primary
trait of this selection experiment revealed a
high frequency of 0.35 of IWN and 0.34 of
IWP observations falling in the class interval
of 241 to 260 eggs (Fig. 1).
The mean values, their standard deviations
and minimum and maximum values of
different traits are given in Table 2. The hatch
effect was significant for all the traits except
EN40 and AFE in both the populations.
Significant
(P≤0.001)
difference
was
observed for mean values of all the traits
between IWP and IWN strains. IWN strain
had significantly (P<0.001) higher EN40
(110.67 Vs 105.64) and EN64 (248.27 Vs
234.46), even though it matured later
compared to IWP (154.24 Vs152.65d).
Similar values for 40th (Devi and Reddy,
2005; Joshi et al., 2005) and 64th (Devi and
Reddy, 2005) week egg production in White
Leghorn populations have been reported
earlier. Singh et al., (2009) has reported strain
difference for egg production in White
Leghorn similar to the findings of the present
study. The average AFE reported in White
Leghorn breed was much higher in earlier
reports ranging from 150 to 193.21 (Ahlawat
et al., 1982; Chaudhary et al., 1996) barring
138.2 days reported recently by Savegnago et
al., (2011).
The mature body weight (BW16) was
significantly (P<0.001) high, although the
adult and final body weights (BW40 and
BW64) were significantly (P<0.001) low in
IWN. Similar trend was reflected in egg
weights also with significantly (P<0.001)
higher EW28 and significantly (P<0.001)
lower EW40 and EW64 in IWN compared to
IWP. BW16 in the present investigation were
higher than that reported by Ahlawat et al.,
(1982).
Similarly, BW40 observed in this study was
higher than those reported by earlier workers
in White Leghorn (Chaudhary et al., 1996;
Devi and Reddy, 2005). BW64 of both strains
was comparatively lower than the 62 weeks
body weight reported by Savegnago et al.,
(2011). Egg weights of similar magnitude
have been reported earlier in IWD and IWF
strains of White Leghorn at 40 weeks of age
by Devi and Reddy (2005).
1671
Int.J.Curr.Microbiol.App.Sci (2019) 8(3): 1669-1678
Heritability estimates
Moderate heritability was estimated for EN40
(0.284) and EN64 (0.182) in IWN (Table 3)
and IWP (0.239 and 0.220 respectively)
(Table 4). This was in conformity with the
previously published estimates (Singh and
Singh, 2005; Joshi et al., 2005). The
heritability values decreased with increasing
age in both the strains contrary to the earlier
findings (Ferreira et al., 2017). The low
magnitude of heritability may be due to the
fact that EN being a fitness trait that will
express low heritability. Continued selection
for egg production during last three decades
has resulted in the genetic variation in this
trait.
The magnitude of heritability for AFE was
high (0.349) in IWN strain compared to IWP
(0.09). The heritability estimates for AFE
observed in the present study was in
agreement with those reported by Ahlawat et
al., (1982), Johari et al., (1988), Sharma et
al., (1996) and Singh and Singh (2005) but
lower than the report of Savegnago et al.,
(2011).
The genetic analysis revealed that the body
weights at different ages were moderate to
highly heritable in IWN strain with a
decreasing trend with age (0.488, 0.388 and
0.284 for BW16, BW40 and BW64
respectively). Similar decreasing trend (0.318,
0.285 and 0.242) was evident in IWP strain
also. This may be due to the fact that the
growth traits are well expressed at faster rate
of growth, which minimize effects of
environmental factors compared to later age.
Moderate to high heritability estimated for
body weights at various ages obtained in this
study were in conformity with the reports of
Johari et al., (1988); Sharma et al., (1996) and
Singh and Singh (2005) but lower than an
estimate of 0.68 for 54 week body weight
reported by Savegnago et al., (2011).
The heritability estimates for egg weights at
different ages (EW28, EW40 and EW64)
ranged from 0.375 to 0.447 in IWN and from
0.460 to 0.505 in IWP strain registering a
higher degree of additive genetic action.
These results were in agreement with those of
Chaudhary et al., (1996), Sharma et al.,
(1996) and Singh and Singh (2005). The
standard errors of all the heritability estimates
were of less magnitude implying a reasonably
high degree of reliance on these estimates.
Genetic and phenotypic correlations
A very high positive genetic correlation of
0.824 in IWN (Table 3) and 0.944 in IWP
(Table 4) has existed between BW40 and
BW64. The positive correlations between egg
production of two periods were in conformity
with the report of Joshi et al., (2005). A
positive genetic correlation of very high
magnitude between EN40 and EN64 in IWP
reveals a possibility of resorting selection
based on 40 week egg production in this
strain for attaining maximum genetic
improvement per unit time.
In general, the egg production (EN40 and
EN64) are negatively associated with AFE on
both phenotypic as well as genetic scale. A
high degree of negative correlation between
EN40 and AFE (-0.832 and -0.835 in IWN
and IWP respectively) and EN64 and AFE (0.497 and -0.516) was recorded. The
magnitude was fond to be age dependent with
strong association in early age (BW40). The
magnitude and direction were similar to the
findings of Poggenpoel et al., (1996) and
Sharma et al., (1996) in White Leghorn.
The correlation between egg number and
body weights on both genetic and phenotypic
scale from this study was weak and lacked
any particular direction. The results clearly
revealed that the genetic correlation between
EN40 and egg weights (EW28, EW40 and
1672
Int.J.Curr.Microbiol.App.Sci (2019) 8(3): 1669-1678
EW64) in IWN was in negative direction with
values ranging from -0.235 to -0.448.
Similarly genetic correlation between EN64
and egg weights was also in negative
direction with similar magnitude (-0.274 to
0.455). However, IWP showed low degree of
genetic correlation with inconsistent sign
between these two traits. The negative genetic
correlation between EN and EW in IWN
agreed in sign with those reported by several,
for example Johari et al., (1988) and Joshi et
al.(2005). The relationship between EW and
EN seemed to be near neutral in IWP unlike
common rule of strong negative correlation.
Therefore the practice of superimposing egg
weight as independent culling level in the
selection programme can be discarded for
some time to get more genetic gain to match
the mean of IWN in terms of egg production.
The estimates of genetic and phenotypic
correlations between AFE and body weights
obtained in this study, were in general, low in
magnitude but did not carry any constant sign.
Poggenpoel et al., (1996) reported positive
genetic correlation of very low magnitude
(0.1) between AFE and BW. On the other
hand, the estimates from a strain of White
Leghorn reported by Narwal et al., (2005)
were negative in direction.
The estimates of genetic and phenotypic
correlation between AFE and egg weight at
different ages (EW28, EW40 and EW64) in
IWN were of low to medium degree in
negative direction (-0.109 to -0.370). In
contrast, it was found to be positive with low
magnitude (0.005 to 0.232) in IWP.
Bodyweights (BW16, BW40 and BW64)
among themselves and egg weights among
themselves (EW28, EW40 and EW64)
showed positive correlation of medium to
high magnitude. However the association
between body weights and egg weights
revealed a general consent of positive
association of low to medium magnitude in
these two populations. The positive genetic
association between and within egg weights
and body weights was in conformity with the
reports of Poggenpoel et al., (1996), Narwal
et al., (2005). It can be concluded that these
characters are evidently controlled by both
independent and pleiotropic genes.
Table.1 Summary of selection records of parents
Sl. No.
1
2
3
4
5
6
7
8
9
10
11
12
13
Particulars
No. of sires used
No. of dams used
No. of sires contributed
No. of dams contributed
Effective number
Rate of inbreeding
Expected selection differential for males
Expected selection differential for females
Average selection differential
Effective Selection differential for males
Effective Selection differential for females
Average Effective selection differential
Selection intensity
1673
Strains
IWN
50
300
50
298
171.26
0.002919
12.252
18.110
15.181
12.400
17.823
15.112
0.496
IWP
50
300
50
296
171.10
0.002922
17.335
19.278
18.306
17.241
16.794
17.018
0.358
Int.J.Curr.Microbiol.App.Sci (2019) 8(3): 1669-1678
Table.2 Means, standard deviations and minimum and maximum values of different traits
Traits (units)
EN40 (no.s)
EN64 (no.s)
AFE (days)
BW16 (g)
BW40 (g)
BW64 (g)
EW28 (g)
EW40 (g)
EW64 (g)
IWN
n
Mean
SD
2000
2000
1967
2000
1965
1919
1919
1870
1879
110.67x
248.27 x
154.24 x
1064.48 x
1560.47 y
1547.13 y
51.12 x
54.54 y
59.46 y
18.37
39.39
10.81
106.32
161.63
206.46
2.89
3.41
3.83
Minimum
6
11
131
700
925
1030
40.2
41.8
43.4
Maximum
140
300
208
1355
2355
2820
62.8
67.9
74.7
Hatch
Effect
NS
*
NS
**
***
*
***
***
**
IWP
n
Mean
SD
2014
2014
1967
2014
1941
1860
1795
1821
1743
105.64y
234.46 y
152.65 y
1024.67 y
1587.34 x
1628.28 x
50.37 y
55.04 x
60.38 x
28.37
59.39
12.09
100.59
165.26
222.93
3.34
3.89
4.31
Minimum
3
9
130
785
960
1340
39.2
41.8
43.3
Maximum
143
292
259
1350
2610
2780
62.6
61.3
79.3
Hatch
Effect
NS
*
NS
***
***
**
***
***
***
- Means with different superscripts within a row are significantly (P≤0.001) different; NS - Not significant;* P≤0.05; **P≤0.01;
***P≤0.001
x,y
Table.3 Estimates of heritabilities (diagonal), genetic (above the diagonal), and phenotypic (below the diagonal) correlations with
their standard errors (in parenthesis) of different traits for IWN strain
Traits
EN40
EN64
AFE
BW16
BW40
BW64
EW28
EW40
EW64
EN40
0.284
(0.045)
0.783
(0.01)
-0.667
(0.02)
0.148
(0.02)
-0.104
(0.02)
-0.363
(0.02)
-0.084
(0.02)
-0.180
(0.02)
-0.091
(0.02)
EN64
0.824
(0.045)
0.182
(0.037)
-0.417
(0.020)
0.053
(0.02)
-0.237
(0.02)
-0.154
(0.02)
-0.073
(0.02)
-0.150
(0.02)
-0.118
(0.02)
AFE
-0.832
(0.115)
-0.497
(0.141)
0.349
(0.048)
-0.223
(0.02)
-0.106
(0.02)
-0.039
(0.02)
0.095
(0.02)
0.053
(0.02)
-0.004
(0.02)
BW16
0.219
(0.112)
-0.234
(0.125)
-0.276
(0.109
0.488
(0.054)
0.083
(0.02)
0.418
(0.02)
0.172
(0.02)
0.236
(0.02)
0.205
(0.02)
BW40
-0.054
(0.116)
-0.070
(0.132)
-0.013
(0.011)
0.743
(0.056)
0.388
(0.051)
0.707
(0.02)
0.268
(0.02)
0.307
(0.02)
0.267
(0.02)
1674
BW64
0.033
(0.126)
-0.094
(0.140)
-0.126
(0.118)
0.691
(0.070)
0.888
(0.033)
0.284
(0.045)
0.205
(0.02)
0.234
(0.02)
0.305
(0.02)
EW28
-0.388
(0.107)
-0.293
(0.122)
-0.370
(0.100)
0.159
(0.107)
0.282
(0.101)
0.275
(0.112)
0.375
(0.050)
0.581
(0.02)
0.502
(0.02)
EW40
-0.448
(0.109)
-0.455
(0.120)
-0.186
(0.108)
0.222
(0.103)
0.370
(0.095)
0.327
(0.106)
0.833
(0.043)
0.447
(0.054)
0.601
(0.02)
EW64
-0.235
(0.116)
-0.274
(0.126)
-0.109
(0.113)
0.205
(0.106)
0.386
(0.097)
0.441
(0.098)
0.669
(0.067)
0.862
(0.038)
0.390
(0.051)
Int.J.Curr.Microbiol.App.Sci (2019) 8(3): 1669-1678
Table.4 Estimates of heritabilities (diagonal), genetic (above the diagonal), and phenotypic
(below the diagonal) correlations with their standard errors (in parenthesis) of different traits for
IWP strain
Traits EN40
EN40 0.239
(0.043)
EN64 0.796
(0.01)
-0.480
AFE
(0.02)
BW16 0.093
(0.02)
BW40 -0.051
(0.02)
BW64 -0.051
(0.02)
EW28 0.029
(0.02)
EW40 -0.071
(0.02)
EW64 0.017
(0.02)
EN64
0.944
(0.027)
0.220
(0.041)
-0.308
(0.02)
0.027
(0.02)
-0.174
(0.02)
-0.091
(0.02)
0.013
(0.02)
-0.053
(0.02)
0.010
(0.02)
AFE
-0.835
(0.197)
-0.516
(0.200)
0.090
(0.029)
-0.187
(0.02)
0.071
(0.02)
0.002
(0.02)
0.015
(0.02)
0.053
(0.02)
0.032
(0.02)
BW16
0.090
(0.135)
-0.030
(0.138)
-0.225
(0.180)
0.318
(0.047)
0.353
(0.02)
0.336
(0.02)
0.136
(0.02)
0.108
(0.02)
0.086
(0.02)
BW40
-0.048
(0.130)
-0.061
(0.134)
0.270
(0.166)
0.420
(0.107)
0.285
(0.045)
0.701
(0.02)
0.140
(0.02)
0.135
(0.02)
0.120
(0.02)
BW64
-0.048
(0.130)
-0.092
(0.131)
0.104
(0.169)
0.407
(0.106)
0.906
(0.034)
0.242
(0.043)
0.092
(0.02)
0.096
(0.02)
0.135
(0.02)
EW28
-0.063
(0.117)
0.006
(0.126)
0.005
(0.118)
0.357
(0.109)
0.219
(0.110)
0.063
(0.116)
0.460
(0.056)
0.548
(0.02)
0.545
(0.02)
EW40
-0.016
(0.124)
-0.073
(0.124)
0.206
(0.154)
0.339
(0.107)
0.425
(0.096)
0.258
(0.108)
0.892
(0.036)
0.491
(0.057)
0.598
(0.02)
Table.5 Response to selection in primary and associated traits
Traits
Phenotypic
response
Genetic response
IWN
IWP
IWN
IWP
BW16
-57.7
-111
31.53
-21.76
BW40
-57.8
-102
56.7
12.94
BW64
-26.10
-22.76
179.64
182.98
ASM
15.99
17.03
12.89
13.93
EW28
0.87
0.07
0.9
0.1
EW40
1.11
1.57
0.92
1.38
EW64
4.91
6.73
2.5
4.32
EN40(Hen
housed)
-7.2
-8.15
-8.79
-9.74
EN64(Hen
housed)
3.38
3.47
-0.38
-0.29
1675
EW64
0.075
(0.126)
0.000
(0.123)
0.232
(0.152)
0.327
(0.109)
0.370
(0.103)
0.244
(0.106)
0.875
(0.038)
0.940
(0.026)
0.505
(0.058)
Int.J.Curr.Microbiol.App.Sci (2019) 8(3): 1669-1678
Fig.1 Frequency distribution of egg production upto 64 weeks of age
Response to selection
The EN64 (hen housed) registered an
improvement of 3.38 and 3.47 eggs in IWN
and IWP respectively on phenotypic scale
(Table 5). However, the response was slightly
on negative side on genetic scale. Egg weight,
another important economic trait in general
had a positive shift on both phenotypic and
genetic scale. Other traits however had
inconsistent trends. Venkatramaiah et al.,
(1986) have reported a genetic response of
2.16 eggs per generation in White Leghorn.
The heritability estimates for egg production
in both the populations revealed that
substantial amount of genetic variation can
exist in White Leghorn even after very long
term selection experiments for full record egg
production (EN64). It may also be concluded
that genetic correlation between EN40 and
EN64 in IWN strain was such that selection
for EN40 would allow improvement in EN64
without seriously compromising the selection
objective of the breeding programme. The
genetic properties of IWP reveal the
possibility
for
discontinuation
of
1676
Int.J.Curr.Microbiol.App.Sci (2019) 8(3): 1669-1678
superimposing egg weight as independent
culling level in breeding programme for
augmenting genetic gain in egg number which
is a low producing strain. Examination of the
genetic properties of two populations, IWP
strain by virtue of early sexual maturity and
higher egg weights can serve well as male
line and IWN as dam line for producing
hybrid crosses.
References
Ahlawat, S. P. S., Chaudhary, R.P. and Singh,
B. P. (1982).Estimates of genetic
parameters for high egg number in a
combined selection programme of
white Leghorn. Indian Vet. J., 59:
799-805.
Chaudhary, M. L., Brah, G. S. and Sandhu, J.
S., (1996). Genetic inferences from
comparison of pure- and cross-line
White Leghorns. Indian J. Poult. Sc.,
32: 28-32.
Cole, R. F. and Hutt, F. B. (1973). Selection
and heterosis in Cornell White
Leghorn: A review with special
consideration of inter strain hybrids.
Animal Breeding Abstracts, 41: 10318.
Devi K S and Reddy P M. (2005). Genetic
studies on certain economic traits in
White Leghorn and cross-bred
chicken. Indian J. Poult. Sci., 40: 5658.
Dryden, J. (1921). Egg-laying characteristics
of the hen. Oregon Agric. Exp. Sta.
Bull.,180.
Fairfull, R. W. and Gowe, R. S. (1990).
Genetics of egg production. In:
Poultry Breeding and Genetics.
Elsevier, Amsterdam, pp 705–759.
Falconer, D. S. (1989). Introduction to
Quantitative Genetics, 3rd Ed.,
Longman Group, UK Ltd., London.
Ferreira, P. B., Rorato, P. R. N., Breda, F. C.,
Michelotti, V. T., Rosa, Alexandre P.
and Macedo, A. (2017). Genotypic
parameters for egg production in pure
breed hens by using random
regression model. Ciência Rural., 47:
1 – 7.
Harvey, W. R. (1966). Least square analysis
of data with unequal subclass number.
USDA, ARS; 20:8.
Johari, D. C., Dey, B. R., Kataria, M. C.,
Ayyagari, V., Mohapatra, S. C. and
Gopal, R. (1988). Genetic variation
and covariation of production traits in
White Leghorn selected for part record
egg production. Indian J. Poult. Sci.,
23:40-46.
Joshi, R. S., Barot, V. N., Patel, A. B.,
Savalia, F. P., Mishra, R. K., Paleja,
H. I. and Khanna, K. (2005). A
genetic study on egg production traits
in two strains of white Leghorn.
Proceedings of XXIII conference of
Indian Poultry Science Association
(IPSACON) – Vol.II., Hyderabad,
India.
Narwal, S., Malik, C. P., Raheja, K. L. and
Kalra, S. (2005). Genetic studies on
performance traits of egg type
chickens. Proceedings of XXIII
conference of Indian Poultry Science
Association (IPSACON) - Vol. II.,
Hyderabad, India.
Nordskog, A. W. and Briggs, D. M. (1968).
The body weight egg production
paradox. Poult. Sci., 47:498–504.
Osborne, R. (1957a). The use of sire and dam
family averages in increasing the
efficiency of selective breeding under
a
hierarchical
mating
system.
Heredity, 11: 93-116.
Osborne, R. (1957b). Family selection in
poultry. The use of sire and dam
family averages in choosing male
parents. Proceedings of Royal Society,
Edinburgh, 66: 374-393.
Poggenpoel, D. G., Ferreira, G. F., Hayes, J.
P. and duPreez, J.J. (1996). Response
1677
Int.J.Curr.Microbiol.App.Sci (2019) 8(3): 1669-1678
to long-term selection for egg
production in laying hens. Br. Poult.
Sci., 37: 743-756.
Savegnago, R. P., Caetano, S. L., Ramos, S.
B., Nasciment, G. B., Schmidt, G. S.,
Ledur, M. C. and Munari, D. P.
(2011).
Estimates
of
genetic
parameters, and cluster and principal
components analyses of breeding
values related to egg production traits
in a White Leghorn population, Poult.
Sci., 90: 2174–2188.
Sharma, D., Johari, D. C., Kataria, M. C.,
Singh, B. P., Singh, D. P. and Hazary,
R. C. (1996). Effect of long term
selection on genetic parameters of
economic traits in White Leghorn.
Asian-Australas J. Anim. Sci.,9: 455459.
Singh, N. and Singh, R. P. (2005). Heritability
estimates of performance traits in
purebred and crossbred egg type
chicken. Indian J. Poult. Sci., 40: 5255.
Singh, R., Cheng, K. M. and Silversides, F. G.
(2009). Production performance and
egg quality of four strains of laying
hens kept in conventional cages and
floor pens. Poult. Sci., 88: 256–264.
Snedecor, G. W. and Cochran, W. G. (1989).
Statistical Methods, Eighth Edition,
Iowa State University Press.
Venkatramaiah, A., Mohapatra, S. C., Sinha,
R., Ayyagari, V. and Chaudhuri, D.
(1986). Selection response for part
period egg number and egg mass in
chicks – a comparison. Theor.Appl.
Genet., 72: 129 – 134.
How to cite this article:
Churchil, R.R., Lijo John, Binoj Chacko, P. Ezhil Praveena and Anitha, P. 2019. Genetic
Analysis of Egg Production and Allied Characters in Two Long Term Selected Strains of
White Leghorn. Int.J.Curr.Microbiol.App.Sci. 8(03): 1669-1678.
doi: />
1678