A preliminary study of movement intensity during a Go/No-Go task and its association with ADHD outcomes and symptom severity
Bạn đang xem bản rút gọn của tài liệu. Xem và tải ngay bản đầy đủ của tài liệu tại đây (1.04 MB, 10 trang )
Li et al. Child Adolesc Psychiatry Ment Health (2016) 10:47
DOI 10.1186/s13034-016-0135-2
RESEARCH ARTICLE
Child and Adolescent Psychiatry
and Mental Health
Open Access
A preliminary study of movement
intensity during a Go/No‑Go task and its
association with ADHD outcomes and symptom
severity
Fenghua Li1,7†, Yi Zheng2†, Stephanie D. Smith3,4, Frederick Shic8, Christina C. Moore3,5, Xixi Zheng6, Yanjie Qi2,
Zhengkui Liu1* and James F. Leckman3*
Abstract
Objective: At present, there are no well-validated biomarkers for attention-deficit/hyperactivity disorder (ADHD). The
present study used an infrared motion tracking system to monitor and record the movement intensity of children and
to determine its diagnostic precision for ADHD and its possible associations with ratings of ADHD symptom severity.
Methods: A Microsoft motion sensing camera recorded the movement of children during a modified Go/No-Go
Task. Movement intensity measures extracted from these data included a composite measure of total movement
intensity (TMI measure) and a movement intensity distribution (MID measure) measure across 15 frequency bands (FB
measures). In phase 1 of the study, 30 children diagnosed with ADHD or at subthreshold for ADHD and 30 matched
healthy controls were compared to determine if measures of movement intensity successfully distinguished children
with ADHD from healthy control children. In phase 2, associations between measures of movement intensity and
clinician-rated ADHD symptom severity (Clinical Global Impression Scale [CGI] and the ADHD-Rating Scale IV [ADHDRS]) were examined in a subset of children with ADHD (n = 14) from the phase I sample.
Results: Both measures of movement intensity were able to distinguish children with ADHD from healthy controls.
However, only the measures linked to the 15 pre-determined 1 Hz frequency bands were significantly correlated with
both the CGI scores and ADHD-RS total scores.
Conclusions: Preliminary findings suggest that measures of movement intensity, particularly measures linked to the
10–11 and 12–13 Hz frequency bands, have the potential to become valid biomarkers for ADHD.
Keywords: ADHD, Infrared motion tracking system, Microsoft Kinect, Movement intensity, Frequency bands,
Biomarker
Background
Attention-deficit/hyperactivity disorder (ADHD) is
a neurodevelopmental disorder, with an estimated
*Correspondence: ;
†
Li Fenghua and Zheng Yi are Joint first authors
1
Key Lab of Mental Health, Institute of Psychology, Chinese Academy
of Sciences, 218 South Block, #16 Lincui Road, Chaoyang District,
Beijing 100101, People’s Republic of China
3
Child Study Center, Yale University School of Medicine, I‑265 SHM, 230
South Frontage Road, New Haven, CT 06520‑7900, USA
Full list of author information is available at the end of the article
prevalence rate of 5.3% worldwide [1]. In the diagnostic
and statistical manual of mental disorders 5th edition
(DSM 5), ADHD consists of three distinct presentations:
inattentive type, hyperactive-impulsive type, and combined type [2]. Multiple methods have been used to diagnose and assess ADHD and its presentations in children,
including clinical interviews, symptom rating scales,
behavioral observations, and neuropsychological assessments. However, some of these methods are quite subjective as they rely on parent, teacher, and clinician ratings
of ADHD symptom severity. It has been suggested that
© The Author(s) 2016. This article is distributed under the terms of the Creative Commons Attribution 4.0 International License
( which permits unrestricted use, distribution, and reproduction in any medium,
provided you give appropriate credit to the original author(s) and the source, provide a link to the Creative Commons license,
and indicate if changes were made. The Creative Commons Public Domain Dedication waiver ( />publicdomain/zero/1.0/) applies to the data made available in this article, unless otherwise stated.
Li et al. Child Adolesc Psychiatry Ment Health (2016) 10:47
relying on only one of these traditional assessment procedures and not taking a multi-informant, multi-method
approach while assessing children’s functioning across
multiple settings, which is currently considered the “gold
standard” of diagnostic assessment, may contribute to
the over-labeling of children with ADHD, the global rise
of ADHD diagnoses in recent years, and the surge in prescribing stimulant medication [3, 4]. However, the sole
use of ADHD symptom checklists to make diagnostic
decisions is not surprising given the “gold standard” can
be both costly and time consuming.
As a result, researchers have become increasingly interested in identifying objective assessment procedures for
ADHD that are comparable to the “gold standard” and
are more likely to put into practice by clinicians. One
approach that has gained traction in recent years is the
use of motor tracking systems during neuropsychological tasks of attention and response inhibition. Examples
include the use of infrared motion tracking systems that
record the vertical and horizontal position of reflectors
while children complete a continuous performance task
[5–13], or actigraphs/accelerometers (i.e., an acceleration
sensor that measures the acceleration of specific body
regions) that monitor gross motor activity of children by
having them wear sensors on specified locations of their
body (e.g., wrist, waist) [14–18]. Martín-Martínez et al.
[19] were able to identify children with ADHD combined
type by means of a nonlinear analysis of 24-h-long actigraphic registries. Although this method of classification achieved adequate to good precision (Area Under
receiver operating characteristic Curve [AUC] values
between 0.812 and 0.891), it required an entire 24-h
interval of actigraphic data to reach practical diagnostic capabilities. The need for this amount of movement
data to make accurate diagnostic predictions is perhaps
not surprising, as the actigraph only captures movement
as generated by one or two locations on the body rather
than simultaneously capturing movements of the entire
body. Although currently available actigraph devices can
(and do) record temporal or spatial information (e.g.,
[14], this information has typically been lost in prior
studies of children with ADHD due to the way the data
were handled and analyzed.
In contrast, infrared motion tracking systems have
been previously shown to discriminate boys with ADHD
from healthy controls; to correlate with teachers’ ADHD
symptom severity ratings and measures of treatment
response; and to identify medication doses that produce the best overall clinical results [7, 12, 20, 21]. The
data acquired from infrared motion tracking systems are
time-locked and able to record the path of movement
(i.e., linear versus complex movement patterns); however,
methods for integrating movement data across sensors
Page 2 of 10
have yet to be developed or reported (instead data from
each sensor is reported separately), which potentially
limits the precision of these data. In fact, a discrimination
analysis of the complexity of head movements did less
well in correctly identifying children with ADHD inattentive type from healthy controls (75% of cases correctly
classified) than it did with other ADHD presentations.
Moreover, head movement data did not significantly
correlate with parent ratings of ADHD symptom severity [9]. At this time, no known studies have examined the
relationship between body movement data as captured
by infrared tracking systems and hyperactive/impulsive
versus inattentive symptoms. If whole body movements
are simultaneously tracked and integrated, such a measure may be sensitive enough to align with severity ratings
of inattention since more movement is expected as attention diminishes.
The present study is the first to extract movement
intensity measures from recordings of whole body movements and to examine whether these measures might
be potential biomarkers for ADHD. A biomarker is a
directly measurable indicator that may be used to diagnose, evaluate, and monitor the course of a disease as
well as predict treatment response [22, 23]. To achieve
this goal, movement data tracked and recorded by a
Microsoft Kinect System during a Go/No-Go task were
analyzed using state-of-the-art signal processing strategies that made use of all available data. It was expected
that the Kinect system’s ability to capture and integrate
whole body movements would increase the precision
with which children with ADHD are identified and be
sensitive enough to correlate with symptoms of inattention and hyperactivity/impulsivity.
Methods
Study design
This was a two-phase cross-sectional study. The first
phase included both an ADHD and a control group
to assess the discriminating capabilities of movement
intensity measures extracted from data collected by a
Microsoft Kinect System. The second phase of the study
included only a subset of the ADHD group and was
designed to explore associations between movement
intensity measures and ADHD symptomatology.
Participants
Subjects were girls and boys aged 6–12 years living in
Beijing city. Children in the ADHD group were selected
to participate if they met diagnostic criteria for any presentation of ADHD (inattentive, hyperactive-impulsive, or
combined) according to DSM-5 criteria [2] or who were
considered to be subthreshold for ADHD, defined as one
symptom short of meeting diagnostic criteria. Children
Li et al. Child Adolesc Psychiatry Ment Health (2016) 10:47
Page 3 of 10
with ADHD were excluded if any other co-morbid psychiatric condition (e.g., anxiety disorder, depression)
was present. A subset of ADHD cases (N = 14) were
recruited from a randomized, wait-list controlled, multisite study entitled, the “Integrated Brain, Body and Social
(IBBS) Intervention for Attention-Deficit/Hyperactivity
Disorder” (ClinicalTrials.gov Identifier: NCT01542528;
IBBS study) [24] whereas the rest of the ADHD participants (N = 16) were outpatients from a psychiatric hospital serving Beijing City. Children in the control group
were matched to children in the ADHD group according
to age and gender and were recruited from a local elementary school.
A total of 60 children were enrolled in phase I of the
study. Thirty children were in the ADHD group and 30
children were in the control group. All participants were
of Han ancestry and each group consisted of 28 boys
and 2 girls. The mean age for both groups was 8.95 years
(SD = 1.88). The ADHD group consisted of 19 children
with ADHD combined type, 5 with inattentive type, 4
with hyperactive-impulsive type, 1 with subthreshold
combined type, and 1 with subthreshold inattentive type
based on in-person clinical evaluations. One child in the
ADHD group had discontinued treatment with methylphenidate (10 mg) due to side effects for 6 months prior
to participation in the study.
In phase 2, a total of 14 children from the IBBS study
with ADHD or subthreshold for ADHD (9 ADHD combined type, 1 inattentive type, 2 hyperactive-impulsive
type, 1 subthreshold combined type, and 1 subthreshold
inattentive type) participated. The mean age of the sample was 7.32 years (SD = 1.02). Except for the one child
referred to above, all participants were medication naive.
Considering ADHD symptom severity ratings were completed only for participants from the IBBS study as part
of the assessment protocol and not for those participants recruited from the outpatient clinic, the sample in
phase II of the study was limited to just the IBBS study
participants.
two subscale scores are derived by separately summing
the 9 inattentive and 9 hyperactive/impulsive items. The
Clinical Global Impression-Severity (CGI-S) scale also
served as a measure of ADHD symptom severity [28].
The CGI-S is rated on a 7-point scale with the severity of
illness ranging from 1 (normal) to 7 (amongst the most
severely ill patients).
This task is a well-known measure of children’s sustained
attention and response inhibition ([7, 8, 12, 13, 20, 21,
29–32]. In this version of the Go/No-Go task, a white
block appeared inside of a white frame on a black background. A white block appearing at the top of the frame
was the “go condition” and a white block appearing at the
bottom of the frame was the “no-go condition”. Children
were instructed to click the mouse during “go conditions”
and to refrain from clicking the mouse during “no-go
conditions”. The duration of each stimulus presentation
was 500 ms with an inter-trial interval of 1000 ms. Prior
to initiating the task, participants were asked if they
could see the screen clearly and if their answer was in
the affirmative, they were required to complete a minimum of at least five trials with an accuracy of >90% in
order for their data to be included. Children were then
asked to complete two runs that consisted of 28 blocks
(total blocks = 56; 9 trials per block). The first run had a
Go/No-Go ratio of 2:7, the second run had a ratio of 7:2.
The whole task took approximately 12.6 min to complete
(total Go trials = 252, total No-Go trials = 252).
The performance measures of interest for this task
included: (i) omission errors (no response given during “Go” trials); (ii) commission errors (response given
during “No-Go” trials), (iii) accuracy (correct response
across “Go” and “No-Go” trials); (iv) multiple response
errors (multiple responses given after stimulus presentation during “Go” trials); (v) reaction time (time it takes to
provide a response during “Go” trials); and (vi) reaction
time variability (standard deviation of reaction time).
Measures
ADHD symptom severity
Measures of movement intensity associated with bodily
motion
ADHD symptoms were assessed using the ADHD Rating Scale IV (ADHD-RS, [25]). The ADHD-RS has been
used repeatedly in the extant literature as a primary outcome measure in ADHD clinical trials (e.g., [26, 27]).
Internationally, this scale has been shown to have acceptable psychometric properties [25]. It is comprised of 26
items where 18 items assess ADHD symptoms (9 inattentive, 9 hyperactive/impulsive) and 8 items assess ODD
symptoms on a 4-point scale (0 = not at all, 1 = just a
little, 2 = quite a bit, 3 = very much). A total composite
score is calculated by summing all 18 ADHD items and
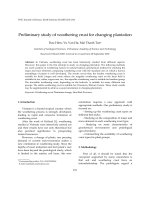
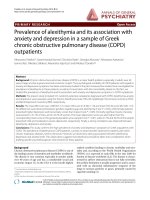
Body movements during a Go/No-Go task were monitored and recorded by a Microsoft Kinect infrared
motion sensing camera. This camera was placed 150 cm
from the child at a 45° angle from the line between the
child and a laptop computer that was used to present the
Go/No-Go task (Fig. 1). To ensure the quality of sampling, children were restricted to standing in a circle with
a radius of approximately 25 cm [33]. The Kinect camera is a horizontal bar connected to a small base with a
motorized pivot and consists of a Red–Green–Blue camera and depth sensor. The camera has a pixel resolution
Modified Go/No‑Go task
Li et al. Child Adolesc Psychiatry Ment Health (2016) 10:47
Fig. 1 Physical layout for the study
of 640 × 480 and a frame rate of 30 frames per second
(FPS). The image depth sensor contains a monochrome
complementary metal oxide semiconductor (CMOS)
and an infrared projector, which emits multiple infrared
rays to form a close-spaced light spot matrix in order to
determine its distances from multiple reference points of
a participant’s silhouette. The data from this depth sensor
were then pre-processed to create a 3-dimensional bitmap that allowed for the monitoring of pixels by comparing temporally adjacent frames to detect movement and
extract measures of movement intensity [34].
Procedures
Both phases of this study were approved by an ethics
review board (Scientific Research Ethics Committee of
the Institute of Psychology, Chinese Academy of Sciences
Beijing, P.R. China). Informed consent was obtained from
parents and all child participants gave informed assent
prior to initiating any study procedures. For those ADHD
participants recruited from the IBBS study, best-estimate
DSM-5 diagnoses were assigned by two experienced psychiatrists following a clinical interview with participants’
parents using the Chinese version of the Kiddie Schedule
for Affective Disorders and Schizophrenia—Present and
Lifetime Version (K-SADS-PL, [35, 36]). ADHD symptom severity ratings were also provided by two expert
clinicians as part of the IBBS assessment battery. Once
study eligibility was confirmed, participants completed a
Go/No-Go Task while the Microsoft Kinect System monitored and recorded their bodily movements. All study
procedures for this subset of ADHD participants including the collection of movement data occurred during the
IBBS screening visit. The collection of movement data for
the remaining ADHD participants took place after their
diagnoses were confirmed at the outpatient psychiatric
Page 4 of 10
hospital. Diagnoses were made by two experienced psychiatric clinicians based on a clinical interview with the
children’s parents, parents’ ratings on a measure assessing
their children’s emotions and behavior (i.e., Achenbach
Child Behavior Checklist [16]) and an attention task (i.e.,
Cross-out task [37]). Children from the control group
participated in study procedures during one visit to their
school by the research team after written consent/assent
was given. To confirm the typical development of participating children, their clinical files containing classroom
behavior history and routine mental health sessions were
reviewed by the school psychologist. A brief screening
interview of DSM-5 diagnoses was also done independently by an experienced psychiatrist at the local hospital to confirm their “healthy control” designation. All the
movement data were collected in private rooms with the
curtains drawn to limit distractions and control the environment’s light so that the children could see the monitor
screen clearly.
Preprocessing of Microsoft Kinect data
This study used bitmap source data of participants’ silhouettes including depth information from the Microsoft Kinect system. The raw silhouette data can be quite
unstable and inconsistencies can be observed when viewing the frames in sequence, as noise fragments can be
observed bursting across the silhouette even when participants are standing completely still. The noise level of
Microsoft Kinect’s infrared sensor has shown to be correlated with the distance between the sensor and target [38]
so by keeping this distance constant, one source of noise
was minimized. To further account for the remaining
noise, a denoise procedure was used to extract the movement intensity measures. First, a baseline assessment of
movement was conducted by asking participants to stand
still for 15 s. As the average noise level across all 60 participants was 25 pixels (SD = 3.1) when standing still, a
scan-line algorithm was used to remove regions of noise
smaller than 25 pixels from each participant’s recording.
The Kinect data was then preprocessed by comparing two
temporally adjacent bitmaps of the silhouette pixel-bypixel, to determine if there was a change between the two
frames (see Additional file 1: Figure S1). Within a given
time interval, if a particular pixel had different spatial
coordinate values than the previous frame, the program
was instructed to mark it as a moved pixel. This yielded
a movement intensity value across two adjacent frames
where a greater number of moved pixels was indicative of
greater intensity in the movement between two frames.
Considering the total pixel count that represented a
child’s body was continually changing due to movement,
it was necessary to transform the moved pixel count into
a converted score by dividing the total moved pixel count
Li et al. Child Adolesc Psychiatry Ment Health (2016) 10:47
by the total mass of the child’s body (i.e., number of pixels
representing the child’s silhouette in the current fame).
This converted value of movement intensity was
recorded for each frame. As this value was time-locked,
it represented a time domain signal to which a Fourier
transformation was applied to produce a movement
intensity distribution (MID). Since the Kinect camera has
a sampling rate of 30 Hz, the frequency domain resolution was expected to be half this sampling rate, resulting
in a 0–15 Hz range. The MID data was then subdivided
into 15 non-overlapping 1 Hz frequency bands (FB).
Thus, the following measures were calculated from the
data captured by the Microsoft Kinect System: a composite measure of total movement intensity (TMI) and
a movement intensity distribution (MID) across 15 frequency bands (the FB measures).
Data analytic plan
Phase 1
All data analyses were conducted using R programming
language version 3.0.3. Independent two-tailed t tests
were conducted to compare the ADHD group and control group on their performance on the Go/No-Go task
and on each measure of movement intensity. In order
to examine the precision with which the Kinect infrared motion tracking camera differentiated children with
ADHD from healthy controls, the area under the ROC
(Receiver Operating Characteristic) curve (AUC) for the
total movement intensity (TMI) and 15 frequency band
(FB) measures was calculated. As defined in the research
literature, an AUC between 0.7 and 0.9 has adequate precision whereas an AUC above 0.9 has good precision [39].
As prior studies have evaluated Go/No-Go performance
measures as potential indicators of ADHD (e.g., [6],
ROC-AUC analyses were performed for these measures
as well. Finally, bivariate correlations were conducted to
examine associations between measures of movement
intensity and Go/No-Go task performance.
Phase 2
To further examine the usefulness of the movement
intensity measures as potential biomarkers for ADHD,
bivariate correlations were run between the movement
intensity measures and ADHD symptom severity (e.g.,
ADHD-RS, CGI-S). Correlations between Go/No-Go
task performance measures and ADHD symptom severity were also performed. Finally, in an exploratory analysis, we examined if the same FBs that were associated
with the ADHD symptom severity measures were also
correlated with the inattentive and hyperactive-impulsive
subscale scores of the ADHD-RS. To address the multiple comparison problem, the false discovery rate (FDR)
Page 5 of 10
method was applied to all p values resulting from tests of
group differences and correlational analyses.
Results
Phase 1
Children in the control group had significantly better performance across all six performance measures on the Go/
No-Go task as compared to the ADHD group (Table 1).
The ADHD group displayed more movement than the
control group, as group comparisons were all statistically significant (p < 0.05) for the TMI and FB measures
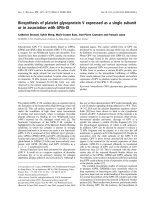
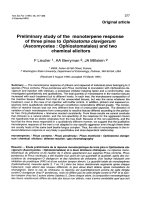
even after applying the FDR adjustment. The AUC was
0.904 for the TMI measure and between 0.867 and 0.932
for the 15 FB measures indicating that these measures of
movement intensity had adequate to good precision with
regard to accurately classifying children with and without
ADHD (Fig. 2). Overall, 29 of 30 children with ADHD
were discriminated from 25 of 30 normal controls with a
sensitivity of 0.967 and specificity of 0.833, as calculated
using the TMI measure. The ROC-AUC analysis for Go/
No-Go task measures revealed AUC values between 0.69
and 0.93 with reaction time variability having the best
discriminability: AUC of 0.93, sensitivity of 0.967, and
specificity of 0.867. Only commission errors on the Go/
No-Go task were significantly correlated with the TMI
measure (r = 0.28, p = 0.03).
Phase 2
After applying the FDR adjustment, 12 out of 15 frequency bands were correlated with the CGI-S scores and
10 out of 15 bands were correlated with the ADHD-RS
total scores, 10 out of 15 bands were correlated with the
ADHD-RS hyperactivity subscale and 7 out of 15 bands
were correlated with the ADHD-RS inattentive subscale. The 10–11 and 12–13 Hz frequency bands had
the strongest correlations with the ADHD-RS (total and
subscales) and CGI-S scores (Table 2). The TMI measure was not correlated with the ADHD-RS total scores
or either the hyperactivity or inattentive subscale scores,
but it was significantly correlated with the CGI-S scores
(r = 0.61, p = 0.021). There were no significant correlations between any of the Go/No-Go performance measures and ADHD symptom severity measures [ADHD-RS
(total and subscales) and CGI-S].
Discussion
The purpose of this study was to use an infrared motion
tracking system to monitor and record the movement
intensity of children in order to determine its diagnostic precision for ADHD and its possible association with
ratings of ADHD symptom severity. Results from this
study revealed that our measures of movement intensity
[i.e., a composite measure of total movement intensity
Li et al. Child Adolesc Psychiatry Ment Health (2016) 10:47
Page 6 of 10
Table 1 Go/No-Go task performance measures: ADHD group vs. control group
Go/No-Go task
measures
ADHD group (n = 30)
Mean (SD)
Control group (n = 30)
Mean (SD)
t (df)
p value
AUC
Omission errors
91.0 (38.9)
63.2 (20.1)
3.47 (43.5)
0.001
0.74
Commission errors
61.4 (16.9)
47.1 (14.2)
3.54 (56.4)
<0.001
0.76
312.6 (63.0)
366.7 (34.9)
0.844
26.9 (8.2)
−4.12 (45.3)
<0.001
39.0 (24.0)
0.013
0.69
Accuracy
Multiple responses
2.62 (35.7)
Reaction time (RT)
580.7 (140.2)
428.1 (37.5)
5.76 (33.1)
<0.001
0.83
RT variability
269.0 (100.1)
100.2 (34.7)
8.73 (35.9)
<0.001
0.929
SD standard deviation; df degree of freedom; AUC area under the curve (an AUC between 0.7 and 0.9 has adequate precision whereas an AUC above 0.9 has good
precision)
(TMI measure) and a movement intensity distribution
measure across 15 frequency bands (FB measures)] were
able to distinguish children with ADHD from healthy
controls. However, only the measures linked to the 15
pre-determined 1 Hz frequency bands were significantly
correlated with both the CGI scores and ADHD-RS
total scores. The 10–11 and 12–13 Hz frequency bands
had the strongest correlations with these ADHD symptom severity measures. Both of these frequency bands
were also significantly associated with the inattentive
and hyperactive/impulsive subscales of the ADHD-RS.
The following discussion considers potential implications
for these findings, limitations of this study’s design, and
future research directions.
The first phase of this study examined the discriminating capabilities of our movement intensity measures
with respect to children with ADHD and healthy control children. Our results aligned well with prior studies
using other measures extracted from movement data, as
children with ADHD performed less well and engaged
in more movement than healthy control children when
completing a neuropsychological task of attention and
response inhibition while their body movements were
recorded [20, 29]. In contrast to our predictions, our
movement intensity measures did not outperform, but
instead, were comparable in terms of their ability to differentiate children with ADHD from healthy controls [6,
12, 19]. Interestingly, the only Go/No-Go performance
measure to match the discriminating capabilities of our
movement intensity measures was reaction time variability, which has been identified as a stable feature of
ADHD in a recent meta-analytic review [40]. However,
the only Go/No-Go performance measure to significantly
correlate with our measures of movement intensity was
commission errors, which suggests that our findings
(e.g., correlations between movement intensity measures
and ADHD symptom severity ratings) are not attributable to the Go/No-Go task and these performance and
movement intensity measures are potentially tapping different aspects of ADHD.
It is also worth noting that the measure of movement
intensity used in this study achieved a better classification accuracy than did a functional neuroimaging procedure using functional near-infrared spectroscopy (fNIRS)
during the course of a Go/No-Go task [41]. This suggests
that the movement intensity procedures used in this
study might be an effective biomarker for children with
ADHD at the individual level. More specifically, we are
interested in determining whether measures of movement may contribute to a clinician’s ability to diagnose,
evaluate, and monitor a disease, as well as track an individual’s response to treatment [22, 23].
The second phase of this study was aimed to further
examine the usefulness of measures of movement intensity as potential biomarkers for ADHD by looking at
associations between these movement intensity measures and ADHD symptom severity. As predicted, our
measures of movement intensity were significantly correlated with overall ADHD symptom severity in addition
to symptoms of hyperactivity/impulsivity and inattention whereas movement measures isolated to one location of the body are not [12]. Indeed, a more stringent
test to evaluate the potential of our movement intensity
measures as ADHD biomarkers was employed since clinician-rated measures of ADHD symptom severity were
used, which are considered more objective than parent
or teacher ratings. In contrast, the Go/No-Go performance measures failed to significantly correlate with any
measures of ADHD symptom severity. These findings
underscore the potential value of monitoring movement
intensity associated with body movements, over and
above neuropsychological tasks of attention and response
inhibition, to objectively assess ADHD symptom severity over time and in response to treatment. However,
our results need to be replicated by comparing the discriminating capabilities of the movement intensity measures to other neuropsychological tasks (e.g., continuous
Li et al. Child Adolesc Psychiatry Ment Health (2016) 10:47
Page 7 of 10
data indicate that the 10–11 and 12–13 Hz frequency
bands are particularly promising. One possible explanation for the strong correlations found between these
specific frequency bands and clinician ratings of ADHD
symptoms is that the high frequency signals, after Fourier transformation, reflect minor waves of movement
intensity that are associated with small movements like
fidgeting actions of the fingers or partial body discordant
movements. Such a possibility highlights the sensitivity
of this particular measure and its potential clinical utility.
Another finding that deserves some attention is that
the total movement intensity measure did not correlate
with most measures of ADHD symptom severity. A possible explanation for this finding could be that the body
movements associated with ADHD were only reflected in
a portion of the frequency bands and the total movement
intensity is the sum of all frequency bands. This also
provides preliminary support that a frequency domain
perspective may be a more refined approach to monitor
ADHD-related body movements.
Fig. 2 Phase 1: a Area under the curve (AUC) of the approximate
total movement intensity; b AUC of the movement intensity distribution (MID) data for the 10–11 Hz frequency band; and c AUC of the
MID for the 12–13 Hz frequency band
performance task) before any firm conclusions can be
made.
Another novel approach used in this study concerns
the potential value of movement intensity measures that
are linked to specific frequency bands. Our preliminary
Future directions and limitations
ADHD is frequently comorbid with other neurodevelopmental and neuropsychiatric disorders including
oppositional defiant disorder, conduct disorder, Tourette
syndrome, depression, anxiety disorder, and learning
disorders [42]. Future studies are needed to determine
the degree to which these co-occurring disorders have
an impact on estimates of movement intensity. This
may be particularly problematic for movement disorders like Tourette’s Disorder which is highly comorbid
with ADHD [43]. Given Tourette’s Disorder is a movement disorder, it would be difficult to partition out which
movements are attributable to Tourette’s and which
are attributable to ADHD using the current methods
described in this study. However, applying more morphologic and pattern recognition methods to movement
data of children with ADHD and Tourette’s may potentially enable us to identify their distinct attributes or even
build computer vision classifiers. Relatedly, it would be
worthwhile to use infrared motion tracking technology to
identify movement patterns of other mental disorders in
order to isolate those patterns that are specific to ADHD.
Similar approaches are underway with fNIRS as well
as volumetric and functional MRI data from individuals with a range of neuropsychiatric disorders including
ADHD [41, 44, 45].
In this study, we recruited participants with ADHD
across all diagnostic presentations. However, we did
not compare differences in movement intensity across
presentations because of our limited sample size.
Future research should consider determining whether
or not our movement intensity measures are capable of
Li et al. Child Adolesc Psychiatry Ment Health (2016) 10:47
Page 8 of 10
Table 2 Correlations of clinician ratings of ADHD symptom severity (N = 14) and the most promising frequency bands
of the movement intensity distributions (MID) measured using the Microsoft Kinetic system
FBs of MID
CGI-S
ADHD-RS
Total
ADHD-RS
Inattentive
ADHD-RS
Hyperactive/impulsive
10–11 Hz
r = 0.60 (p = 0.006)
r = 0.67 (p = 0.008)
r = 0.63 (p = 0.015)
r = 0.64 (p = 0.014)
12–13 Hz
r = 0.65 (p = 0.013)
r = 0.69 (p = 0.006)
r = 0.65 (p = 0.012)
r = 0.65 (p = 0.011)
Total movement intensity
r = 0.61 (p = 0.002)
r = 0.53 (p = 0.051)
r = 0.50 (p = 0.067)
r = 0.50 (p = 0.069)
FBs frequency bands; MID movement intensity distributions; CGI-S the clinical global impression severity; ADHD-RS ADHD rating scale
differentiating children across ADHD presentations.
Longitudinal studies are also needed to examine the test–
retest reliability of these measurements as well as their
ability to monitor symptom severity over time. Indeed, a
key question concerns the sensitivity of this measure to
detect clinical improvement following treatment. Assessing simultaneously measures of movement intensity and
fNIRS in regions identified in the right prefrontal cortex
during a Go/No-Go task, as was done in a previous study,
might be another promising line of research [41].
With respect to study limitations, we compared our
movement intensity measures to a multi-method clinician-driven method of diagnostic classification, which is
an approach commonly used in clinical trials [7, 18, 46];
however, it is important to point out that this is not considered the “gold standard” of ADHD assessment. Therefore, future studies should consider comparing these
measures of movement intensity to this “gold standard”
(e.g., multi-informant, multi-method evaluation of functioning across multiple settings) to further evaluate its
diagnostic precision. It should also be noted that our Go/
No-Go task had an equivalent number of Go and No-Go
trials across the entirety of the paradigm; however, the Go
trials were five times more frequent than the No-Go trials in the second run of the task, thus capturing response
inhibition. In future studies, it is recommended that the
number of Go trials always exceed the number of No-Go
trials in order to optimize response inhibition. Finally, as
with all methods of assessment, our measures of movement intensity are not without error. Data quality was
limited due to the noise of the image signal and a sparse
light structure sampling coverage with a frame rate of
30 Hz, thus limiting granularity of the data. Also, the
frame-to-frame comparison algorithm may have underestimated movement for the x–y coordinate axes and
overestimated for the z-coordinate axis. By using a more
precise data collection device (e.g. laser scanner) and surface and voxel-based rebuild tracking techniques, there
may be considerable precision improvement. It may also
be useful to simultaneously record body movements of
participants with a visible light band camera to further
assess the nature of their movements via qualitative analysis software.
Conclusion
Locomotor activity and movement intensity are emerging as core constructs in our understanding of ADHD.
In this study, movement intensity measures extracted
from body movement data by an infrared motion-sensing camera during a Go/No-Go task was found to distinguish children with ADHD from typically developing
children and to be highly correlated with clinician ratings of symptom severity. These results suggest that using
infrared motion detecting systems to calculate measures
of movement intensity has the potential to become a useful clinical tool that may have several advantages over
traditional approaches. Specifically, these methods have
the potential to be more time and cost efficient than the
“gold standard” of ADHD assessment, thus enhancing
the likelihood of clinicians making use of this objective
indicator without relying on single informant measures
that are subject to biases. These advantages highlight the
importance of replication studies, as movement intensity
measures extracted from body movements may prove to
be a new behavioral biomarker of ADHD.
Additional files
Additional file 1: Figure S1. A Sequence diagram of the program used
to analyze the Microsoft Kinect Data. This is the sequence diagram of the
computer program used to analyze the Microsoft Kinect data. The component processes are connected by the arrows from left to right. The vertical
direction shows the lifecycle for the timeline for each process.
Abbreviations
ADHD: attention-deficit/hyperactivity disorder; TMI: total movement
intensity; FB: frequency bands; CGI: clinical global impression scale; ADHDRS: ADHD-rating scale; DSM 5: diagnostic and statistical manual of mental
disorders 5th edition; AUC: area under receiver operating characteristic curve;
IBBS: integrated brain, body and social intervention; CGI-S: clinical global
impression-severity; FPS: frames per second; COMS: complementary metal
oxide semiconductor; K-SADS-PL: Kiddie schedule for affective disorders and
schizophrenia-present and lifetime version; MID: movement intensity distribution; ROC: receiver operating characteristic; FDR: false discovery rate; fNIRS:
functional near-infrared spectroscopy.
Authors’ contributions
LF carried out the experimental design, made the data collection and data
sorting program, and wrote the first draft of the manuscript. ZY conceived
of the study design and organized the experiment. SS made significant revisions to multiple drafts of the manuscript and made key contributions to the
discussion section. FS improved the data processing approach and carried out
Li et al. Child Adolesc Psychiatry Ment Health (2016) 10:47
the signal analysis. CM helped edit and improve the manuscript. ZX helped
run the experiment. QY organized the evaluation team and carried out the
assessments. LZ participated in the research design and coordination of running the experiment. JL is the whole team’s leader and made key conceptual
and practical contributions to the manuscript. All authors read and approved
the final manuscript.
Author details
1
Key Lab of Mental Health, Institute of Psychology, Chinese Academy of Sciences, 218 South Block, #16 Lincui Road, Chaoyang District, Beijing 100101,
People’s Republic of China. 2 Beijing Institute for Brain Disorders, Beijing
Anding Hospital, Capital Medical University, Beijing, People’s Republic of China.
3
Child Study Center, Yale University School of Medicine, I‑265 SHM, 230 South
Frontage Road, New Haven, CT 06520‑7900, USA. 4 Department of Psychology, University of Southern Mississippi, Hattiesburg, MS, USA. 5 Department
of Psychology, University of Delaware, Newark, DE, USA. 6 Chinese Academy
of Medical Sciences, Peking Union Medical College Hospital, Peking Union
Medical College, Beijing, People’s Republic of China. 7 University of Chinese
Academy of Sciences, Beijing, People’s Republic of China. 8 Center for Child
Health, Behavior and Development, Seattle Children’s Research Institute, 2001
8th Ave #400, Seattle, WA 98121, USA.
Acknowledgements
We wish to extend our gratitude to Li Bin, Zhou Yuming, and Huang Huanhuan for their assistance in completing the psychiatric assessments.
Competing interests
The authors declare that they have no competing interests.
Authors’ funding source
Li Fenghua: Institute of Psychology, Chinese Academy of Sciences. Zheng
Yi: Beijing Anding Hospital. Stephanie Smith: Department of Psychology, the
University of Southern Mississippi. Frederick Shic: Department of Pediatrics,
University of Washington. Christina Moore: Department of Psychology, University of Delaware. Zheng Xixi: Peking Union Medical College. Qi Yanjie: Beijing
Anding Hospital. Liu Zhengkui: Institute of Psychology, Chinese Academy
of Sciences. James Leckman: Child Study Center, Yale University School of
Medicine.
Ethical
This study has been approved by Yale University Human Investigation Committee (HIC Protocol # 11100009142). This study has also been approved
by Scientific Research Ethic Committee of Institute of Psychology, Chinese
Academy of Sciences.
All participants’ legal guardians provided written consent before any
experimental procedures were conducted.
Funding
This research was funded by the Director’s Office at the National Institutes of
Health (Award# R01HD070821) and the Knowledge Innovation Program—
Early Cultivating Model of Innovative Talent (KIP-ECMIT).
Received: 9 June 2016 Accepted: 23 November 2016
References
1. Polanczyk G, de Lima MS, Horta BL, Biederman J, Rohde LA. The worldwide prevalence of ADHD: a systematic review and metaregression
analysis. Am J Psychiatry. 2007;164:942–8.
2. American Psychiatric Association. Diagnostic and statistical manual of
mental disorders. 5th ed. Arlington: (DSM-5): American Psychiatric Publishing; 2013.
3. Baum SM, Olenchak FR. The alphabet children: GT, ADHD, and more.
Exceptionality. 2002;10(2):77–91.
4. Sciutto M, Eisenberg M. Evaluating the evidence for and overdiagnosis of
ADHD. J Atten Disord. 2007;11(2):106–13.
Page 9 of 10
5. Faedda G, Teicher M. Objective measures of activity and attention in the
differential diagnosis of childhood psychiatric disorders. Essent Psychopharmacol. 2005;6(5):239–49.
6. García Murillo L, Cortese S, Anderson D, Di Martino A, Castellanos FX.
Locomotor activity measures in the diagnosis of attention deficit hyperactivity disorder: meta-analyses and new findings. J Neurosci Methods.
2015;252:14–26.
7. Heiser P, Frey J, Smidt J, Sommerlad C, Wehmeier PM, Hebebrand J, Remschmidt H. Objective measurement of hyperactivity, impulsivity, and inattention in children with hyperkinetic disorders before and after treatment
with methylphenidate. Eur Child Adolesc Psychiatry. 2004;13(2):100–4.
8. Heiser P, Heinzel-Gutenbrunner M, Frey J, Smidt J, Grabarkiewicz J, Friedel
S, Kuhnau W, Schmidtke J, Remschmidt H, Hebebrand J. Twin study on
heritability of activity, attention, and impulsivity as assessed by objective
measures. J Atten Disord. 2006;4(9):575–81.
9. Teicher M. Actigraphy and motion analysis: new tools for psychiatry. Harv
Rev Psychiatry. 1995;3(1):18–35.
10. Teicher M, Anderson C, Polcari A, Gold C, Maas L, Renshaw P. Functional
deficits in basal ganglia of children with attention-deficit/hyperactivity
disorder shown with functional magnetic resonance imaging relaxometry. Nat Med. 2000;6:470–3.
11. Teicher M, Polcari A, Anderson C, Andersen S, Lowen S, Navalta C. Rate
dependency revisited: understanding the effects of methylphenidate
in children with attention deficit hyperactivity disorder. J Child Adolesc
Psychopharmacol. 2003;13(1):41–51.
12. Teicher MH, Ito Y, Glod CA, Barber NI. Objective measurement of hyperactivity and attentional problems in ADHD. J Am Acad Child Adolesc
Psychiatry. 1996;35(3):334–42.
13. Wehmeier PM, Schacht A, Wolff C, Otto WR, Dittmann RW, Banaschewski
T. Neuropsychological outcomes across the day in children with
attention-deficit/hyperactivity disorder treated with atomoxetine: results
from a placebo-controlled study using a computer-based continuous
performance test combined with an infra-red motion-tracking device. J
Child Adolesc Psychopharmacol. 2011;5(21):4333–444.
14. Kühnhausen J, Dirk J, Schmiedek F. Individual classification of elementary
school children’s physical activity: a time-efficient, group-based approach to
reference measurements. Behav Res Methods. 2016. (Epub ahead of print).
15. Kühnhausen J, Leonhardt A, Dirk J, Schmiedek F. Physical activity
and affect in elementary school children’s daily lives. Front Psychol.
2013;22(4):456.
16. Achenbach TM. Manual for the child behavior checklist/4-18 and 1991
profile. Burlington: Department of Psychiatry, University of Vermont; 1991.
17. Moore M. Behavioral sleep problems in children and adolescents. J Clin
Psychol Med Settings. 2012;19(1):77–83.
18. Wood AC, Asherson P, Rijsdijk F, et al. Is overactivity a core feature in
ADHD? Familial and receiver operating characteristic curve analysis of
mechanically assessed activity level[J]. J Am Acad Child Adolesc Psychiatry. 2009;48(10):1023–30.
19. Martín-Martínez D, Casaseca-de-la-Higuera P, Alberola-López S, Andrés-deLlano J, López-Villalobos JA, Ardura-Fernández J, Alberola-López C. Nonlinear analysis of actigraphic signals for the assessment of the attention-deficit/
hyperactivity disorder (ADHD). Med Eng Phys. 2012;34(9):1317–29.
20. Tabori-Kraft J, Sorensen MJ, Kaergaard M, Dalsgaard S, Thomsen PH.
Is OPTAx useful for monitoring the effect of stimulants on hyperactivity and inattention? A brief report. Eur Child Adolesc Psychiatry.
2007;16(5):347–51.
21. Teicher MH, Polcari A, McGreenery CE. Utility of objective measures of
activity and attention in the assessment of therapeutic response to
stimulants in children with attention-deficit/hyperactivity disorder. J
Child Adolesc Psychopharmacol. 2008;18(3):265–70.
22. Aronson JK. Biomarkers and surrogate endpoints. Br J Clin Pharmacol.
2005;59(5):491–4.
23. Atkinsons A, Colburn W, De Gruttola V, DeMets D, Downing G, Hoth D.
Biomarkers and surrogate endpoints: preferred definitions and conceptual framework. Biomarker definition working group. Clin Pharmacol Ther.
2001;69:89–95.
24. Smith S, Vitulano L, Katsovich, L, Li S, Moore C, Li F, Grantz H, Zheng X,
Eicher V, Aktan S, Zheng Y, Sukhodolsky DG, Wexler BE, Leckman JF. A
randomized controlled trial of an integrated brain, body, and social (IBBS)
intervention for children with attention-deficit/hyperactivity disorder. J
Atten Disord. 2016. pii: 1087054716647490. (Epub ahead of print).
Li et al. Child Adolesc Psychiatry Ment Health (2016) 10:47
25. Zhang S, Faries DE, Vowles M, Michelson D. ADHD rating scale IV: psychometric properties from a multinational study as clinician-administered
instrument. Int J Methods Psychiatr Res. 2005;14(4):186–201.
26. Adler LA, Spencer T, Faraone SV, Kessler RC, Howes MJ, Biederman J,
Secnik K. Validity of pilot adult ADHD self-report scale (ASRS) to rate adult
ADHD symptoms. Ann Clin Psychiatry. 2006;18(3):145–8.
27. Kemner JE, Starr HL, Ciccone PE, Hooper-Wood CG, Crockett RS.
Outcomes of OROS® methylphenidate compared with atomoxetine in
children with ADHD: a multicenter, randomized prospective study. Adv
Ther. 2005;22(5):498–512.
28. Guy W. Clinical global impression (CGI). In: ECDEU Assessment manual for
psychopharmacology. Rockville: NIMH Psychopharmacology Research
Branch; 1976. p. 218–222.
29. Brocki K, Tillman C, Bohlin G. CPT performance, motor activity, and continuous relations to ADHD symptom domains: a developmental study.
Eur J Dev Psychol. 2010;7(2):178–97.
30. Teicher MH, Lowen SB, Polcari A, Foley M, McGreenery CE. Novel strategy
for the analysis of CPT data provides new insight into the effects of methylphenidate on attentional states in children with ADHD. J Child Adolesc
Psychopharmacol. 2004;14(2):219–32.
31. Hervey AS, Epstein JN, Curry JF, Tonev S, Arnold E, Conners K, Hinshaw
SP, Swanson JM, Hechtman L. Reaction time distribution analysis of neuropsychological performance in an ADHD sample. Child Neuropsychol.
2006;12(2):125–40.
32. Wehmeier PM, Schacht A, Ulberstad F, Lehmann M, Schneider-Fresenius
C, Lehmkuhl G, Dittman RW, Banaschewski T. Does atomoxetine improve
executive function, inhibitory control, and hyperactivity?: Results from a
placebo-controlled trial using quantitative measurement technology. J
Clin Psychopharmacol. 2012;32(5);653–60.
33. Khoshelham K, Elberink SO. Accuracy and resolution of kinect depth data
for indoor mapping applications. Sensors. 2012;12:1437–54.
34. Microsoft. Microsoft. Kinect. 2016. Accessed 4 Sep 2016.
35. Gau SS, Chong MY, Yang P, Yen CF, Liang KY, Cheng AT. Psychiatric and
psychosocial predictors of substance use disorders among adolescents:
longitudinal study. Br J Psychiatry. 2007;190:42–8.
36. Gau SS, Huang YS, Soong WT, et al. A randomized, double-blind, placebocontrolled clinical trial on once-daily atomoxetine in Taiwanese children
Page 10 of 10
37.
38.
39.
40.
41.
42.
43.
44.
45.
46.
and adolescents with attention-deficit/hyperactivity disorder. J Child
Adolesc Psychopharmacol. 2007;17:447–60.
Shuyong C, Bomin Y, Yunpeng G. The compendium of psychological
experiment (in Chinese). Beijing: Beijing University Publishing Company;
1989. p. 285–335.
Nguyen CV, Izadi S, Lovell D. Modeling Kinect sensor noise for improved
3D reconstruction and tracking. In: 2012 second international conference
on 3D imaging, modeling, processing, visualization and transmission.
New York: IEEE; 2012. p. 524–30.
Akobeng AK. Understanding diagnositic tests 3: receiver operating characteristic curves. Acta Paediatr. 2007;96(5):644–7.
Kofler MJ, Alderson RM, Raiker JS, Bolden J, Sarver DE, Rapport MD. Working memory and intraindividual variability as neurocognitive indicators
in ADHD: examining competing model predictions. Neuropsychology.
2014;28(3):459.
Monden Y, Dan I, Nagashima M, Dan H, Uga M, Ikeda T, Tsuzuki D, Kyutoku
Y, Gunji Y, Hirano D, Taniguchi T, Shimoizumi H, Watanabe E, Yamagata T.
Individual classification of ADHD children by right prefrontal hemodynamic responses during a go/no-go task as assessed by fNIRS. Neuroimage Clin. 2015;9:1–12.
Koolwijk I, Stein DS, Chan E, Powell C, Driscoll K, Barbaresi WJ. “Complex”
attention-deficit hyperactivity disorder, more norm than exception? Diagnoses and comorbidities in a developmental clinic. Dev Behav Pediatr.
2014;35(9):591–7.
Hirschtritt ME, Lee PC, Pauls DL, Dion Y, Grados MA, Illmann C, King RA,
Sandor P, McMahon WM, Lyon GJ, Cath DC, Kurlan R, Robertson MM,
Osiecki L, Scharf JM, Mathews CA. Lifetime prevalence, age of risk, and
genetic relationships of comorbid psychiatric disorders in tourette syndrome. JAMA Psychiatry. 2015;72(4):325–33.
Bansal R, Staib LH, Laine AF, Hao X, Xu D, Liu J, Weissman M, Peterson BS.
Anatomical brain images alone can accurately diagnose chronic neuropsychiatric illnesses. PLoS ONE. 2012;7(12):e50698. doi:10.1371/journal.
pone.0050698.
Somandepalli K, Kelly C, Reiss PT, Zuo XN, Craddock RC, Yan CG, Petkova E,
Castellanos FX, Milham MP, Di Martino A. Short-term test-retest reliability
of resting state fMRI metrics in children with and without attentiondeficit/hyperactivity disorder. Dev Cogn Neurosci. 2015;15:83–93.
Lambek R, Tannock R, Dalsgaard S, et al. Executive dysfunction in schoolage children with ADHD[J]. J Atten Disord. 2011;15(8):646–55.
Submit your next manuscript to BioMed Central
and we will help you at every step:
• We accept pre-submission inquiries
• Our selector tool helps you to find the most relevant journal
• We provide round the clock customer support
• Convenient online submission
• Thorough peer review
• Inclusion in PubMed and all major indexing services
• Maximum visibility for your research
Submit your manuscript at
www.biomedcentral.com/submit