Development and validation of high performance liquid chromatography method for the determination of nifedipine in drug - excipient compatibility testing samples
Bạn đang xem bản rút gọn của tài liệu. Xem và tải ngay bản đầy đủ của tài liệu tại đây (427.4 KB, 12 trang )
Journal of military pharmaco-medicine no9-2019
DEVELOPMENT AND VALIDATION OF HIGH PERFORMANCE
LIQUID CHROMATOGRAPHY METHOD FOR THE
DETERMINATION OF NIFEDIPINE IN DRUG - EXCIPIENT
COMPATIBILITY TESTING SAMPLES
Tran Quang Trung1; Nguyen Thanh Hai2; Trinh Van Lau3; Truong Ngoc Hien1
SUMMARY
Objectives: To develop and validate the determination method of nifedipine in drug excipient compatibility testing samples by high performance liquid chromatography. Methods:
Chromatographic conditions include: PDA detector, analytical wavelength, column and mobile
phase were studied; the evaluation of the system suitability, specificity - selectivity, the linearity
range, repeatability, intermediate precision, accuracy, range, limit of detection and limit of
quantitation following the guidance of ICH. Results: Chromatographic conditions were
established, including: PDA detector, analytical wavelength 237 nm, column RP-C18
Phenomenex, mobile phase MeOH:H2O (65/35, v/v). The method had been evaluated and
achieved the ICH’s regulations. Conclusion: The developed HPLC method can be used to
determine the nifedipine in drug - excipient compatibility testing samples, which will use in
pre-formulation studies of the nifedipine dosage forms.
* Keywords: Nifedipine; High performance liquid chromatography; Drug - excipient compatibility.
INTRODUCTION
Nifedipine (NIF), a dihydropyridine
calcium channel blocker, is widely used in
the treatment of angina, hypertension and
other vascular disorders [2, 3]. However,
nifedipine is relatively unstable [4] and
can interact with excipients in tablets
formulation that reduce its content. In
order to determine the interaction between
NIF and excipients to select suitable
excipients for formulation development of
NIF push - pull osmotic pump extendedreleased tablets, we have developed and
validated the HPLC method to quantify
NIF in drug - excipient compatibility
testing samples created by combining NIF
with potential excipients.
1. Vietnam Military Medical University
2. Vietnam National University, Hanoi
3. National Institute of Drug Quality Control
Corresponding author: Tran Quang Trung ()
Date received: 05/10/2019
Date accepted: 21/11/2019
163
Journal of military pharmaco-medicine no9-2019
MATERIALS AND METHODS
1. Materials and equipment.
* Materials and chemicals:
- Reference standard of NIF (potency
99.82%) was provided by National Institute
of Drug Quality Control.
- NIF was supplied by Baoji Guokang
Bio-Technology Co., Ltd (China) and
meet USP 38 standards.
- PEO (polyethylene oxide) N10, PEO
N80, PEO N750, PEO 301, PEO 303,
PEO Coagulant provided by Colorcon
Asia Pacific Pte., Ltd.
- Lactose monohydrate, sodium chloride,
magnesium stearate, PVP K30, red iron
oxide were sourced from China and all
meet USP 38 standards.
- HPLC grade acetonitrile, methanol
were procured from Merck Ltd.
- Other used chemicals were of HPLC
or analytical grade.
* Equipment:
HPLC system Alliance Waters 2695D;
Detector 2998 dual α Absorbance (USA);
Phenomenex LUNA column, Xbridge
column (RP-C18, 5 µm, 250 x 4.6 mm);
Spectrometer EMC-61PC-UV, Emclab
(Germany); pH meter Mettler Toledo
(Switzerland); analytical balance Mettler
Toledo (precision 0.1 mg), other usually
equipment in laboratory.
2. Methods.
* Method development:
- Preparation for standard solutions:
+ Standard stock solution: A standard
stock solution containing 500 µg/mL NIF
was prepared by exactly approximately
weighing 50.0 mg NIF standard,
164
transferring it into a 100 mL volumetric
flask and adding about 70 mL mobile
phase composed of methanol/H2O
(65/35, v/v). The flask was sonicated for
30 mins, allowed to cool at room
temperature and the volume was made
up with mobile phase.
+ Standard solution: Accurately taken
3 mL of the stock standard solution
500 µg/mL into a 10 mL volumetric flask
and made up the volume with mobile
phase, mixed well to give a standard
solution of about 150 µg/mL of NIF. All
standard solutions were filtered through a
0.45 µm PTFE membrane filter prior to
injection into the HPLC system.
- Preparation for sample solutions:
Accurately weighed an amount of
powder mixture of NIF and excipients (in
a ratio of 1/1) equivalent to about 50.0 mg
of NIF, transfered into a 100 mL volumetric
flask; 70 mL mobile phase (methanol/H2O,
65/35, v/v) was added, and the flask was
sonicated for 30 mins, allowed to cool at
room temperature and made up the volume
with mobile phase. From this solution, a
volume of about 10 mL of solution was
withdrawn and was centrifuged at 4,000
rpm for 20 minutes. Taken exactly 3 mL
of centrifuged solution into a 10 mL
volumetric flask and add the mobile phase
just to the mark, mixed well, filtered
through a 0.45 µm PTFE membrane filter
prior to injection into the HPLC system.
- Chromatographic conditions:
The NIF standard solution of 150 µg/mL
concentration was used for investigation
of chromatographic conditions. The solutions
were scanned under 200 - 500 nm
wavelength range to find the maximum
Journal of military pharmaco-medicine no9-2019
absorption wavelength. The other
chromatographic conditions such as:
stationary phase (silica gel column C18
Phenomenex LUNA, Xbridge); mobile
phase (mixture of solvents MeOH, ACN,
H2O at different proportions) were also
studied. Maintained a flow rate at
1 mL/min, sample injection volume of
25 µL. Identified chromatographic
conditions for peaks with good symmetry,
max peak area/concentration ratio and
peak height/concentration ratio.
* Method validation:
The proposed HPLC-UV method was
validated in accordance with the International
Conference on Harmonization (ICH)
guidelines and Circular 32/2018 of the
Vietnamese Ministry of Health [1,5], by
evaluating the validation characteristics
such as the system suitability, specificity selectivity, the linearity range, precision
(repeatability, intermediate precision),
accuracy, specified range, limit of detection
and limit of quantitation.
RESULTS AND DISSCUSION
1. Method development results.
* Analytical wavelength:
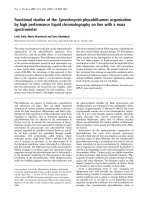
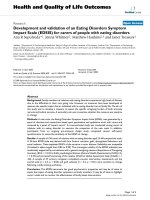
The appropriate wavelength for NIF analysis was determined by recording UV
spectrum of a NIF standard sample of 150 µg/mL on the EMC-61PC-UV
spectrophotometer, Emclab. The solution above was scanned from 200 to 500 nm with
quartz cuvettes 1 cm of thick. The blank sample was mobile phase composed of
methanol/H2O (65/35, v/v).
Figure 1: Ultraviolet absorption spectrum of NIF standard solution of 150 µg/mL.
UV-Vis spectrum showed that the absorption maxima of NIF was 237 nm and 370 nm.
From there, choose the wavelength 237 nm as the wavelength for NIF qualification by
HPLC method.
165
Journal of military pharmaco-medicine no9-2019
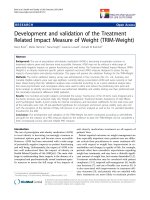
* Column efficiency validation:
Analyzed samples on two reversed silicagel columns C18 Xbridge and
Phenomenex LUNA.
Table 1: Column analysis validation.
No.
Results
Column
Asymmetry factor (AF)
Theoretical plate (N)
Retention time (min)
1
Phenomenex LUNA
1.120
10600
8.965
2
Xbridge
1.049
19385
13.108
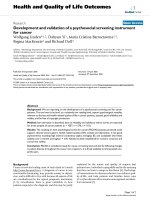
Figure 2: Chromatogram of the NIF standard sample using Xbridge column.
Figure 3: Chromatogram of the NIF standard sample using
Phenomenex LUNA column.
The results of asymmetry factor, the number of theoretical plates, retention time and
chromatograms showed that both columns had a symetrical peak, the AF was within
the permitted limits (0.8 ≤ AF ≤ 1.5); however, the Phenomenex LUNA column with a
smaller number of theoretical plates, shorter retention time compared to these ones in
the Xbridge column (13.108 mins), therefore, the Phenomenex LUNA column was
selected for the quantitative analysis of NIF.
166
Journal of military pharmaco-medicine no9-2019
* Mobile phase:
Based on the reference documents and chemicals, solvents available in laboratory,
three different mobile phase systems were studied including:
- System 1: MeOH:H2O (65/35, v/v).
- System 2: ACN:H2O (65/35, v/v).
- System 3: ACN:MeOH:H2O (25/25/50, v/v/v).
Table 2: Mobile phase investigation results.
Mobile phase
Retention time (min)
Asymmetry factor (AF)
MeOH:H2O (65/35, v/v)
8.965
1.120
ACN:H2O (65/35, v/v)
5.187
1.261
ACN:MeOH:H2O (25/25/50, v/v/v)
1.050
1.040
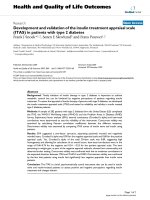
Figure 4: Chromatogram of standard sample in mobile phase system MeOH:H2O
(65/35, v/v).
Figure 5: Chromatogram of standard sample in mobile phase system ACN:H2O
(65/35, v/v).
167
Journal of military pharmaco-medicine no9-2019
Figure 6: Chromatogram of standard sample in mobile phase system ACN:MeOH:H2O
(25/25/50, v/v)
Chromatogram of standard sample in system 2 included ACN:H2O (65/35, v/v) had
unbalanced peak with AF = 1.261 and the baseline was not stable. That one in system
3 composed of ACN:MeOH:H2O (25/25/50, v/v/v) had balanced peak but retention time
was too short (1.050 minutes). Whereas, this one in system 1 including MeOH:H2O
(65/35, v/v) had stable baseline, sharp and proportioned peak with AF = 1.126,
indicated good separation ability.
* Mobile phase ratio:
The mobile phase system which composed of mixture of MeOH and H2O was
investigated at different ratio 50/50, 65/35, 60/40, 70/30, 80/20.
Table 3: Results of investigation mobile phase ratio.
MeOH:H2O (v/v)
Retetion time (min)
Speak (µV.s)
Asymmetry factor (AF)
50/50
16.328
2500234
1.059
65/35
8.981
12823315
1.127
60/40
13.315
12833722
1.091
70/30
6.601
12894973
1.169
80/20
4.261
12810176
1.258
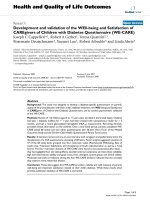
Figure 7: NIF standard chromatogram with mobile phase MeOH:H2O (50:50, v/v).
168
Journal of military pharmaco-medicine no9-2019
Figure 8: NIF standard chromatogram with mobile phase MeOH:H2O (65:35, v/v).
Figure 9: NIF standard chromatogram with mobile phase MeOH:H2O (60:40, v/v).
Figure 10: NIF standard chromatogram with mobile phase MeOH:H2O (70:30, v/v).
Figure 11: NIF standard chromatogram with mobile phase MeOH:H2O (80:20, v/v).
169
Journal of military pharmaco-medicine no9-2019
It was found that the mobile phase with the ratio of MeOH:H2O (65:35, v/v) was
selected for quantitative analysis of NIF, because of good separation with a suitable
retention time, compact and balanced peak.
2. Method validation results.
* System suitability test:
Replicated the injection of a NIF standard solution at concentration of about
150 µg/mL 6 times on HPLC system. Evaluated retention time (RT), peak area and
asymmetry factor and theoretical plate (N) in all chromatograms.
Table 4: Results of investigation system suitability.
Sample
RT (min)
Speak (µV.s)
AF
N
1
8.661
12287964
1.138
10873
2
8.718
12303091
1.137
10833
3
8.768
12318713
1.136
10814
4
8.794
12270688
1.136
10809
5
8.803
12260808
1.135
10795
6
8.795
12271121
1.136
10789
Mean
8.757
12285398
1.136
10819
RSD (%)
0.6
0.2
0.1
0.3
The results showed that %RSD for the retention time, peak area, asymmetry factor
and theoretical plate of NIF standard were less than 2.0%. The obtained value
demonstrated the suitability of the system for the analysis of NIF.
* Specificity:
Prepared 3 samples: blank sample (mixture of excipients), standard sample, test
sample. Sample processing and chromatography carried out under selected conditions.
Figure 12: Chromatogram of blank sample.
170
Journal of military pharmaco-medicine no9-2019
Figure 13: Chromatogram of NIF standard solution at concentration of 150 µg/mL.
Figure 14: Chromatogram of NIF test sample at concentration of 150 µg/mL.
Standard sample peak was balanced, retention time was 8.874 minutes. On the
chromatogram of the blank sample, no peak was observed in a period of 8 - 10
minutes. The chromatograms of both the test sample and the standard sample had
1 peak at approximately 8.8 minutes. From there, we concluded that the method was
highly specific.
* Calibration curve and linearity range:
Standard solutions were preparedat concentrations from 30 µg/mL to 240 µg/mL.
Each concentration was analyzed 3 times. Record chromatograms and peak response.
The relationship between the area and concentration of NIF was studied.
Table 5: Results of calibration curve (n = 3).
Sample
Conc. (µg/ml)
Speak (µV.s)
Sample
Conc. (µg/ml)
Speak (µV.s)
1
30
2233484.5 ± 12920.5
5
150
12282186.4 ± 5241.4
2
60
4757893.5 ± 3141.6
6
180
14819683.6 ± 17694.6
3
90
7274879.5 ± 8018.9
7
210
17343338.7 ± 35401.3
4
120
9786676.6 ± 12100.6
8
240
19868707.9 ± 28642
Regression equation: y = 83930x - 284700
2
Correlation coefficient: R = 1
171
Journal of military pharmaco-medicine no9-2019
The correlation coefficient R2 = 1 indicated that a linear correlation between the
concentration of NIF and the peak area was obtained in the range of concentrations
investigated. This linear range was suitable for quantifying NIF in drug - excipient
compatibility testing samples.
* Precision:
- Repeatability:
6 test samples were prepared according to the selected procedure and injected into
the HPLC system (prepared by tester 1). Determined the precision by calculating the
relative standard deviation between the quantifications.
Table 6: Results of method precision.
No.
Weight (g)
Speak (µV.s)
Content (%)
1
0.6450
13239283
100.43
2
0.6560
13373746
99.75
3
0.6540
13291701
99.44
4
0.6528
13280630
99.54
5
0.6545
13349152
99.79
6
0.6520
Mean
13277960
99.64
13302079
RSD% = 0.53
Under the selected chromatographic conditions, RSD of the quantitative results in
each day of analysis wss 0.53%, which was less than 2%. As such, the chosen method
guarantees accuracy.
- Intermediate precision:
6 test samples were prepared by another tester (tester 2) following the selected
procedure and injected them into the HPLC system. Determined the intermediate
precision by calculating the relative standard deviation between the quantifications.
Table 7: Results of intermediate precision.
No.
Weight (mg)
Speak (µV.s)
Content (%)
1
0.6547
13366813
99.77
2
0.6565
13424439
99.92
3
0.6555
13451567
100.28
4
0.6534
13354395
99.87
5
0.6550
13420425
100.13
6
0.6538
13330146
99.63
Mean
RSD% = 0.24%
Under the selected chromatographic conditions, RSD of the quantitative results was
analyzed by each analyst was 0.24% and 0.53%, all of them were less than 2%.
172
Journal of military pharmaco-medicine no9-2019
By both of analysts were 0.3% which was less than 3%. As such, the chosen method
guarantees precision.
* Accuracy:
The accuracy of the method expressed in % recovery. % recovery was determined
by calculating the amounts of standard added into the placebo powder at three different
concentration levels (80%, 100%, 120%). Each level was made in triplicate (n = 3).
Table 8: Results of accuracy test.
Recovery
level
Amount of the
standard added (mg)
Total peak
area (µV.s)
Amount of the
standard
recovered (mg)
%
recovery
41.8
10211936
41.5
99.28
41.4
10140050
41.2
99.52
42.0
10212840
41.5
98.81
51.9
12564631
51.1
98.46
51.3
12521695
50.9
99.22
51.7
12558812
51.1
98.84
60.5
14916732
60.7
100.33
61.2
14985984
60.9
99.51
61.8
15066105
61.3
99.19
Results
Mean = 99.2
80%
RSD = 0.36%
Mean = 98.84
100%
RSD = 0.38%
Mean = 99.68
120%
RSD = 0.59%
The amount of standard recovery at each concentration level was in the range of
98 - 102% compared to the amount of standard added, with the RSD of % recovery at
each concentration level < 2% indicated that the proposed method was highly
accurate.
* Specified range:
The accuracy results showed that at the NIF concentration of about 80% to 120%
compared to the quantitative concentration, the quantitation method achieved
good accuracy and repeatability. Thus, the specified range of the method was
120 - 180 µg/mL.
* Determination of limit of determination and limit of quantification:
The limit of detection and limit of quantification were estimated from signal to noise
ratio. Limit of detection and limit of quantification were found to be 0.0375 µg/ml and
0.105 µg/mL, respectively.
173
Journal of military pharmaco-medicine no9-2019
CONCLUSION
A HPLC method has been developed
to quantify NIF in drug - excipient
compatibility testing samples with
chromatographic conditions such as:
HPLC system Alliance Waters 2695D;
detector 2998 dual α Absorbance; column
(RP-C18, 5 µm, 100A0, 250 x 4.6 mm)
Phenomenex LUNA; mobile phase
MeOH:H2 O (65/35, v/v); flow rate:
1 mL/min; detector PDA 237 nm; injection
volume 25 µL; column temperature: room
temperature.
The proposed HPLC method was
validated by evaluating the validation
characteristics such as system suitability,
specificity - selectivity, the linearity range,
repeatability,
intermediate
precision,
accuracy, range, limit of detection and
limit of quantitation. The analytical method
had met the requirements according to
174
ICH regulations and Circular 32/2018 of
the Vietnam Ministry of Health. This
method can be used to quantify NIF in
drug - excipient compatibility testing samples.
REFERENCES
1. Vietnamese Ministry of Health. Circular
32/2018, Regulate the registration of drugs
and drug materials.
2. Uday Y.A et al. Estimation of nifedipine
by reverse phase high performance liquid
chromatography tablet dosage form. IJPLS.
2011, pp.610-612.
3. Sweetman S.C et al. Martindale.
Pharmaceutical Press. 2014, pp.1447-1455.
4. Klaus Florey et al. Analytical profiles of
drug substances. Academic Press. InC. 1989,
Vol. 18, pp.245-253.
5. ICH Harmonised Tripartite Guideline.
Guidelines for validation of analytical
procedures: Q2 (R1). Text and Methodology.
2005.