Microarray and proteome array in an atherosclerosis mouse model for identification of biomarkers in whole blood
Bạn đang xem bản rút gọn của tài liệu. Xem và tải ngay bản đầy đủ của tài liệu tại đây (950.32 KB, 11 trang )
Int. J. Med. Sci. 2019, Vol. 16
Ivyspring
International Publisher
882
International Journal of Medical Sciences
2019; 16(6): 882-892. doi: 10.7150/ijms.30082
Research Paper
Microarray and proteome array in an atherosclerosis
mouse model for identification of biomarkers in whole
blood
Sun-Yeong Gwon1,3, Hae Min Lee2, Ki-Jong Rhee3 and Ho Joong Sung1,2
1.
2.
3.
Department of Biomedical Laboratory Science, College of Health Science, Eulji University, Seongnam-si, Gyeonggi-do, 13135, Republic of Korea
Department of Senior Healthcare, BK21 plus Program, Graduated School, Eulji University, Daejeon, 34824, Republic of Korea
Department of Biomedical Laboratory Science, College of Health Sciences, Yonsei University at Wonju, Wonju, Gangwon-do 26493
Corresponding author: Tel.: +82-31-740-7108; Fax: +82-31-740-7425; E-mail:
© Ivyspring International Publisher. This is an open access article distributed under the terms of the Creative Commons Attribution (CC BY-NC) license
( See for full terms and conditions.
Received: 2018.09.20; Accepted: 2019.05.02; Published: 2019.06.02
Abstract
Cardiovascular disease (CVD) is highly fatal, and 80 percent of the mortality is attributed to heart
attack and stroke. Atherosclerosis is a disease that increases a patient’s risk to CVD and is
characterized by atheroma formed by immune cells, lipids, and smooth muscle cells. When an
atherosclerotic lesion grows and blocks blood vessels or when an atheroma ruptures and blocks
blood vessels by embolism, sudden angina, or stroke can occur. It is therefore important to diagnose
atherosclerosis early and prevent its progression to more severe disease. Although
myeloperoxidase, plasma fibrinogen, cardiac troponin-I, and C-reactive protein have been
considered as diagnostic markers for multiple cardiac risks, specific biomarkers for atherosclerosis
have not been clearly determined yet. Particularly, reliable biomarkers for the diagnosis of
atherosclerosis using whole blood are not yet available. In this study, we screened potential
biomarker genes and proteins from whole blood of apolipoprotein E knockout (ApoE-/-) mice
maintained on a Western diet, by comparing them to ApoE+/+ mice. We used whole blood for
microarray and proteome array. Candidate genes and proteins identified from each method were
confirmed with quantitative real-time PCR and ELISA. Based on our data, we speculate that Lilrb4a,
n-R5s136, and IL-5 are potential targets that can be developed into novel biomarkers of
atherosclerosis. Our study contributes to the diagnosis of atherosclerosis using whole blood in
clinical settings.
Key words: Atherosclerosis, ApoE knockout, microarray, proteome array, biomarker
Introduction
The WHO reports cardiovascular disease (CVD)
to be the most fatal disease in the world.
Approximately 80% of that mortality is caused by
heart attack and stroke. Although CVD is manifested
suddenly, people with symptoms such as
atherosclerosis or hyperlipidemia are at higher risk of
the disease [1]. Atherosclerosis is known to be a major
underlying pathology of CVD. Age, hypertension,
smoking, hyperlipidemia, obesity and metabolic
syndrome, and diabetes are the major risk factors for
atherosclerosis [2]. Regardless of the cause,
atherosclerosis is usually accompanied by a chronic
inflammatory reaction and thickening of the
endothelium, which limits blood flow. It is
characterized by rupture of the atheroma generated
from the intima of endothelium, or by the formation
of thrombus in the blood vessel, resulting in a sharp
narrowing and blocking of the blood vessel.
Atherosclerosis does not tend to have symptoms at
first and most people are unaware that they have the
disease, but as the disease progresses symptoms, such
as chest pain are manifested. Because symptoms do
not appear until late stages of the disease, it is
imperative to diagnose atherosclerosis in early stages
Int. J. Med. Sci. 2019, Vol. 16
in order to prevent severe symptoms or CVD.
To study atherosclerosis, many animal models,
including knockouts have been developed. The
apolipoprotein E knockout (ApoE-/-) and low-density
lipoprotein receptor deficient (LDLR-/-) C57BL/6 mice
are the most frequently used [3, 4]. ApoE-/- mice
develop atherosclerotic lesions, like humans, when
maintained on normal chew for several months.
However, the LDLR-/- mice require more than a year to
develop atherosclerotic lesions [5, 6]. The
predominant plasma lipoproteins in LDLR-/- mice are
very-low-density lipoprotein (VLDL) and low-density
lipoprotein (LDL), whereas ApoE-/- mice have
cholesterol with lipoprotein, like the apolipoprotein
B48 [7]. Unlike LDLR-/- mice, the ApoE-/- mice are not
affected by natural killer T-cells [8], and it is also
known that the amount of VLDL does not correlate
with atherosclerosis of the aortic root in ApoE-/- mice.
In addition to mice, animal models for atherosclerosis
have also been developed in rat, rabbit, and pig [9,
10].
Several studies have used the ApoE-/- mice for
atherosclerosis [9-15]. Mice lacking the ApoE gene
show similar growth as healthy C57BL/6 mice [3].
ApoE-/- mice fed a diet of normal chew for 8-9 months,
show lipid accumulation and foam cell deposition in
the aorta. However, when ApoE-/- mice were
maintained on a Western diet, lipid accumulation was
found in the aorta after 10 weeks [5, 13], and lipid
staining of the aorta showed the presence of
atherosclerotic lesions [16].
Using cDNA filter array, mRNA extracted from
the aorta of ApoE+/+ and ApoE-/- mice were compared,
and transcript levels of vascular cell adhesion
molecule (VCAM), intercellular adhesion molecule
(ICAM), nerve growth factor (NGF), hepatocyte
growth factor (HGF), monocyte chemotactic protein-3
(MCP3), cellular retinoic acid binding protein 2
(CRABP-II), and selectin P (SELP) were found to be
elevated in ApoE-/- mice [17]. The proteins VCAM,
ICAM, and P-selectin play a role in the formation of
foam cells. They are expressed on endothelial cells,
where they play a role in holding leukocytes and
rolling them. Other studies have shown that
transcripts of CD44, lymphocyte function-associated
antigen 1 (LFA-1), cathepsin B, and cyclooxygenase-2
(COX-2), in addition to VCAM and ICAM, are also
increased in the aorta of ApoE-/- mice [18].
Furthermore, the elevated levels of VCAM, ICAM,
cathepsin B proteins in the aorta were confirmed. In
addition, a bioinformatics analysis of microarray data
obtained from mRNA of ApoE-/- and ApoE+/+ mice
identified positive regulation of B-cell activation,
chemotaxis, antigen binding, and lipid-related
pathways to be associated with atherosclerosis [19].
883
Analysis of serum protein and RNA of aorta found
elevated levels of the chemokine (C-C motif) ligand
(CCL) proteins CCL2, CCL19, and CCL21 along with
their corresponding transcripts [20]. Additionally,
analysis of proteins from the aorta and plasma of
mice
found
increased
levels
of
ApoE-/immunoglobulins or CD5 antigens in both [21].
Multiple molecules have been reported to be
associated with atherosclerosis. Cytokines, such as
tumor necrosis factor alpha (TNFα) and interleukin 1
(IL-1), nitric oxide synthase (NOS) involved in the
production of nitric oxide (NO), selectin, and
membrane proteins VCAM and ICAM activated
during the progress of atherosclerosis, have been
identified to influence the development of
atherosclerosis [22]. The effects of TNFα and
endothelial NOS (eNOS) knock outs in ApoE-/- mice
have also been verified. The ApoE/TNFα double
knockout mice showed lower plasma cholesterol
levels and weaker atherosclerotic lesions than the
ApoE-/- mice [23]. The double knockout of eNOS and
ApoE confirmed an increase in atherosclerosis [24],
suggesting that eNOS plays a protective role against
atherosclerosis. In addition, studies on double
knockout of selectin, cyclooxygenase, scavenger
receptor
class
B,
interleukin-10,
fractalkine
(CXC3CL1), retinoid X receptor, or Fcγ receptor with
ApoE were also performed, but their effects on
atherosclerosis remain unknown [25].
Several diagnostic studies for atherosclerosis are
underway. Myeloperoxidase, plasma fibrinogen, and
cardiac troponin-I have been reported as biomarkers
for cardiovascular risk [26]. In addition, clinicians use
high-sensitivity C-reactive protein (hs-CRP) levels
along with family history and other risk factors,
including atherosclerosis, for CVD diagnosis [27].
However, hs-CRP is used broadly as a marker of
systemic inflammatory disease. A high hs-CRP count
increases the probability of being at risk of
atherosclerosis but also increases the likelihood that it
is a different CVD. Current diagnostic methods for
atherosclerosis include ultrasound, computed
tomography (CT), magnetic resonance imaging (MRI),
and angiography [28, 29]. However, these methods
are costly and require professionals for interpretation.
In addition, angiography can cause an allergic
reaction to the catheter, caused by contrast media or
vascular injury. Atherosclerosis is a complex disease
that cannot be represented by a single biomarker at a
time.
Some studies have extracted monocyte and
macrophage from blood and atherosclerotic plaque of
atherosclerosis
patients
and
found
the
Finkel-Biskis-Jinkins osteosarcoma (FOS) gene to be
elevated. Based on this observation, the analysis of
Int. J. Med. Sci. 2019, Vol. 16
circulating cells was suggested to be useful for
atherosclerosis diagnosis [30]. However, most animal
experiments have analyzed aortic tissue and/or
serum or plasma. Microarray or proteome array
studies of atherosclerosis are usually performed using
aortic tissue. As a result, applying these methods to a
patient requires the collection of aorta tissue, and
acquiring atherosclerotic lesions is burdensome to the
patient. In biomarker studies of atherosclerosis, serum
or plasma has been used to confirm the results of
aortic tissue. In this study, we used whole blood
rather than serum or plasma to examine differential
gene expression levels in ApoE-/- and ApoE+/+ mice and
find biomarkers using microarray experiments.
Furthermore, we used whole blood in proteome array
studies to examine the differential expression of
proteins.
Materials and Methods
Animals
Animals were purchased from GHBio (Daejeon,
Korea).
The
planning,
management,
and
experimentation of the animal study was approved by
the Eulji University Institutional Animal Care and Use
Committee (approval No. EUIACUC16-24, approval
date 12 December 2016). Male C57BL/6 ApoE+/+ mice
(6–8 weeks old, n = 15) and ApoE-/- mice (6–8 weeks
old, n = 15) were fed Western diet containing 21% fat
(Research Diets, USA) and provided free access to
drinking water. Experiments were performed three
times independently using 5 mice per group. Each
independent experiment has been described as a
batch in this manuscript. After 10 weeks, blood and
aorta were collected from the mice. An aliquot of the
whole blood was stored in a PAXgene tube
(PreAnalytiX, Hombrechtikon, Switzerland) for
microarray analysis. The remaining whole blood was
stored with ethylenediaminetetraacetic acid (EDTA)
in an Eppendorf tube at −80 °C until RNA and protein
extraction. The aorta were fixed in 4%
paraformaldehyde for 24 hours at 4 °C and stored at 4
°C until further use.
Oil red O stain by the en face method
The fixed aorta were transferred into 78%
methanol in an Eppendorf tube for 5 min and this step
was repeated twice. The aorta were moved into fresh
Oil red O solution (filtered 0.2% Oil red O in 100%
methanol) and incubated for 1 h on a rocker at room
temperature. Then the aorta were washed twice in
78% methanol for 5 min. The stained aorta were
stored in PBS at 4 °C. Using fine forceps, the stained
aorta was placed on black paper in a petri dish. Under
the stereomicroscope, the aorta was cut longitudinally
using spring scissors. In the dark room, pictures of the
884
stained aorta were taken with a digital camera
attached to the stereomicroscope [16]. The ImageJ
software (National Institutes of Health, USA) was
used to quantify surface area of lesions and to count
the number of spots [31]. The percentage of lesion area
was calculated by dividing it by the total aortic area.
RNA extraction, cDNA synthesis, and
quantitative real-time (qRT-) PCR
Total RNA was prepared using the QIAamp
RNA blood mini kit (Qiagen, Valencia, CA, USA)
according to manufacturer’s instructions. The cDNA
was synthesized from 1 µg of total RNA using the
SensiFAST cDNA synthesis kit (Bioline, Taunton, MA,
USA), and qRT-PCR was performed on an ABI
StepOnePlus system (Applied Biosystems, Foster
City, CA, USA). The following primer sequences were
used for Lilrb4a, 5'–CCATGCTCACAGTGCTGCTA–3'
and 5'–CCAGATGATGGGCTTTGGGA–3'; Cybb,
5'–CTGAAGGGGGCCTGTATGTG–3' and 5'–ATGGC
AAGGCCGATGAAGAA–3' [32]; n-R5s136, 5'–GTCT
ACGGCCATACCACCCT–3' and 5'–AAAGCCTACA
GCACCCGGTAT–3'; Pf4, 5'–CCTCAAGGTAGAACT
TTACTCACTA–3' and 5'–GGATCCCAGAGGAGAT
GGTCT–3'; IFNγ, 5'–GGATGCATTCATGAGTATT
GC–3' and 5'–CCTTTTCCGCTTCCTGAGG–3' [33];
IL-5, 5'–CGCTCACCGAGCTCTGTTG–3' and 5'–CCA
ATGCATAGCTGGTGATTTTT–3' [33]; TNFα, 5'–CTC
CAGGCGGTGCCTATGT–3' and 5'–GAAGAGCGTG
GTGGCCC–3' [33]; and GAPDH, 5'–AAGGTCATCCC
AGAGCTGAA–3' and 5'–CTGCTTCACCACCTTCT
TGA–3' [34]. GAPDH was used as the housekeeping
gene to normalize expression levels of target genes,
which was calculated using the 2−ΔΔCT method [35]. As
for the reduced value, however, the negative
reciprocal was taken for convenience.
Microarray
The whole blood collected in the PAXgene tube
was used for RNA extraction, and the purity and
integrity of the RNA was measured using the 260/280
optical density ratio on the Agilent 2100 Bioanalyzer
(Agilent Technologies, Palo Alto, CA, USA) according
to the manufacturer’s protocol. Experiments were
performed three times independently. The microarray
was analyzed using a GeneChip Mouse Gene 2.0 ST
Array in Macrogen Co. (Seoul, Korea). The data were
summarized and normalized using a robust
multi-average (RMA) method implemented in
Affymetrix® Power Tools (APT). We exported the
results of gene-level RMA analysis and conducted an
analysis of the differentially expressed genes (DEGs).
Statistical significance of the expression data was
determined using independent t-test and fold
changes, in which the null hypothesis was that no
Int. J. Med. Sci. 2019, Vol. 16
885
difference exists among the groups. Therefore, to
analyze the difference between the two groups, the
following formula was used to obtain the fold change
(FC) value: FC = 2^(mean value of ApoE-/- group –
mean value of ApoE+/+ group). However, for the
reduced value, the negative reciprocal was considered
for convenience. Only the values with P < 0.05 and
2.5-fold difference were used for the analysis.
at 450 nm using Infinite M200 PRO Multimode
Microplate Reader (Tecan, Switzerland).
Proteome array
Results
The mouse atherosclerosis antibody array
(Abcam, Cambridge, UK) was used according to the
manufacturer’s instruction. The whole blood with
EDTA stored at −80 °C was thawed once and 50 μL of
blood was tested. Experiments were performed three
times independently. The HLImage software
(Western Vision Software, Salt Lake City, UT, USA)
was used to analyze the spot density.
Enzyme-linked immunosorbent assay (ELISA)
The Mouse IFNγ, IL-5, and TNFα ELISA kit
(Abcam, Cambridge, UK) was used for the analysis of
IFNγ, IL-5, and TNFα. We used 50 µL of whole blood
with EDTA according to the manufacturer’s
instructions. The intensity of the color was measured
Statistical analysis
To compare the two groups, the Student’s t-test
was used in Excel software (Microsoft, Redmond,
WA, USA). Statistical significance was analyzed based
on P < 0.05.
Mouse model of atherosclerosis
To
identify
biomarker
candidates
of
atherosclerosis, we compared ApoE-/- and ApoE+/+ mice
fed with Western diet for 10 weeks. The mice were
euthanized, and whole blood and tissue were
collected under animal care guidelines of Eulji
University. The aorta of ApoE+/+ and ApoE-/- mice were
stained with Oil red O using the en face method
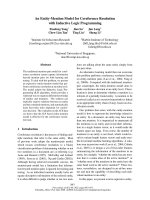
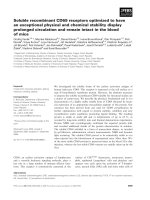
(Figure 1). The atherosclerotic lesion in the aorta root
of ApoE-/- mice were stained red (arrow). The dyed
area is concentrated in the root of the aorta in ApoE-/mice, suggesting that atherosclerosis was progressing
in the ApoE-/- mice, unlike the ApoE+/+ mice.
Figure 1. Histological analysis of the aorta from ApoE+/+ and ApoE-/- mice. (A) The oil red O stain of aorta in ApoE+/+ (left panel) and ApoE-/- (right panel) mice. Arrow indicates
atherosclerotic lesions stained by oil red O. Scale bars = 1 mm. (B) Lesion area quantification. (C) Number of stained spots. Data represent mean ± S.E.M. Experiments were
performed three times independently. *P < 0.05, ***P < 0.001.
Int. J. Med. Sci. 2019, Vol. 16
886
Table 1A. Gene expression in blood of ApoE+/+ and ApoE-/- mice.
Increased genes
No. Gene
symbol
1
2
3
4
5
6
7
8
9
10
11
12
13
14
15
16
17
18
19
20
21
22
23
24
25
26
27
28
29
Relative
fold
change
(batch 1)
Lilrb4a
4.5
Sirpb1b
4.5
Tlr7
3.7
Cybb
4.3
Itgam
3.6
Fn1
3.5
Rassf4
4.1
Cers6
4.2
Pld4
3.3
Ctss
2.8
C3
4.0
Ctsc
3.0
Il13ra1
3.8
Cd68
3.3
Ddx5
2.3
Serpinb10 2.7
Tnfrsf1b 3.1
Bmpr2
2.9
Psap
3.1
Scd2
2.0
Ifi30
2.4
Naip6
3.0
Soat1
1.8
Hsp90b1 1.9
Oas2
2.6
Atp2b1
2.2
Fgr
2.4
Rel
2.7
Ifngr1
2.2
Relative
fold
change
(batch 2)
2.7
2.9
5.8
3.9
2.8
2.8
4.0
3.4
3.9
3.6
2.7
3.5
2.5
3.1
3.8
3.4
2.8
2.7
2.7
4.4
3.5
2.2
3.3
3.3
2.6
2.7
2.3
3.0
2.7
Relative
fold
change
(batch 3)
6.9
5.1
2.7
3.7
4.3
4.3
2.3
2.5
2.8
3.5
2.8
2.8
2.8
2.6
2.9
2.5
2.8
2.8
2.6
1.9
2.1
3.0
2.9
2.5
2.3
2.6
2.8
1.9
2.7
Avg. P-value ApoE+/+ ApoE-/S.E.M. S.E.M.
4.7
4.2
4.1
4.0
3.6
3.5
3.5
3.4
3.3
3.3
3.2
3.1
3.1
3.0
3.0
2.9
2.9
2.8
2.8
2.8
2.7
2.7
2.7
2.6
2.5
2.5
2.5
2.5
2.5
0.041
0.017
0.014
0.003
0.019
0.001
0.025
0.032
0.005
0.028
0.001
0.002
0.016
0.011
0.018
0.038
0.040
0.001
0.012
0.014
0.006
0.012
0.019
0.029
0.006
0.009
0.013
0.020
0.050
0.5
0.4
0.2
0.2
0.4
0.1
0.1
0.2
0.1
0.4
0.1
0.1
0.2
0.2
0.3
0.3
0.3
0.1
0.2
0.2
0.1
0.2
0.3
0.3
0.1
0.2
0.2
0.1
0.4
0.1
0.3
0.4
0.2
0.2
0.1
0.3
0.4
0.2
0.3
0.1
0.2
0.3
0.3
0.2
0.4
0.4
0.1
0.3
0.2
0.2
0.2
0.1
0.2
0.2
0.1
0.2
0.2
0.3
Table 1B. Gene expression in blood of ApoE+/+ and ApoE-/- mice.
Decreased genes
No. Gene
symbol
1
2
3
4
5
6
7
8
9
10
11
12
13
14
15
Relative
fold
change
(batch 1)
n-R5s136 -3.8
Thbs1
-2.2
Slc6a4
-2.1
Pf4
-2.2
Pde5a
-2.1
Cd226
-2.5
Gp6
-2.3
Itgb3
-2.4
Mpl
-2.2
Gp5
-1.9
Angpt1 -2.3
Trpc6
-2.6
Parvb
-2.6
Alox12
-2.2
Arhgap10 -2.2
Relative
fold
change
(batch 2)
-2.2
-3.9
-4.2
-3.4
-3.8
-3.1
-3.4
-3.0
-3.3
-3.3
-3.1
-2.7
-2.9
-3.1
-3.1
Relative
fold
change
(batch 3)
-2.7
-2.7
-2.5
-2.4
-2.3
-2.3
-2.2
-2.5
-2.3
-2.2
-2.2
-2.2
-2.0
-2.2
-2.2
Avg. P-value ApoE+/+ ApoE-/S.E.M. S.E.M.
-2.9
-2.9
-2.9
-2.7
-2.7
-2.6
-2.6
-2.6
-2.6
-2.5
-2.5
-2.5
-2.5
-2.5
-2.5
0.024
0.030
0.035
0.001
0.012
0.001
0.002
0.012
0.041
0.005
0.006
0.006
0.009
0.017
0.018
0.0
0.4
0.3
0.1
0.2
0.1
0.1
0.2
0.4
0.2
0.2
0.2
0.2
0.2
0.2
0.3
0.2
0.4
0.1
0.1
0.1
0.1
0.2
0.3
0.1
0.2
0.2
0.2
0.2
0.2
Gene expression profiling
The gene expression profile in whole blood of
ApoE+/+ and ApoE-/- mice was analyzed using
microarray. The expression of 44 genes were altered
by more than 2.5-fold in the blood mRNA of ApoE-/mice compared to ApoE+/+ mice. Of these the
expression of 29 genes were upregulated (Table 1A)
and 15 genes were downregulated in the ApoE-/- mice
(Table 1B). Four genes, Lilrb4a, Sirpb1b, Tlr7, and Cybb,
were upregulated by more than 4-fold. Lilrb4a was the
most upregulated gene (P < 0.041), and Cybb was most
significantly upregulated gene (P < 0.003). Five genes,
n-R5s136, Thbs1, Slc6a4, Pf4, and Pde5a were
downregulated by more than 2.7-fold. n-R5s136 was
the most downregulated gene (P < 0.024), and Pf4 was
most significantly downregulated gene (P < 0.024).
The most significantly upregulated genes were Cybb,
fibronectin 1 (Fn1), complement 3 (C3), cathepsin C
(Ctsc), and bone morphogenetic protein receptor type
2 (Bmpr2) (Table 1A). These genes were upregulated
by 4.0-, 3.5-, 3.2-, 3.1-, and 2.8-fold, respectively (P <
0.003, P < 0.001, P < 0.001, P < 0.002, and P < 0.001).
The most significantly downregulated genes (Table
1B) were Pf4, cluster of differentiation 226, platelet
and T-cell activation antigen 1 (Cd226), glycoprotein
VI (Gp6), and glycoprotein V (Gp5). They were
downregulated by 2.7-, 2.6-, 2.6-, and 2.5-fold,
respectively (P < 0.001, P < 0.001, P < 0.002, and P <
0.005).
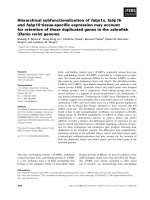
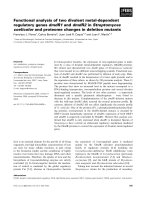
To confirm the microarray results, we performed
qRT-PCR (Figure 2). The microarray data was
confirmed based on the most upregulated (Lilrb4a)
and the most significantly upregulated (Cybb) genes.
In the qRT-PCR analysis, Lilrb4a and Cybb were
upregulated by 2.01- and 2.28-fold, respectively (P <
0.01 and P < 0.05), in the ApoE-/- mice compared to the
ApoE+/+ mice. Table 1B shows the most
downregulated (n-R5s136) and the most significantly
downregulated (Pf4) genes. n-R5s136 and Pf4 were
downregulated by 1.69- and 1.60-fold (each P < 0.05)
in the ApoE-/- mice compared to the ApoE+/+ mice. The
qRT-PCR results confirm the microarray results.
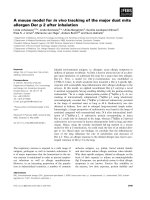
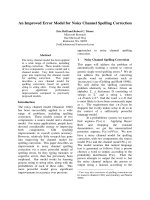
Protein expression profiling
Proteome array was performed using whole
blood of ApoE+/+ and ApoE-/- mice (Figure 3). Three
proteins, IFNγ, IL-5, and TNFα, were 2-times more
abundant in ApoE-/- mice compared to ApoE+/+ mice. In
addition,
IL-1β,
IL-13,
IL-2,
granulocyte
colony-stimulating factor (GCSF), IL-6, vascular
endothelial growth factor (VEGF), and regulated
upon activation normal T cell expressed and secreted
(RANTES) tended to increase in each batch but did
not increase more than 2-fold. In contrast, the
abundance of macrophage colony-stimulating factor
(M-CSF), IL-1α, IL-4, IL-3, Eotaxin, basic fibroblast
growth factor (bFGF) and macrophage inflammatory
protein-3a (MIP3a) proteins tended to decrease but
did not decrease more than 2-fold. In addition, the
levels of the four proteins MCP1, L-Selectin,
P-selectin, and granulocyte-macrophage colonystimulating factor (GM-CSF), showed no change
between ApoE+/+ and ApoE-/- mice.
Int. J. Med. Sci. 2019, Vol. 16
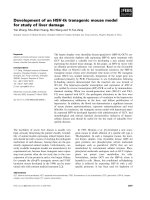
Proteins, which showed more than 2-fold change
in abundance, were selected for qRT-PCR
confirmation (Figure 3). The transcripts of IFNγ, IL-5,
and TNFα were upregulated by 4.24-, 3.48-, and
2.23-fold (P-values < 0.001, < 0.05, and < 0.01,
respectively) in ApoE-/- mice compared to ApoE+/+ mice
887
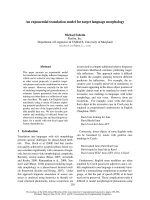
(Figure 4). To quantify each protein separately, we
used an ELISA kit to confirm the change in protein
abundance. ELISA results reflected the proteome
array results (Figure 5), and both IFNγ and IL-5 levels
were more than 2-fold (P < 0.05) in the blood of ApoE-/mice.
Figure 2. qRT-PCR analysis of target genes in blood of ApoE+/+ and ApoE-/- mice. (A) Upregulated and (B) downregulated target genes are shown. GAPDH was used as the
housekeeping gene. Data represent mean ± S.E.M. Experiments were performed three times independently. *P < 0.05, **P < 0.01.
Figure 3. Protein levels in blood of ApoE+/+ and ApoE-/- mice. (A) Representative proteome array panel. (B) Fold change in spot density of (A). Relative fold change corresponds
to the density of spot in ApoE-/- compared with control spot. Density was normalized with density of blanks, negative, and positive controls. Data represent mean ± S.E.M.
Experiments were performed three times independently.
Int. J. Med. Sci. 2019, Vol. 16
888
Figure 4. qRT-PCR analysis of target genes in ApoE+/+ and ApoE-/- mice. The expression of each gene was confirmed using specific primers. GAPDH was used as the housekeeping
gene. Data represent mean ± S.E.M. Experiments were performed three times independently. *P < 0.05, **P < 0.01, *** P < 0.001.
Figure 5. Protein expression in ApoE+/+ and ApoE-/- mice measured using ELISA. Data represent mean ± S.E.M. Experiments were performed three times independently. *P < 0.05.
Discussion
Atherosclerosis is a disease that forms atheroma
in the blood vessels, which if left untreated can cause
fatal complications. In our microarray analysis, the
expression of Lilrb4a, Sirpb1b, Tlr7 and Cybb were
upregulated, while the expression of n-R5s136, Thbs1,
Slc6a4 and Pf4 were downregulated. Both transcript
and protein levels of TNFα were increased in the
ApoE-/- mice, whereas protein levels of IFNγ and IL-5
were increased but not their corresponding
transcripts in the microarray data. The discrepancy in
the results obtained from the microarray and
proteome array experiments might be the result of
differing techniques and sensitivity between the two
methods. However, through qRT-PCR also the
upregulation in expression of these transcripts were
confirmed. Microarray experiments were conducted
to find novel biomarkers for atherosclerosis, and
proteome array experiments were employed to
determine the progression of the disease. Using
ELISA, we further confirmed the proteome array
results.
In the microarray data and by qRT-PCR, the
expression of Lilrb4a was found to be upregulated by
over 2-fold. The leukocyte immunoglobulin-like
receptor, subfamily B, member 4A (Lilrb4a) gene
encodes glycoprotein 49B (Gp49b), which is a member
of the transmembrane gp49 family. This gene is
expressed in immune cells that can bind to MHC class
I for capturing or presenting antigen. In other words,
the immune response can be modulated through the
Int. J. Med. Sci. 2019, Vol. 16
expression of this gene and its various isoforms [36].
No association of Lilrb4a in atherosclerosis has been
previously reported. However, the expression of
Lilrb4a in dendritic cells for the inhibition of excessive
activation of T-cells and lowering cellular activity has
been reported [37]. In animal models of allergic
pulmonary inflammation, the expression of Lilrb4a
has been shown to reduce the activity of dendritic
cells. When the inhalation of ovalbumin and
lipopolysaccharide (LPS) was compared in control
and Lilrb4-/- mice, the secretion of IL-4 and IL-5 was
increased in Lilrb4-/- mice together with increased Th2
lung pathology [38]. On the other hand, the
transcripts of Lilrb1, Lilrb2, and Lilrb3 were
upregulated in patients with acute myocardial
infarction, but Lilrb4a levels did not change [39].
Consequently, Lilrb4a is a promising biomarker
candidate of atherosclerosis, which allows distinction
from acute myocardial infarction.
The most significantly upregulated transcript,
Cybb has previously been studied in atherosclerosis.
The cytochrome b-245 beta chain (Cybb or gp91phox)
gene encodes the subunit constituting cytochrome
b-245 and is better known as NADPH oxidase 2
(Nox2). It is primarily expressed in endothelial cells,
smooth muscle cells (SMC), and adventitia [40]. Cybb,
along with cytochrome b-245 alpha chain (Cyba),
forms a protein that is essential for the activation of
NADPH oxidase. NADPH oxidase is a major enzyme
in the phagocyte that digests bacteria and fungi. Cybb
deficiency causes chronic granulomatous disease, in
which the activity of phagocytic NADPH oxidase is
reduced and neutrophils do not completely remove
bacteria even when digested [41]. There is also
considerable research in understanding the
association
between
Cybb
expression
and
atherosclerosis. Reduced Cybb expression in ApoE-/mice, resulted in reduced atherosclerotic lesions [42].
Decreased in vivo reactive oxygen species (ROS)
production, increased NO bioavailability and reduced
atherosclerotic plaque formation have been reported
in ApoE/gp91phox double knockout mice compared to
ApoE-/- mice [43], suggesting that Cybb deficiency
reduces atherosclerosis by limiting superoxidase in
the macrophage and vessel wall. Atherosclerosis was
also attenuated in ApoE/p47phox double knockout
mice, where p47phox is a subunit of Nox2 [44].
However, the role of Cybb in atherosclerosis remains
unclear as studies with no prevention effect have also
been published [45], while microarray of
atherosclerosis rat model shows upregulation of Cybb
[46], and knockdown of Cybb decreases restenosis
[47].
On the other hand, studies on atherosclerosis
and n-R5s136, the most downregulated gene in
889
microarray, are lacking. In addition, there are not
many studies on n-R5s136 itself. The nuclear encoded
rRNA 5S 136 (n-R5s136) gene encodes components
that make up the ribosome. The human 5S rRNA gene
was published in 1991 as a repetitive sequence gene
containing a pseudogene [48]. This property of 5S
rRNA is also maintained in mice [49]. However, much
research is still needed to deduce its function. So far,
its involvement in the interaction of ribosomes has
been reported [50]. In recent studies, a relationship
between atherosclerosis and micro RNA and its
application in diagnosis has been reported [51-53].
However, further studies to confirm the relationship
between atherosclerosis and n-R5s136, and to
determine the mechanism of atherosclerosis in
relation to the ribosome are needed.
The most significantly downregulated gene, Pf4
has been studied in relation to atherosclerosis. Pf4 or
CXCL4 encodes platelet factor 4 (PF4), a member of
the CXC chemokine family. PF4 is secreted from alpha
granules of platelet and assists the aggregation of
platelets. It also inhibits hematopoiesis and
angiogenesis. However, the role of platelets in
atherosclerosis has not been elucidated. PF4 has been
reported to inhibit the process of elimination of
oxidized LDL in vitro [54]. Studies have also shown
that removal of PF4 from platelets in ApoE-/- mice
results in a reduction in atherosclerotic plaque burden
compared to ApoE-/- mice [55]. The reported studies,
use artificial addition or removal of PF4, which does
not explain the mechanism by which the transcription
of Pf4 changes. Therefore, the role of Pf4
transcriptional downregulation in our experiments is
unclear and needs further investigation.
Atherosclerosis is a complex disease, however,
our microarray data presented a small number of
mRNAs, which are listed in Table 1A and B. In
general, mRNA expression profiling with blood
presented significantly less differentially expressed
genes (DEGs) than using that using aortic tissue. If
aortic tissues were used, more DEGs might be
obtained, including the genes involved in cell
proliferation. However, obtaining vascular tissues
from a patient is more difficult and more dangerous
than whole blood.
As atherosclerosis is a chronic inflammatory
disease, the increase in IFNγ and TNFα levels is
expected. IFNγ is an immunoregulatory factor
secreted by lymphocytes that has antiviral and
antitumor effect. It is a soluble cytokine belonging to
the type II interferon class, which is associated with
both innate and adaptive immune responses and is
primarily activated in response to viral and bacterial
infection. ApoE/IFNγ double knockout mice have
been reported to have reduced lesion size compared
Int. J. Med. Sci. 2019, Vol. 16
to ApoE-/- mice [56], and ApoE-/- mice injected with
IFNγ in the peritoneal cavity [57]. Similarly, TNFα is a
proinflammatory cytokine and a member of the tumor
necrosis factor superfamily with various functions.
TNFα primarily secreted by macrophages is involved
in various pathways, such as proliferation,
differentiation, apoptosis, and lipid metabolism.
ApoE/TNFα double knockout mice have been
reported to have similar levels of serum cholesterol,
but smaller plaques compared to ApoE-/- mice, in
addition to reduced transcripts of ICAM, VCAM, and
MCP1 [58]. However, because both IFNγ and TNFα
are cytokines that enhance inflammatory responses,
they are not of interest in application as a specific
biomarker of atherosclerosis.
The transcript and protein levels of IL-5 were
also elevated in the ApoE-/- mice. IL-5 is a cytokine
required for the growth and differentiation of B-cells
and eosinophils. Studies have reported elevated levels
of IL-5 through cytokine assay in the serum of ApoE-/mice
[59].
On
the
other
hand,
when
macrophage-specific IL-5 is overexpressed in LDLR1-/mice, IL-5 secreted by the transplanted macrophages
inhibits phagocytosis of LDL, thereby weakening the
disease [60]. Other studies have also reported that IL-5
is antiatherogenic [61]. Although IL-5 may be useful
in the early treatment of atherosclerosis, its
mechanism of action remains unknown [62], and the
role of increased IL-5 in reducing atherosclerosis
needs further investigation.
Regarding the use of whole blood for the
biomarker study, whole blood samples were used to
identify biomarkers for acute allograft rejection in
cardiac transplantation patient. Accordingly, 12 genes
were suggested as biomarker with 83% sensitivity and
100% specificity [63]. In a breast cancer study,
mass-spectrometry was performed on whole blood to
report differential DNA methylation as a marker of
breast cancer [64]. Other studies have reported that
plasma and test results are not different between
whole blood proteins. There was a positive correlation
between the amount of sCD25 detected in whole
blood and the detected amount of plasma in
Alzheimer’s disease [65]. In addition, a positive
correlation was found between three representative
markers of myocardial infarction (cTnl, CK-MB, and
myoglobin) when comparing whole blood and
plasma [66]. Therefore, using whole blood might not
be inappropriate for a biomarker study.
In this study, potential candidate biomarkers for
atherosclerosis were investigated using whole blood
of animal models. The association of atherosclerosis
with Lilrb4a, n-R5s136 and IL-5 had not been
previously reported. The roles of Cybb and Pf4
transcriptional changes in atherosclerosis, also need to
890
be further explored. Future efforts should validate the
current results using blood of atherosclerosis patients
by comparing gene expression and protein levels at
various stages of atherosclerosis progression to
identify early diagnostic markers in blood. The results
in this study contribute to the development of
diagnosis of atherosclerosis using whole blood.
Abbreviations
CVD: cardiovascular disease; ApoE-/- mice:
apolipoprotein E deficiency mice; LDLR-/- mice: low
density lipoprotein receptor deficiency mice; VLDL:
very low-density lipoprotein; VCAM: vascular cell
adhesion protein; ICAM: intercellular adhesion
molecule; NGF: nerve growth factor; HGF: hepatocyte
growth factor; MCP: monocyte-chemotactic protein;
CRABP II: cellular retinoic acid binding protein 2;
SELP: selectin P; CD: cluster of differentiation; LFA-1:
lymphocyte function-associated antigen 1; COX-2:
cyclooxygenase-2; CCL: chemokine (C-C motif)
ligand; TNFα: tumor necrosis factor alpha; IL:
interleukin; NOS: nitric oxide synthase; NO: nitric
oxide;
eNOS:
endothelial
NOS;
hs-CRP:
high-sensitivity C-reactive protein; CT: computerized
tomography; MRI: magnetic resonance imaging;
EDTA: ethylenediaminetetraacetic acid; GAPDH:
glyceraldehyde 3-phosphate dehydrogenase; Fn1:
fibronectin 1; C3: complement 3; Ctsc: cathepsin C;
CD226: platelet and T-cell activation antigen 1; Gp6:
glycoprotein VI; Gp5: glycoprotein V; IFN: interferon;
GCSF: granulocyte colony-stimulating factor; VEGF:
vascular endothelial growth factor; RANTES:
regulated upon activation normal T cell expressed
and secreted; M-CSF: macrophage colony-stimulating
factor; bFGF: basic fibroblast growth factor; MIP3a:
macrophage inflammatory protein-3a; GM-CSF:
granulocyte-macrophage colony-stimulating factor;
Lilrb4a: leukocyte immunoglobulin-like receptor;
subfamily B: member 4A; Gp49b: glycoprotein 49B;
Cybb: cytochrome b-245 beta chain; Nox2: NADPH
oxidase 2; SMC: smooth muscle cells; Cyba:
cytochrome b-245 alpha chain; ROS: reactive oxygen
species; n-R5s136: nuclear encoded rRNA 5S 136; PF4:
platelet factor 4.
Acknowledgments
This research was supported by the Bio &
Medical Technology Development Program of the
National Research Foundation (NRF) & funded by the
Korean
government
(MSIP&MOHW)
(No.
2016M3A9B6904244).
Authors’ Contributions
Sun-Yeong Gwon and Ho Joong Sung conceived
and designed the experiments; Sun-Yeong Gwon
Int. J. Med. Sci. 2019, Vol. 16
performed the experiments; Sun-Yeong Gwon, Hae
Min Lee, Ki-Jong Rhee and Ho Joong Sung analyzed
the data; Ho Joong Sung contributed all
reagents/materials/analysis tools; Sun-Yeong Gwon,
and Ho Joong Sung wrote the paper.
Competing Interests
The authors have declared that no competing
interest exists.
References
1.
2.
3.
4.
5.
6.
7.
8.
9.
10.
11.
12.
13.
14.
15.
16.
17.
18.
19.
20.
21.
Herrington W, Lacey B, Sherliker P, Armitage J, Lewington S. Epidemiology of
Atherosclerosis and the Potential to Reduce the Global Burden of
Atherothrombotic Disease. Circulation research. 2016; 118: 535-46.
Rafieian-Kopaei M, Setorki M, Doudi M, Baradaran A, Nasri H.
Atherosclerosis: Process, Indicators, Risk Factors and New Hopes.
International Journal of Preventive Medicine. 2014; 5: 927-46.
Plump AS, Smith JD, Hayek T, Aalto-Setala K, Walsh A, Verstuyft JG, et al.
Severe hypercholesterolemia and atherosclerosis in apolipoprotein E-deficient
mice created by homologous recombination in ES cells. Cell. 1992; 71: 343-53.
Ishibashi S, Brown MS, Goldstein JL, Gerard RD, Hammer RE, Herz J.
Hypercholesterolemia in low density lipoprotein receptor knockout mice and
its reversal by adenovirus-mediated gene delivery. The Journal of clinical
investigation. 1993; 92: 883-93.
Nakashima Y, Plump AS, Raines EW, Breslow JL, Ross R. ApoE-deficient mice
develop lesions of all phases of atherosclerosis throughout the arterial tree.
Arteriosclerosis and thrombosis: a journal of vascular biology. 1994; 14: 133-40.
Ishibashi S, Goldstein JL, Brown MS, Herz J, Burns DK. Massive
xanthomatosis and atherosclerosis in cholesterol-fed low density lipoprotein
receptor-negative mice. The Journal of clinical investigation. 1994; 93: 1885-93.
Wouters K, Shiri-Sverdlov R, van Gorp PJ, van Bilsen M, Hofker MH.
Understanding hyperlipidemia and atherosclerosis: lessons from genetically
modified apoe and ldlr mice. Clinical chemistry and laboratory medicine :
CCLM / FESCC. 2005; 43: 470-9.
Getz GS, Vanderlaan PA, Reardon CA. Natural killer T cells in lipoprotein
metabolism and atherosclerosis. Thrombosis and haemostasis. 2011; 106:
814-9.
Getz GS, Reardon CA. Animal models of atherosclerosis. Arteriosclerosis,
thrombosis, and vascular biology. 2012; 32: 1104-15.
Liao J, Huang W, Liu G. Animal models of coronary heart disease. Journal of
biomedical research. 2015; 30.
Piedrahita JA, Zhang SH, Hagaman JR, Oliver PM, Maeda N. Generation of
mice carrying a mutant apolipoprotein E gene inactivated by gene targeting in
embryonic stem cells. Proceedings of the National Academy of Sciences of the
United States of America. 1992; 89: 4471-5.
Reddick RL, Zhang SH, Maeda N. Atherosclerosis in mice lacking apo E.
Evaluation of lesional development and progression. Arteriosclerosis,
thrombosis, and vascular biology. 1994; 14: 141-7.
Jawien J, Nastalek P, Korbut R. Mouse models of experimental atherosclerosis.
Journal of physiology and pharmacology : an official journal of the Polish
Physiological Society. 2004; 55: 503-17.
Meir KS, Leitersdorf E. Atherosclerosis in the apolipoprotein-E-deficient
mouse: a decade of progress. Arteriosclerosis, thrombosis, and vascular
biology. 2004; 24: 1006-14.
Zaragoza C, Gomez-Guerrero C, Martin-Ventura JL, Blanco-Colio L, Lavin B,
et al. Animal Models of Cardiovascular Diseases. Journal of Biomedicine and
Biotechnology. 2011; 2011: 13.
Andres-Manzano MJ, Andres V, Dorado B. Oil Red O and Hematoxylin and
Eosin Staining for Quantification of Atherosclerosis Burden in Mouse Aorta
and Aortic Root. Methods Mol Biol. 2015; 1339: 85-99.
Wuttge DM, Sirsjö A, Eriksson P, Stemme S. Gene expression in
atherosclerotic lesion of ApoE deficient mice. Molecular Medicine. 2001; 7:
383-92.
Ma Y, Malbon CC, Williams DL, Thorngate FE. Altered gene expression in
early atherosclerosis is blocked by low level apolipoprotein E. PloS one. 2008;
3: e2503.
Papadodima O, Chatziioanou A, Sirsjo A, Kolisis FN. Bioinformatic
transcriptomic analysis of ApoE deficient mice suggests Alterations in
atherosclerosis related molecular mechanisms. Proceedings of the 10th IEEE
International Conference on Information Technology and Applications in
Biomedicine; 2010: p. 1-4.
Tabibiazar R, Wagner RA, Deng A, Tsao PS, Quertermous T. Proteomic
profiles of serum inflammatory markers accurately predict atherosclerosis in
mice. Physiological genomics. 2006; 25: 194-202.
Hanzawa H, Sakamoto T, Kaneko A, Manri N, Zhao Y, Zhao S, et al.
Combined Plasma and Tissue Proteomic Study of Atherogenic Model Mouse:
Approach To Elucidate Molecular Determinants in Atherosclerosis
Development. J Proteome Res. 2015; 14: 4257-69.
891
22. Cybulsky MI, Gimbrone MA, Jr. Endothelial expression of a mononuclear
leukocyte adhesion molecule during atherogenesis. Science. 1991; 251: 788-91.
23. Branen L, Hovgaard L, Nitulescu M, Bengtsson E, Nilsson J, Jovinge S.
Inhibition of tumor necrosis factor-alpha reduces atherosclerosis in
apolipoprotein E knockout mice. Arteriosclerosis, thrombosis, and vascular
biology. 2004; 24: 2137-42.
24. Kuhlencordt PJ, Gyurko R, Han F, Scherrer-Crosbie M, Aretz TH, Hajjar R, et
al. Accelerated atherosclerosis, aortic aneurysm formation, and ischemic heart
disease
in
apolipoprotein
E/endothelial
nitric
oxide
synthase
double-knockout mice. Circulation. 2001; 104: 448-54.
25. Kolovou G, Anagnostopoulou K, Mikhailidis DP, Cokkinos DV.
Apolipoprotein E knockout models. Current pharmaceutical design. 2008; 14:
338-51.
26. Brown TM, Bittner V. Biomarkers of Atherosclerosis: Clinical Applications.
Current cardiology reports. 2008; 10: 497-504.
27. Vlachopoulos C, Xaplanteris P, Aboyans V, Brodmann M, Cifkova R,
Cosentino F, et al. The role of vascular biomarkers for primary and secondary
prevention. A position paper from the European Society of Cardiology
Working Group on peripheral circulation: Endorsed by the Association for
Research into Arterial Structure and Physiology (ARTERY) Society.
Atherosclerosis. 2015; 241: 507-32.
28. Anderson JD, Kramer CM. MRI of Atherosclerosis: Diagnosis and Monitoring
Therapy. Expert review of cardiovascular therapy. 2007; 5: 69-80.
29. Ibanez B, Badimon JJ, Garcia MJ. Diagnosis of atherosclerosis by imaging. The
American journal of medicine. 2009; 122: S15-25.
30. Patino WD, Mian OY, Kang J-G, Matoba S, Bartlett LD, Holbrook B, et al.
Circulating transcriptome reveals markers of atherosclerosis. Proceedings of
the National Academy of Sciences of the United States of America. 2005; 102:
3423-8.
31. Chen PY, Qin L, Baeyens N, Li G, Afolabi T, Budatha M, et al.
Endothelial-to-mesenchymal transition drives atherosclerosis progression.
The Journal of clinical investigation. 2015; 125: 4514-28.
32. Jung YS, Lee S-W, Park JH, Seo HB, Choi BT, Shin HK. Electroacupuncture
preconditioning reduces ROS generation with NOX4 down-regulation and
ameliorates blood-brain barrier disruption after ischemic stroke. Journal of
Biomedical Science. 2016; 23: 32.
33. Amsen D, de Visser KE, Town T. Approaches to Determine Expression of
Inflammatory Cytokines. Methods in molecular biology (Clifton, NJ). 2009;
511: 107-42.
34. Wilkinson RDA, Young A, Burden RE, Williams R, Scott CJ. A bioavailable
cathepsin S nitrile inhibitor abrogates tumor development. Molecular cancer.
2016; 15: 1-11.
35. Livak KJ, Schmittgen TD. Analysis of relative gene expression data using
real-time quantitative PCR and the 2(-Delta Delta C(T)) Method. Methods.
2001; 25: 402-8.
36. Fanger NA, Borges L, Cosman D. The leukocyte immunoglobulin-like
receptors (LIRs): a new family of immune regulators. J Leukoc Biol. 1999; 66:
231-6.
37. Kasai S, Inui M, Nakamura K, Kakizaki Y, Endo S, Nakamura A, et al. A novel
regulatory role of gp49B on dendritic cells in T-cell priming. European journal
of immunology. 2008; 38: 2426-37.
38. Fanning LB, Buckley CC, Xing W, Breslow RG, Katz HR. Downregulation of
key early events in the mobilization of antigen-bearing dendritic cells by
leukocyte immunoglobulin-like Receptor B4 in a mouse model of allergic
pulmonary inflammation. PloS one. 2013; 8: e57007.
39. Yan W, Song H, Jiang J, Xu W, Gong Z, Duan Q, et al. Characteristics of B
cellassociated gene expression in patients with coronary artery disease. Mol
Med Rep. 2016; 13: 4113-21.
40. Csanyi G, Taylor WR, Pagano PJ. NOX and inflammation in the vascular
adventitia. Free radical biology & medicine. 2009; 47: 1254-66.
41. Violi F, Carnevale R, Loffredo L, Pignatelli P, Gallin JI. NADPH Oxidase-2 and
Atherothrombosis: Insight From Chronic Granulomatous Disease.
Arteriosclerosis, thrombosis, and vascular biology. 2017; 37: 218-25.
42. Vendrov AE, Hakim ZS, Madamanchi NR, Rojas M, Madamanchi C, Runge
MS. Atherosclerosis is attenuated by limiting superoxide generation in both
macrophages and vessel wall cells. Arteriosclerosis, thrombosis, and vascular
biology. 2007; 27: 2714-21.
43. Judkins CP, Diep H, Broughton BR, Mast AE, Hooker EU, Miller AA, et al.
Direct evidence of a role for Nox2 in superoxide production, reduced nitric
oxide bioavailability, and early atherosclerotic plaque formation in ApoE-/mice. American journal of physiology Heart and circulatory physiology. 2010;
298: H24-32.
44. Barry-Lane PA, Patterson C, van der Merwe M, Hu Z, Holland SM, Yeh ET, et
al. p47phox is required for atherosclerotic lesion progression in ApoE(-/-)
mice. The Journal of clinical investigation. 2001; 108: 1513-22.
45. Hsich E, Segal BH, Pagano PJ, Rey FE, Paigen B, Deleonardis J, et al. Vascular
effects following homozygous disruption of p47(phox) : An essential
component of NADPH oxidase. Circulation. 2000; 101: 1234-6.
46. Li JM, Zhang X, Nelson PR, Odgren PR, Nelson JD, Vasiliu C, et al. Temporal
evolution of gene expression in rat carotid artery following balloon
angioplasty. Journal of cellular biochemistry. 2007; 101: 399-410.
47. Li JM, Newburger PE, Gounis MJ, Dargon P, Zhang X, Messina LM. Local
arterial nanoparticle delivery of siRNA for NOX2 knockdown to prevent
restenosis in an atherosclerotic rat model. Gene therapy. 2010; 17: 1279-87.
Int. J. Med. Sci. 2019, Vol. 16
892
48. Sørensen PD, Frederiksen S. Characterization of human 5S rRNA genes.
Nucleic acids research. 1991; 19: 4147-51.
49. Hallenberg C, Nederby Nielsen J, Frederiksen S. Characterization of 5S rRNA
genes from mouse. Gene. 1994; 142: 291-5.
50. Dinman JD. 5S rRNA: Structure and Function from Head to Toe. International
journal of biomedical science : IJBS. 2005; 1: 2-7.
51. Gardner PP, Daub J, Tate JG, Nawrocki EP, Kolbe DL, Lindgreen S, et al. Rfam:
updates to the RNA families database. Nucleic acids research. 2009; 37:
D136-40.
52. Maitrias P, Metzinger-Le Meuth V, Massy ZA, M'Baya-Moutoula E, Reix T,
Caus T, et al. MicroRNA deregulation in symptomatic carotid plaque. Journal
of vascular surgery. 2015; 62: 1245-50.e1.
53. Holdt LM, Stahringer A, Sass K, Pichler G, Kulak NA, Wilfert W, et al. Circular
non-coding RNA ANRIL modulates ribosomal RNA maturation and
atherosclerosis in humans. Nat Commun. 2016; 7: 12429.
54. Nassar T, Sachais BS, Akkawi S, Kowalska MA, Bdeir K, Leitersdorf E, et al.
Platelet factor 4 enhances the binding of oxidized low-density lipoprotein to
vascular wall cells. The Journal of biological chemistry. 2003; 278: 6187-93.
55. Sachais BS, Turrentine T, Dawicki McKenna JM, Rux AH, Rader D, Kowalska
MA. Elimination of platelet factor 4 (PF4) from platelets reduces
atherosclerosis in C57Bl/6 and apoE-/- mice. Thrombosis and haemostasis.
2007; 98: 1108-13.
56. Gupta S, Pablo AM, Jiang X, Wang N, Tall AR, Schindler C. IFN-gamma
potentiates atherosclerosis in ApoE knock-out mice. The Journal of clinical
investigation. 1997; 99: 2752-61.
57. Whitman SC, Ravisankar P, Elam H, Daugherty A. Exogenous
interferon-gamma enhances atherosclerosis in apolipoprotein E-/- mice. The
American journal of pathology. 2000; 157: 1819-24.
58. Ohta H, Wada H, Niwa T, Kirii H, Iwamoto N, Fujii H, et al. Disruption of
tumor necrosis factor-alpha gene diminishes the development of
atherosclerosis in ApoE-deficient mice. Atherosclerosis. 2005; 180: 11-7.
59. Smith E, Prasad K-MR, Butcher M, Dobrian A, Kolls JK, Ley K, et al. Blockade
of IL-17A results in reduced atherosclerosis in Apoe-deficient mice.
Circulation. 2010; 121: 1746-55.
60. Zhao W, Lei T, Li H, Sun D, Mo X, Wang Z, et al. Macrophage-specific
overexpression of interleukin-5 attenuates atherosclerosis in LDL
receptor-deficient mice. Gene therapy. 2015; 22: 645-52.
61. Fatkhullina AR, Peshkova IO, Koltsova EK. The Role of Cytokines in the
Development of Atherosclerosis. Biochemistry Biokhimiia. 2016; 81: 1358-70.
62. Silveira A, McLeod O, Strawbridge RJ, Gertow K, Sennblad B, Baldassarre D,
et al. Plasma IL-5 concentration and subclinical carotid atherosclerosis.
Atherosclerosis. 2015; 239: 125-30.
63. Lin D, Hollander Z, Ng RT, Imai C, Ignaszewski A, Balshaw R, et al. Whole
blood genomic biomarkers of acute cardiac allograft rejection. The Journal of
heart and lung transplantation : the official publication of the International
Society for Heart Transplantation. 2009; 28: 927-35.
64. Loke SY, Lee ASG. The future of blood-based biomarkers for the early
detection of breast cancer. Eur J Cancer. 2018; 92: 54-68.
65. May JE, Pemberton RM, Hart JP, McLeod J, Wilcock G, Doran O. Use of whole
blood for analysis of disease-associated biomarkers. Analytical biochemistry.
2013; 437: 59-61.
66. Pettersson K, Katajamaki T, Irjala K, Leppanen V, Majamaa-Voltti K, Laitinen
P. Time-resolved fluorometry (TRF)-based immunoassay concept for rapid
and quantitative determination of biochemical myocardial infarction markers
from whole blood, serum and plasma. Luminescence : the journal of biological
and chemical luminescence. 2000; 15: 399-407.