Correlation between CCL4 gene polymorphisms and clinical aspects of breast cancer
Bạn đang xem bản rút gọn của tài liệu. Xem và tải ngay bản đầy đủ của tài liệu tại đây (497.59 KB, 8 trang )
Int. J. Med. Sci. 2018, Vol. 15
Ivyspring
International Publisher
1179
International Journal of Medical Sciences
2018; 15(11): 1179-1186. doi: 10.7150/ijms.26771
Research Paper
Correlation between CCL4 gene polymorphisms and
clinical aspects of breast cancer
Gui-Nv Hu1#, Huey-En Tzeng2,3,4#, Po-Chun Chen5, Chao-Qun Wang6, Yong-Ming Zhao1, Yan Wang7,
Chen-Ming Su8, Chih-Hsin Tang9,10,11
1.
2.
3.
4.
5.
6.
7.
8.
9.
10.
11.
Department of Surgical Oncology, Affiliated Dongyang Hospital of Wenzhou Medical University, Dongyang, Zhejiang, China
Taipei Cancer Center, Taipei Medical University, Taipei, Taiwan
Graduate Institute of Cancer Biology and Drug Discovery, College of Medical Science and Technology, Taipei Medical University, Taipei, Taiwan
Division of Hematology/Oncology, Department of Medicine, Taipei Medical University-Shuang Ho Hospital, Taiwan
Central Laboratory, Shin-Kong Wu Ho-Su Memorial Hospital, Taipei, Taiwan
Department of Pathology, Affiliated Dongyang Hospital of Wenzhou Medical University, Dongyang, Zhejiang, China
Department of Medical Oncology, Affiliated Dongyang Hospital of Wenzhou Medical University, Dongyang, Zhejiang, China
Department of Biomedical Sciences Laboratory, Affiliated Dongyang Hospital of Wenzhou Medical University, Dongyang, Zhejiang, China
Department of Pharmacology, School of Medicine, China Medical University, Taichung, Taiwan
Chinese Medicine Research Center, China Medical University, Taichung, Taiwan
Department of Biotechnology, College of Health Science, Asia University, Taichung, Taiwan
# These authors have contributed equally to this work
Corresponding authors: Chih-Hsin Tang PhD; Department of Pharmacology, School of Medicine, China Medical University, Taichung, Taiwan. E-mail:
and Chen-Ming Su, PhD; Department of Biomedical Sciences Laboratory, Affiliated Dongyang Hospital of Wenzhou Medical
University, Dongyang, Zhejiang, China. E-mail: ,
© Ivyspring International Publisher. This is an open access article distributed under the terms of the Creative Commons Attribution (CC BY-NC) license
( See for full terms and conditions.
Received: 2018.04.19; Accepted: 2018.06.30; Published: 2018.07.30
Abstract
Breast cancer is a major cause of cancer mortality amongst women. Chemokine (C-C motif) ligand 4 is encoded
by the CCL4 gene; specific CCL4 gene polymorphisms are related to the risks and prognoses of various diseases.
In this study, we examined whether CCL4 gene single nucleotide polymorphisms (SNPs) predict the risk and
progression of breast cancer. Between 2014 and 2016, we recruited 314 patients diagnosed with breast cancer
and a cohort of 209 healthy participants (controls) without a history of cancer. Genotyping of the CCL4
rs1634507, rs10491121 and rs1719153 SNPs revealed no significant between-group differences for these
polymorphisms. However, amongst luminal A and luminal B subtypes, compared with patients with the AA
genotype, those carrying the AG genotype at SNP rs10491121 were less likely to develop lymph node
metastasis. In addition, compared with AA carriers, those carrying the AG + GG genotype at SNP rs10491121
were at lower risk of developing distant metastasis, while the presence of the AT genotype at SNP rs1719153
increased the likelihood of pathologic grade (G3 or G4) disease. Variations in the CCL4 gene may help to predict
breast cancer progression and metastasis.
Key words: single nucleotide polymorphism, breast cancer, chemokine C-C motif ligand 4 (CCL4), genotype
Introduction
Breast cancer is the second leading cause of
cancer deaths amongst women worldwide. Nearly
million women worldwide are diagnosed with breast
cancer annually and more than 500,000 die from this
disease [1]. Besides age, reproductive and gynecologic
factors, other risk factors such as family history and
environmental factors including tobacco and alcohol
consumption, as well as overall amount of physical
activity, can greatly modify the risk of developing
breast cancer [2]. In addition, gynecologic diseases
including polycystic ovarian syndrome and
adenomyosis have been found to enhance the risk of
breast cancer [3, 4].
Mammography screening and genetic testing
have limited sensitivity and specificity for estimating
breast cancer risk [2]. It is uncertain as to whether
single nucleotide polymorphism (SNP) genotyping
could more accurately predict breast cancer risk and
guide disease management [5, 6]. Susceptibility to
breast cancer appears to be influenced by certain
SNPs, as well as clinicopathologic status [7]. BRCA1
and BRCA2 gene mutations increase the risk of breast
Int. J. Med. Sci. 2018, Vol. 15
cancer [8, 9]. Fascin-1 (FSCN1) and high-mobility
group box protein 1 (HMGB1) genetic polymorphisms
have also been identified as predictive biomarkers for
breast cancer [10].
Chemokine (C-C motif) ligand 4 (CCL4) is a
protein that is encoded by the CCL4 gene and acts as a
chemoattractant for natural killer cells, monocytes
and various other immune cells in the site of inflamed
or damaged tissue. CCL4 polymorphisms influence
gene expression, protein function and susceptibility to
various diseases, including hepatocellular carcinoma,
oral cancer, and psoriasis [11-14]. CCL4 belongs to a
cluster of genes located in the chromosomal region
17q11-q21. The CCL4 protein acts as the chemokine
being secreted under mitogenic signals and antigens
and attracting monocytes, dendritic cells, natural
killer cells and other effector cells into the site of
inflamed or damaged tissue [15, 16]. On the other
hand, the CCL4 gene polymorphisms has been
associated with risk and development in oral cancer
and hepatocellular carcinoma [12, 17]. Despite the
well-known impact of chemokines on cancer
progression and the recognition that CCL4 gene SNPs
play important roles in a variety of human diseases,
little is known about the association between these
SNPs and the susceptibility to breast cancer and its
progression. In this study, we evaluated the
predictive capacity of three CCL4 SNPs as candidate
biomarkers for breast cancer risk.
Materials and Methods
Participants
Between 2014 and 2016, we collected 314 blood
specimens from patients (cases) diagnosed with breast
cancer at Dongyang People's Hospital. A total of 209
healthy, cancer-free individuals served as controls.
Written informed consent was obtained from all
participants before study entry. The Ethics Committee
of Dongyang People's Hospital granted study
approval. Pathohistologic diagnosis used the World
Health Organization breast tumor classification and
tumors were graded using the Scarff-BloomRichardson method [18]. Breast cancer cases were
categorized by estrogen receptor (ER), progesterone
receptor (PR), human epidermal growth factor
receptor 2 (HER2) and Ki-67 status and grouped
under 1 of 4 subtypes: Luminal A (ER-positive [+]
and/or PR+, HER2-negative [–], Ki-67 <14%); Luminal
B (ER+ and/or PR+, HER2–, Ki-67 ≥14%; or ER+ and/or
PR+, HER2+); HER2-enriched (ER–, PR–, HER2+); or as
triple-negative breast cancer (TNBC; ER–, PR–, HER2–)
[19-21]. A standardized questionnaire at study entry
collected sociodemographic data and electronic medical records provided clinicopathologic information.
1180
Selection of CCL4 polymorphisms
The CCL4 SNPs selected for this study were
identified from multi-allelic copy number variation
(CNV) profiles encompassing the q12 region of
chromosome
17
containing
CCL4
genes.
Nonsynonymous SNPs rs1634507, rs10491121 and
rs1719153 were extracted from a search of the
National Center for Biotechnology Information
(NCBI) dbSNP database.
Genomic DNA extraction
The QIAamp DNA Blood Mini Kit (Qiagen, Inc.,
Valencia, CA, USA) purified genomic DNA from
peripheral blood leukocytes. The DNA was dissolved
in TE buffer (10 mM Tris, 1 mM EDTA; pH 7.8),
quantified by OD260, then stored at –20℃ for further
analysis.
Real-time PCR
The ABI StepOne™ real-time polymerase chain
reaction (PCR) system (Applied Biosystems, Foster
City, CA, USA) assessed sequencing of allelic
discrimination for the CCL4 SNP. The TaqMan assay
used Software Design Specification version 3.0
software (Applied Biosystems) to analyze the
discrimination data. Primers and probes consisted of
rs1634507 “AGTTTTCTTGACCTCATGAATGCTG[G/T]TGAGGCTTTATCCCTCTCTCAGGAA” (product ID: C_7451708_10), rs10491121 “CCTATCCCCT
TCCTGAATTAAGTCC-[A/G]AATATAGTCAGTCT
TTGAGTGTGGA” (product ID: C_11626804_10) and
rs1719153 “TAGGGACTGTTGCACCGAGTTTCAC[A/T]GTTAAGGAAACAGAGGCACAGAGAG”
(product ID: C_12120537_10). PCRs were performed
in a total volume of 10 μL containing Master Mix (5
μL), probes (0.25 μL) and genomic DNA (10 ng). The
real-time PCR reaction included an initial
denaturation step at 95°C for 10 min, then 40
amplification cycles of 95°C for 15 secs and 60°C for 1
min [19, 22].
Statistical analysis
Between-group differences were considered
significant if p-values were less than 0.05. Chi-square
analysis tested for Hardy-Weinberg equilibrium in
the SNP genotype distributions. The Mann-Whitney
U-test and Fisher's exact test were utilized for
between-group demographic comparisons. Multiple
logistic regression models adjusted for confounding
variables estimated adjusted odds ratios (AORs) and
95% confidence intervals (CIs) for associations
between genotype frequencies and the risk of breast
cancer or clinicopathologic characteristics. Haplotype
frequencies were analyzed using Haploview [23]. All
data were analyzed with the software program
Int. J. Med. Sci. 2018, Vol. 15
1181
Statistical Analytic System version 9.1 and are
reported as the sample mean ± the standard deviation
(SD).
Results
All study participants were Chinese Han (Table
1). The majority were nonsmokers and did not
consume alcohol. There was a significantly higher
proportion of younger age participants in the control
group compared with the breast cancer cohort
(p<0.05). Most patients (77.1%) had stage I/II breast
cancer; 22.9% had stage III/IV disease (Table 1). In an
analysis of hormone receptor status, tumors were
mostly ER– (69.7%), PR– (54.1%), or HER2+ (63.1%)
(Table 1).
Table 1. Demographic and clinicopathologic characteristics
among healthy cancer-free controls and patients with breast
cancer.
Variable
Controls
N=209 (%)
Age (years)
Mean ± SD
38.5±16.7
Tobacco smokers
No
202 (96.7)
Yes
7 (3.3)
Alcohol consumption
No
203 (97.1)
Yes
6 (2.9)
Clinical stage
I/II
III/IV
Tumor size
≤T2
>T2
Lymph node status
N0+N1
N2+N3
Distant metastasis
M0
M1
Histological grade
G1+G2
G3+G4
ER status
Positive
Negative
PR status
Positive
Negative
HER2 status
Positive
Negative
Patients
N=314 (%)
Mean ± SD
53.1±11.4
p value
*p<0.05
313 (99.7)
1 (0.3)
*p<0.05
295 (93.9)
19 (6.1)
p>0.05
242 (77.1)
72 (22.9)
298 (94.9)
16 (5.1)
247 (78.7)
67 (21.3)
304 (96.8)
10 (3.2)
218 (69.4)
96 (30.6)
95 (30.3)
219 (69.7)
144 (45.9)
170 (54.1)
198 (63.1)
116 (36.9)
The Mann-Whitney U-test and Fisher’s exact test were used to compare values
between controls and patients with breast cancer. *p < 0.05 was statistically
significant. T2 = tumor >20 mm but ≤50 mm in greatest dimension; N0 = lymph
node-negative; N1 = cancer has spread to 1–3 lymph node(s); N2 = 4–9 lymph
nodes; N3 = ≥10 positive lymph nodes; M0 = noninvasive cancer; M1 = cancer has
metastasized to organs or lymph nodes away from the breast; G1 = well
differentiated (low grade); G2 = moderately differentiated (intermediate grade); G3
= poorly differentiated (high grade); G4 = undifferentiated (high grade); ER =
estrogen receptor; PR = progesterone receptor; HER2 = human epidermal growth
factor receptor 2.
Polymorphism frequencies are shown in Table 2.
All genotypes were in Hardy-Weinberg equilibrium
(p > 0.05). In both study groups, the most frequent
genotypes for SNPs rs10491121, rs1634507 and
rs1719153 were homozygous for A/A, homozygous
for G/G and homozygous for A/A. Analyses that
adjusted for potential confounders found no
significant between-group differences for the
polymorphism frequencies.
Table 2. Distribution frequencies of CCL4 genotypes among
healthy cancer-free controls and patients with breast cancer.
Variable
rs10491121
AA
AG
GG
AG+GG
rs1634507
GG
GT
TT
GT+TT
rs1719153
AA
AT
TT
AT+TT
Controls
N=209 (%)
Patients
N=314 (%)
OR (95% CI)
64 (41)
92 (59)
53 (45.3)
145 (69.4)
79 (34.2)
152 (65.8)
83 (51.2)
235 (74.8)
1.00 (reference)
1.338 (0.88-2.035)
1.269 (0.787-2.044)
1.313 (0.89-1.938)
101 (54.9)
83 (45.1)
25 (19.8)
108 (51.7)
135 (49.5)
138 (50.5)
41 (23.3)
179 (57)
1.00 (reference)
1.244 (0.855-1.810)
1.227 (0.701-2.148)
1.240 (0.873-1.762)
101 (55.5)
81 (44.5)
27 (21.1)
108 (51.7)
149 (52.7)
134 (47.3)
31 (17.2)
165 (52.5)
1.00 (reference)
1.121 (0.771-1.630)
0.778 (0.438-1.382)
1.036 (0.73-1.470)
The odds ratios (ORs) with their 95% confidence intervals (CIs) were estimated by
logistic regression analysis. The adjusted ORs (AORs) with their 95% CIs were
estimated by multiple logistic regression analysis that controlled for tobacco
smoking, alcohol consumption and age.
A comparison of clinicopathologic characteristics
and CCL4 genotypes revealed no significant
differences (Table 3). Similarly, an analysis of CCL4
genotypic frequencies amongst breast cancer subtypes
failed to identify any significant differences between
patients and controls (Table 4). However, among
luminal A and luminal B subtypes, patients carrying
the AG genotype at SNP rs10491121 were less likely to
develop lymph node metastasis compared with AA
genotype carriers (AOR, 0.298; 95% CI: 0.1-0.885)
(Table 5). In addition, patients with the rs10491121
AG + GG genotype were at lower risk of developing
distant metastasis compared with AA genotype
carriers (AOR, 0.106; 95% CI: 0.011-1.038). Moreover,
the presence of the TT haplotype at the SNP rs1719153
(AOR 3.316; 95% CI: 1.12-9.815) increased the
likelihood of developing pathologic grade (G3+G4)
disease (Table 5).
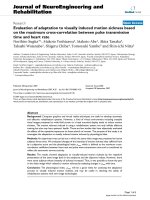
Figure 1 represents the reconstructed linkage
disequilibrium plot of the genotyped polymorphisms
in our study population. In one haploblock, rs1634507
and
rs10491121
displayed
98%
linkage
disequilibrium. CCL4 SNPs rs1634507 and rs1719153
expressed 95% linkage disequilibrium; rs10491121
and rs1719153 expressed 97% linkage disequilibrium
(Fig. 1).
Int. J. Med. Sci. 2018, Vol. 15
1182
Table 3. Odds ratios and their confidence intervals for clinical status and CCL4 genotypic frequencies in patients with breast cancer.
Genotype
rs10491121
AA
AG+GG
rs1634507
GG
GT+TT
rs1719153
AA
AT+TT
Patients
N=314 (%)
Clinical stage
OR (95% CI)
Stage I/II
Stage III/IV
55 (25)
165 (75)
24 (25.5)
70 (74.5)
1.00 (reference)
0.972 (0.558-1.694)
98 (44.5)
122 (55.5)
37 (39.4)
57 (60.6)
1.00 (reference)
1.237 (0.757-2.024)
109 (49.5)
111 (50.5)
40 (42.6)
54 (57.4)
1.00 (reference)
1.326 (0.815-2.157)
Tumor size
rs10491121
AA
AG+GG
rs1634507
GG
GT+TT
rs1719153
AA
AT+TT
≤T2
>T2
76 (25.5)
222 (74.5)
3 (18.8)
13 (81.2)
1.00 (reference)
1.483 (0.412-5.347)
130 (43.6)
168 (56.4)
5 (31.2)
11 (68.8)
1.00 (reference)
1.702 (0.577-5.021)
144 (48.3)
154 (51.7)
5 (31.2)
11 (68.8)
1.00 (reference)
2.057 (0.698-6.065)
Lymph node status
rs10491121
AA
AG+GG
rs1634507
GG
GT+TT
rs1719153
AA
AT+TT
N0+N1
N2+N3
68 (86.1)
215 (91.5)
11 (13.9)
20 (8.5)
1.00 (reference)
0.575 (0.262-1.260)
121 (89.6)
162 (90.5)
14 (10.4)
17 (9.5)
1.00 (reference)
0.907 (0.403-1.911)
136 (91.3)
147 (89.1)
13 (8.7)
18 (10.9)
1.00 (reference)
1.281 (0.605-2.713)
Distant metastasis
rs10491121
AA
AG+GG
rs1634507
GG
GT+TT
rs1719153
AA
AT+TT
M0
M1
74 (93.7)
230 (97.9)
5 (6.3)
5 (2.1)
1.00 (reference)
0.322 (0.91-1.142)
130 (96.3)
174 (97.2)
5 (3.7)
5 (2.8)
1.00 (reference)
0.747 (0.212-2.635)
144 (96.6)
160 (97)
5 (3.4)
5 (3)
1.00 (reference)
0.9 (0.255-3.172)
Histologic grade
rs10491121
AA
AG+GG
rs1634507
GG
GT+TT
rs1719153
AA
AT+TT
G1+G2
G3+G4
58 (73.4)
160 (68.1)
21 (26.6)
75 (31.9)
1.00 (reference)
1.295 (0.732-2.288)
99 (73.3)
119 (66.5)
36 (26.7)
60 (33.5)
1.00 (reference)
1.387 (0.848-2.267)
109 (73.2)
109 (66.1)
40 (26.8)
56 (33.9)
1.00 (reference)
1.4 (0.862-2.274)
The odds ratios (ORs) with their 95% confidence intervals (CIs) were estimated by logistic regression analysis. The adjusted odds ratios (AORs) with their 95% CIs were
estimated by multiple logistic regression analysis that controlled for smoking, consumption and age.
T2 = tumor >20 mm but ≤50 mm in greatest dimension; N0 = lymph node-negative; N1 = cancer has spread to 1–3 lymph node(s); N2 = 4–9 lymph nodes; N3 = ≥10 positive
lymph nodes; M0 = noninvasive cancer; M1 = cancer has metastasized to organs or lymph nodes away from the breast; G1 = well differentiated (low grade); G2 = moderately
differentiated (intermediate grade); G3 = poorly differentiated (high grade); G4 = undifferentiated (high grade).
Int. J. Med. Sci. 2018, Vol. 15
1183
Table 4. Distribution frequencies of CCL4 genotypes in breast cancer subtypes.
Variable Control N= 209(%) Patients N= 220(%)
Lumina A + Lumina B
rs10491121
AA
64 (53.8)
55 (46.2)
AG
92 (45.8)
109 (54.2)
GG
53 (48.6)
56 (51.4)
AG+GG 145 (46.8)
165 (53.2)
rs1634507
GG
101 (50.8)
98 (49.2)
GT
83 (46.6)
95 (53.4)
TT
25 (48.1)
27 (49.8)
GT+TT 108 (47)
122 (53)
rs1719153
AA
101 (48.1)
109 (51.9)
AT
81 (46.3)
94 (53.7)
TT
27 (61.4)
17 (38.6)
AT+TT 108 (49.3)
111 (50.7)
OR (95% CI)
1.00 (reference)
1.379 (0.875-2.173)
1.23 (0.731-2.069)
1.324 (0.867-2.023)
1.00 (reference)
1.18 (0.787-1.768)
1.113 (0.604-2.050)
1.164 (0.796-1.702)
1.00 (reference)
1.075 (0.719-1.607)
0.583 (0.3-1.134)
0.952 (0.652-1.391)
Variable Control N= 209(%) Patients N= 94(%)
HER2 overexpression + TNBC
rs10491121
AA
64 (76.2)
20 (23.8)
AG
92 (74.2)
32 (25.8)
GG
53 (72.6)
20 (27.4)
AG+GG 145 (73.6)
52 (26.4)
rs1634507
GG
101 (77.7)
29 (22.3)
GT
83 (69.7)
36 (30.3)
TT
25 (78.1)
7 (21.9)
GT+TT 108 (74.4)
72 (25.6)
rs1719153
AA
101 (75.9)
32 (24.1)
AT
81 (69.8)
35 (30.2)
TT
27 (84.4)
5 (15.6)
AT+TT 108 (73)
40 (27)
OR (95% CI)
1.00 (reference)
1.113 (0.585-2.118)
1.208 (0.588-2.478)
1.148 (0.634-2.078)
1.00 (reference)
1.511 (0.855-2.668)
0.975 (0.383-2.482)
1.387 (0.805-2.388)
1.00 (reference)
1.364 (0.778-2.391)
0.584 (0.208-1.643)
1.169 (0.682-2.002)
The odds ratios (ORs) with their 95% confidence intervals (CIs) were estimated by logistic regression analysis. The adjusted odds ratios (AORs) with their 95% CIs were
estimated by multiple logistic regression analysis that controlled for smoking, consumption and age.
HER2 = human epidermal growth factor receptor 2; TNBC = triple-negative breast cancer.
Table 5. Odds ratios and their confidence intervals for clinical status and CCL4 genotypic frequencies in breast cancer subtypes.
Variable
Luminal A + Luminal B
N=220 (%)
Clinical Stage
Stage I/II
Stage III/IV
OR (95% CI)
HER2 overexpression + TNBC
N=94 (%)
Clinical Stage
Stage I/II
Stage III/IV
OR (95% CI)
40 (72.7)
93 (85.3)
40 (71.4)
133 (80.6)
15 (27.3)
16 (14.7)
16 (28.6)
32 (19.4)
1.00 (reference)
0.459 (0.207-1.017)
1.067 (0.465-2.445)
0.642 (0.316-1.302)
19 (79.2)
27 (62.8)
23 (85.2)
50 (71.4)
5 (20.8)
16 (37.2)
4 (14.8)
20 (28.6)
1.00 (reference)
2.252 (0.704-7.206)
0.661 (0.155-2.813)
1.52 (0.499-4.627)
77 (78.6)
74 (77.9)
22 (81.5)
96 (78.7)
21 (21.4)
21 (22.1)
5 (18.5)
26 (21.3)
1.00 (reference)
1.041 (0.525-2.062)
0.833 (0.282-2.464)
0.993 (0.519-1.899)
29 (78.4)
28 (65.1)
12 (85.7)
40 (70.2)
8 (21.6)
15 (34.9)
2 (14.3)
17 (29.8)
1.00 (reference)
1.942 (0.712-5.294)
0.604 (0.112-3.272)
1.541 (0.586-4.051)
85 (78)
74 (78.7)
14 (82.4)
88 (79.3)
Tumor size
≤T2
24 (22)
20 (21.3)
3 (17.6)
23 (20.7)
1.00 (reference)
0.957 (0.49-1.871)
0.759 (0.201-2.86)
0.926 (0.486-1.764)
8 (20)
15 (37.5)
2 (14.3)
17 (31.5)
1.00 (reference)
2.4 (0.879-6.556)
0.667 (0.124-3.597)
1.838 (0.701-4.821)
>T2
OR (95% CI)
32 (80)
25 (62.5)
12 (85.7)
37 (68.5)
Tumor size
≤T2
>T2
OR (95% CI)
53 (96.4)
106 (97.2)
54 (96.4)
160 (97)
2 (3.6)
3 (2.8)
2 (3.6)
5 (3)
1.00 (reference)
0.75 (0.122-4.626)
0.981 (0.133-7.225)
0.828 (0.156-4.395)
23 (95.8)
38 (88.4)
24 (88.9)
62 (88.6)
1 (4.2)
5 (11.6)
3 (11.1)
8 (11.4)
1.00 (reference)
3.026 (0.332-27.548)
2.875 (0.279-29.677)
2.968 (0.352-25.054)
95 (96.9)
92 (96.8)
26 (96.3)
118 (96.7)
3 (3.1)
3 (3.2)
1 (3.7)
4 (3.3)
1.00 (reference)
1.033 (0.203-5.248)
1.218 (0.122-12.201)
1.073 (0.235-4.914)
35 (94.6)
37 (86)
13 (92.9)
50 (87.7)
2 (5.4)
6 (14)
1 (7.1)
7 (12.3)
1.00 (reference)
2.838 (0.537-15.01)
1.346 (0.112-16.13)
2.45 (0.48-12.501)
106 (97.2)
3 (2.8)
91 (96.8)
3 (3.2)
16 (94.1)
1 (5.9)
107 (96.4)
4 (3.6)
Lymph node status
N0+N1
N2+N3
1.00 (reference)
1.165 (0.229-5.913)
2.208 (0.216-22.548)
1.321 (0.289-6.044)
1.00 (reference)
3.353 (0.634-17.738)
1.462 (0.122-17.482)
2.83 (0.555-14.423)
OR (95% CI)
38 (95)
2 (5)
34 (85)
6 (15)
13 (92.9)
1 (7.1)
47 (87)
7 (13)
Lymph node status
N0+N1
N2+N3
46 (83.6)
103 (94.5)
48 (85.7)
151 (91.5)
9 (16.4)
6 (5.5)
8 (14.3)
14 (8.5)
1.00 (reference)
0.298 (0.1-0.885)*
0.852 (0.303-2.397)
0.474 (0.193-1.166)
22 (91.7)
37 (86)
27 (100)
64 (91.4)
2 (8.3)
6 (14)
0 (0)
6 (8.6)
1.00 (reference)
1.784 (0.331-9.619)
0.917 (0.813-1.034)
1.031 (0.194-5.489)
87 (88.8)
11 (11.2)
1.00 (reference)
34 (91.9)
3 (8.1)
1.00 (reference)
rs10491121
AA
AG
GG
AG+GG
rs1634507
GG
GT
TT
GT+TT
rs1719153
AA
AT
TT
AT+TT
rs10491121
AA
AG
GG
AG+GG
rs1634507
GG
GT
TT
GT+TT
rs1719153
AA
AT
TT
AT+TT
OR (95% CI)
rs10491121
AA
AG
GG
AG+GG
rs1634507
GG
Int. J. Med. Sci. 2018, Vol. 15
Variable
1184
Luminal A + Luminal B
N=220 (%)
87 (91.6)
8 (8.4)
23 (85.2)
4 (14.8)
110 (90.2)
23 (10.5)
GT
TT
GT+TT
HER2 overexpression + TNBC
N=94 (%)
38 (88.4)
5 (11.6)
14 (100)
0 (0)
52 (91.2)
5 (8.8)
0.727 (0.279-1.896)
1.375 (0.401-4.721)
0.863 (0.363-2.049)
1.491 (0.331-6.712)
0.919 (0.835-1.011)
1.09 (0.244-4.861)
rs1719153
AA
AT
TT
AT+TT
99 (90.8)
10 (9.2)
84 (89.4)
10 (10.6)
14 (82.4)
3 (17.6)
98 (88.3)
13 (11.7)
Distant metastasis
M0
M1
1.00 (reference)
1.179 (0.468-2.968)
2.121 (0.52-8.658)
1.313 (0.55-3.136)
1.00 (reference)
1.762 (0.392-7.929)
0.925 (0.847-1.01)
1.259 (0.283-5.605)
OR (95% CI)
37 (92.5)
3 (7.5)
35 (87.5)
5 (12.5)
14 (100)
0 (0)
49 (90.7)
5 (9.3)
Distant metastasis
M0
M1
52 (94.5)
109 (100)
55 (98.2)
164 (99.4)
3 (5.5)
0 (0)
1 (1.8)
1 (0.6)
1.00 (reference)
0.945 (0.887-1.007)*
0.315 (0.032-3.127)
0.106 (0.011-1.038)*
22 (91.7)
40 (93)
26 (96.3)
66 (94.3)
2 (8.3)
3 (7)
1 (3.7)
4 (5.7)
1.00 (reference)
0.825 (0.128-5.317)
0.423 (0.036-4.985)
0.667 (0.114-3.893)
95 (96.9)
95 (100)
26 (96.3)
121 (99.2)
3 (3.1)
0 (0)
1 (3.7)
1 (0.8)
1.00 (reference)
0.969 (0.936-1.004)
1.218 (0.122-12.201)
0.262 (0.027-2.556)
35 (94.6)
39 (90.7)
14 (100)
53 (93)
2 (5.4)
4 (9.3)
0 (0)
4 (7)
1.00 (reference)
1.795 (0.31-10.408)
0.946 (0.876-1.022)
1.321 (0.229-7.602)
106 (97.2)
3 (2.8)
94 (100)
0 (0)
16 (94.1)
1 (5.9)
110 (99.1)
1 (0.9)
Histological grade
G1+G2
G3+G4
1.00 (reference)
0.972 (0.942-1.004)
2.208 (0.216-22.548)
0.321 (0.033-3.137)
1.00 (reference)
2.111 (0.364-12.24)
0.95 (0.885-1.02)
1.52 (0.264-8.738)
OR (95% CI)
38 (95)
2 (5)
36 (90)
4 (10)
14 (100)
0 (0)
50 (92.6)
4 (7.4)
Histological grade
G1+G2
G3+G4
45 (81.8)
95 (87.2)
40 (71.4)
135 (81.8)
10 (18.2)
14 (12.8)
16 (28.6)
30 (18.2)
1.00 (reference)
0.663 (0.274-1.608)
1.8 (0.734-4.417)
1 (0.453-2.206)
13 (54.2)
16 (37.2)
9 (33.3)
25 (35.7)
11 (45.8)
27 (62.8)
18 (66.7)
45 (64.3)
1.00 (reference)
1.994 (0.724-5.495)
2.364 (0.761-7.343)
2.127 (0.831-5.446)
81 (82.7)
81 (85.3)
18 (66.7)
99 (81.1)
17 (17.3)
14 (14.7)
9 (33.3)
23 (18.9)
1.00 (reference)
0.824 (0.381-1.781)
2.382 (0.916-6.196)
1.107 (0.554-2.212)
18 (48.6)
16 (37.2)
4 (28.6)
20 (35.1)
19 (51.4)
27 (62.8)
10 (71.4)
37 (64.9)
1.00 (reference)
1.599 (0.654-3.906)
2.368 (0.628-8.926)
1.753 (0.754-4.074)
90 (82.6)
80 (85.1)
10 (58.8)
90 (81.1)
19 (17.4)
14 (14.9)
7 (41.2)
21 (18.9)
1.00 (reference)
0.829 (0.39-1.76)
3.316 (1.12-9.815)*
1.105 (0.557-2.195)
19 (47.5)
13 (32.5)
6 (42.9)
19 (35.2)
21 (52.5)
27 (67.5)
8 (57.1)
35 (64.8)
1.00 (reference)
1.879 (0.759-4.655)
1.206 (0.354-4.115)
1.667 (0.723-3.841)
OR (95% CI)
rs10491121
AA
AG
GG
AG+GG
rs1634507
GG
GT
TT
GT+TT
rs1719153
AA
AT
TT
AT+TT
OR (95% CI)
rs10491121
AA
AG
GG
AG+GG
rs1634507
GG
GT
TT
GT+TT
rs1719153
AA
AT
TT
AT+TT
The odds ratios (ORs) with their 95% confidence intervals (CIs) were estimated by logistic regression analysis. The adjusted odds ratios (AORs) with their 95% CIs were
estimated by multiple logistic regression analysis that controlled for smoking, consumption and age. * p<0.05.
HER2 = human epidermal growth factor receptor 2; TNBC = triple-negative breast cancer; T2 = tumor >20 mm but ≤50 mm in greatest dimension; N0 = lymph node-negative;
N1 = cancer has spread to 1–3 lymph node(s); N2 = 4–9 lymph nodes; N3 = ≥10 positive lymph nodes; M0 = noninvasive cancer; M1 = cancer has metastasized to organs or
lymph nodes away from the breast; G1 = well differentiated (low grade); G2 = moderately differentiated (intermediate grade); G3 = poorly differentiated (high grade); G4 =
undifferentiated (high grade).
Discussion
Figure 1. Linkage disequilibrium patterns of three single nucleotide
polymorphisms in the CCL4 gene.
CCL4, also known as macrophage inflammatory
protein-1β (MIP-1β), belongs to the pro-inflammatory
CC subfamily. MIP proteins recruit pro-inflammatory
cells and thus play a crucial role in acute and chronic
inflammatory responses in various conditions
including asthma, granuloma formation, wound
healing, arthritis, multiple sclerosis, pneumonia, and
psoriasis [16]. Accumulating evidences indicated
CCL4 expression associated with cancer progression
such as oral cancer and hepatocellular carcinoma [12,
17]. We have previously suggested that CCL4 gene
polymorphisms influence susceptibility to oral cancer
and hepatocellular carcinoma and affect their
progression [11, 12]. We found that CCL4 rs1634507
Int. J. Med. Sci. 2018, Vol. 15
G/T polymorphism increased a risk in oral-cancer
susceptibility,
but
CCL4
rs10491121
A/G
polymorphism decreased a risk in hepatocellular
carcinoma. Now, the findings from this study indicate
that CCL4 SNPs may serve as candidate biomarkers
for susceptibility to breast cancer.
The 5-year relative survival rate for breast cancer
has gradually increased since the early 1990s; between
2007 and 2011 it was ~89.2%. As breast cancer
prognosis depends upon the disease stage at the time
of diagnosis, increasing screening rates and making
genetic testing more widely available increase the
chances of early diagnosis [24, 25]. Our study is the
first to examine the expression of SNPs rs1634507,
rs10491121 and rs1719153 and their possible
association with the development of breast cancer.
Our investigation into possible associations between
these CCL4 SNPs, clinicopathologic markers, and
disease susceptibility failed to find any significant
differences between patients and healthy controls.
Moreover, CCL4 SNPs did not differ significantly
according to breast cancer clinical aspects. Amongst
luminal A and luminal B subtypes, patients carrying
the AG haplotype at SNP rs10491121 were less likely
to develop lymph node metastasis compared with
patients with the AA haplotype, while patients
carrying the AG + GG haplotype at rs10491121 were
less likely to develop distant metastasis. The presence
of the AT haplotype at the SNP rs1719153 increased
the likelihood of developing pathologic grade
(G3+G4) disease.
Linkage disequilibrium is expressed across the
human genome. Thus, loci can be used as genetic
markers to locate adjacent variants that participate in
the detection and treatment of disease. Haplotype
analyses clarify genetic contribution to disease
susceptibility [26, 27]. We observed 98% linkage
disequilibrium between rs1634507 and rs10491121,
95% linkage disequilibrium between rs1634507 and
rs1719153, and 97% between rs10491121 and
rs1719153. These results suggest that these CCL4
haplotypes play an important role in breast cancer
development.
This is the first study to demonstrate a
correlation between CCL4 polymorphisms and breast
cancer risk. CCL4 may prove to be a diagnostic marker
and therapeutic target for breast cancer therapy.
Acknowledgments
This work was supported by two grants from
China Medical University Hospital (CMU106-S-05) of
Taiwan and Medical and Health Science and
Technology
Project
of
Zhejiang
Province
(2012KYB230) of China.
1185
Competing Interests
The authors have declared that no competing
interest exists.
References
1.
2.
3.
4.
5.
6.
7.
8.
9.
10.
11.
12.
13.
14.
15.
16.
17.
18.
19.
20.
21.
22.
23.
24.
25.
Jemal A, Bray F, Center MM, Ferlay J, Ward E, Forman D. Global cancer
statistics. CA Cancer J Clin. 2011; 61: 69-90.
Amir E, Freedman OC, Seruga B, Evans DG. Assessing women at high risk of
breast cancer: a review of risk assessment models. J Natl Cancer Inst. 2010; 102:
680-91.
Shen CC, Yang AC, Hung JH, Hu LY, Tsai SJ. A nationwide population-based
retrospective cohort study of the risk of uterine, ovarian and breast cancer in
women with polycystic ovary syndrome. Oncologist. 2015; 20: 45-9.
Deng Y, Xu H, Zeng X. Induced abortion and breast cancer: An updated
meta-analysis. Medicine (Baltimore). 2018; 97: e9613.
Yang MD, Lin KC, Lu MC, Jeng LB, Hsiao CL, Yueh TC, et al. Contribution of
matrix metalloproteinases-1 genotypes to gastric cancer susceptibility in
Taiwan. BioMedicine. 2017; 7: 10.
Chen CM, Lai CH, Wu HJ, Wu LT. Genetic characteristic of class 1 integrons in
proteus mirabilis isolates from urine samples. BioMedicine. 2017; 7: 9.
Chang WS, Liu LC, Hsiao CL, Su CH, Wang HC, Ji HX, et al. The contributions
of the tissue inhibitor of metalloproteinase-1 genotypes to triple negative
breast cancer risk. BioMedicine. 2016; 6: 4.
Nagy R, Sweet K, Eng C. Highly penetrant hereditary cancer syndromes.
Oncogene. 2004; 23: 6445-70.
Antoniou AC, Pharoah PD, Narod S, Risch HA, Eyfjord JE, Hopper JL, et al.
Breast and ovarian cancer risks to carriers of the BRCA1 5382insC and
185delAG and BRCA2 6174delT mutations: a combined analysis of 22
population based studies. J Med Genet. 2005; 42: 602-3.
Wang CQ, Tang CH, Wang Y, Jin L, Wang Q, Li X, et al. FSCN1 gene
polymorphisms: biomarkers for the development and progression of breast
cancer. Scientific reports. 2017; 7: 15887.
Wang B, Chou Y-E, Lien M-Y, Su C-M, Yang S-F, Tang C-H. Impacts of CCL4
gene polymorphisms on hepatocellular carcinoma susceptibility and
development. International journal of medical sciences. 2017; 14: 880.
Lien M-Y, Lin C-W, Tsai H-C, Chen Y-T, Tsai M-H, Hua C-H, et al. Impact of
CCL4 gene polymorphisms and environmental factors on oral cancer
development and clinical characteristics. Oncotarget. 2017; 8: 31424.
Pedrosa E, Carretero-Iglesia L, Boada A, Colobran R, Faner R, Pujol-Autonell I,
et al. CCL4L polymorphisms and CCL4/CCL4L serum levels are associated
with psoriasis severity. Journal of Investigative Dermatology. 2011; 131:
1830-7.
Lien MY, Tsai HC, Chang AC, Tsai MH, Hua CH, Wang SW, et al. Chemokine
CCL4 Induces Vascular Endothelial Growth Factor C Expression and
Lymphangiogenesis by miR-195-3p in Oral Squamous Cell Carcinoma.
Frontiers in immunology. 2018; 9: 412.
Menten P, Wuyts A, Van Damme J. Macrophage inflammatory protein-1.
Cytokine & Growth Factor Reviews. 2002; 13: 455-81.
Maurer M, Von Stebut E. Macrophage inflammatory protein-1. Int J Biochem
Cell Biol. 2004; 36: 1882-6.
Borzı̀ RM, Mazzetti I, Macor S, Silvestri T, Bassi A, Cattini L, et al. Flow
cytometric analysis of intracellular chemokines in chondrocytes in vivo:
constitutive expression and enhancement in osteoarthritis and rheumatoid
arthritis. FEBS Letters. 1999; 455: 238-42.
Elston CW, Ellis IO. Pathological prognostic factors in breast cancer. I. The
value of histological grade in breast cancer: experience from a large study with
long-term follow-up. Histopathology. 1991; 19: 403-10.
Wang CQ, Tang CH, Wang Y, Jin L, Wang Q, Li X, et al. FSCN1 gene
polymorphisms: biomarkers for the development and progression of breast
cancer. Sci Rep. 2017; 7: 15887.
Wang CQ, Li Y, Huang BF, Zhao YM, Yuan H, Guo D, et al. EGFR conjunct
FSCN1 as a Novel Therapeutic Strategy in Triple-Negative Breast Cancer.
Scientific reports. 2017; 7: 15654.
Wang CQ, Tang CH, Chang HT, Li XN, Zhao YM, Su CM, et al. Fascin-1 as a
novel diagnostic marker of triple-negative breast cancer. Cancer Med. 2016; 5:
1983-8.
Hu W, Liu PY, Yang YC, Chen PC, Su CM, Chao CC, et al. Association of
HMGB1 Gene Polymorphisms with Lung Cancer Susceptibility and Clinical
Aspects. Int J Med Sci. 2017; 14: 1197-202.
Wang LH, Wu MH, Chen PC, Su CM, Xu G, Huang CC, et al. Prognostic
significance of high-mobility group box protein 1 genetic polymorphisms in
rheumatoid arthritis disease outcome. International journal of medical
sciences. 2017; 14: 1382-8.
Wood DE. National Comprehensive Cancer Network (NCCN) Clinical
Practice Guidelines for Lung Cancer Screening. Thorac Surg Clin. 2015; 25:
185-97.
Moyer VA. Medications to decrease the risk for breast cancer in women:
recommendations from the U.S. Preventive Services Task Force
recommendation statement. Ann Intern Med. 2013; 159: 698-708.
Int. J. Med. Sci. 2018, Vol. 15
1186
26. Shifman S, Bronstein M, Sternfeld M, Pisante-Shalom A, Lev-Lehman E,
Weizman A, et al. A highly significant association between a COMT haplotype
and schizophrenia. Am J Hum Genet. 2002; 71: 1296-302.
27. Zhang L, Zhang Y, Tang CH, Su CM. RAD52 gene polymorphisms are
associated with risk of colorectal cancer in a Chinese Han population.
Medicine (Baltimore). 2017; 96: e8994.