Association between sarcopenia and hearing thresholds in postmenopausal women
Bạn đang xem bản rút gọn của tài liệu. Xem và tải ngay bản đầy đủ của tài liệu tại đây (523.94 KB, 7 trang )
Int. J. Med. Sci. 2017, Vol. 14
Ivyspring
International Publisher
470
International Journal of Medical Sciences
2017; 14(5): 470-476. doi: 10.7150/ijms.18048
Research Paper
Association between sarcopenia and hearing thresholds
in postmenopausal women
Seok Hui Kang1*, Da Jung Jung2*, Kyu Hyang Cho1, Jong Won Park1, Kyu-Yup Lee2, and Jun Young Do1
1.
2.
Division of Nephrology, Department of Internal Medicine, Yeungnam University Hospital, Daegu, Republic of Korea;
Department of Otorhinolaryngology-Head and Neck Surgery, School of Medicine, Kyungpook National University Hospital, Daegu, Republic of Korea.
* These authors contributed equally to this work.
Corresponding author: Jun-Young Do, MD, Department of Internal Medicine, Yeungnam University Hospital, 317-1 Daemyung-Dong, Nam-Ku, Daegu
705-717, Korea Fax: +82-53-654-8386, Phone: +82-53-680-3844, E-mail:
© Ivyspring International Publisher. This is an open access article distributed under the terms of the Creative Commons Attribution (CC BY-NC) license
( See for full terms and conditions.
Received: 2016.10.23; Accepted: 2017.01.31; Published: 2017.04.09
Abstract
Background: Given the association between metabolic disturbance and sarcopenia, sarcopenia
may be intrinsically associated with the prevalence of HL. However, few studies describe the
association between sarcopenia and HL. The aim of this study was to evaluate the clinical
association between sarcopenia and HL in postmenopausal Korean women.
Patients and Methods: A total of 4,038 women were ultimately included in this study. All
participants were postmenopausal. Participants were divided into two groups based on criteria
from the Foundation for the National Institute of Health Sarcopenia Project: a normal group
(sarcopenia index ≥ 0.512) and a sarcopenia group (sarcopenia index < 0.512). Low-frequency
(Low-Freq), mid-frequency (Mid-Freq), and high-frequency (High-Freq) values were obtained. The
average hearing threshold (AHT) was calculated as the pure tone average at the 4 frequencies of
0.5 kHz, 1 kHz, 2 kHz, and 3 kHz. Mild HL was as an AHT of 24 to 40 dB; moderate-to-profound
HL was defined as an AHT of 40 dB or greater.
Results: Of the 4,038 participants, 272 (6.7%) were allocated to the sarcopenia group, leaving
3,766 (93.3%) in the normal group. The groups differed significantly in terms of having
hypertension (775 [20.6%] vs. 108 [39.7%]; P < 0.001) or metabolic syndrome (817 [21.7%] vs. 110
[40.4%]; P < 0.001) in the normal and sarcopenia groups, respectively. Visceral fat area (cm3) in the
normal and sarcopenia groups was 99.0 ± 21.9 cm3 and 117.0 ± 21.8 cm3 , respectively (P < 0.001).
The hsCRP level was higher in the sarcopenia group than in the normal group. For univariate and
multivariate analyses, all 4 hearing thresholds were higher in the sarcopenia group than in the
normal group. In addition, linear regression analyses showed Low-Freq, Mid-Freq, and High-Freq
to be inversely correlated with the sarcopenia index. The unadjusted OR for mild HL was 2.692
(95% CI, 1.963–3.692; P < 0.001) in the sarcopenia group relative to the normal group, with an
adjusted OR of 1.584 (95% CI, 1.131–2.217; P = 0.007). The unadjusted OR for
moderate-to-profound HL in the sarcopenia group relative to the normal group was 6.246 (95%
CI, 4.530–8.612; P < 0.001); the adjusted OR was 2.667 (95% CI, 1.866–3.812; P < 0.001).
Conclusion: Sarcopenia may be associated with HL. It may be beneficial to perform screening
audiometry in patients with sarcopenia.
Key words: Sarcopenia, Hearing loss, Postmenopausal women, Hearing threshold.
Background
Sarcopenia, defined as decreased muscle mass,
strength, and function, is a common pathologic or
physiologic phenomenon in older people [1]. It can
result in increased disability, hospitalization,
comorbidity, and mortality. Initially, sarcopenia was
defined as the loss of muscle mass associated with
Int. J. Med. Sci. 2017, Vol. 14
aging, but recent studies have shown an association
between sarcopenia and various diseases [2-5].
Several factors, such as malnutrition, hormonal
imbalance, and low vitamin D levels, are associated
with the development of sarcopenia. In addition,
recent studies have shown sarcopenia to be associated
with metabolic disturbances such as atherosclerosis,
insulin resistance, and dyslipidemia [6-8].
Hearing loss (HL) has a prevalence of
approximately 4.9-17.0%, making it a common public
health problem. It is associated with decreased
communication and decreased quality of life [9-11].
Aging, genetic factors, and use of ototoxic
medications are well-known risk factors for HL.
Recently, studies have also investigated the
association between various metabolic disturbances
and HL [12-15]. Metabolic disturbances are strongly
related to cardiovascular disorders which are, in turn,
associated with decreased blood supply to both
cochlea and auditory nerve; this may result in the
development of HL [16].
Given the association between metabolic
disturbance and sarcopenia, sarcopenia may be
intrinsically associated with the prevalence of HL.
However, few studies describe the association
between sarcopenia and HL. The aim of this study
was to evaluate the clinical association between
sarcopenia and HL in postmenopausal Korean
women.
Patients and Methods
Study population
Data was collected from the medical records of
10,212 women who underwent voluntary routine
health examinations at Yeungnam University
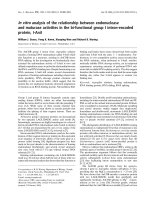
Hospital between June 2008 and April 2014 (Figure 1).
If patients underwent multiple examinations, data
from the initial visit were used. Participants were
excluded if aged younger than 50 (n = 4,842) or older
than 80 years (n = 89), or if no data could be provided
for sarcopenia or hearing thresholds (n = 1,243). A
total of 4,038 women were ultimately included in this
study. All participants were postmenopausal. Ethical
approval for this study was obtained from the
institutional review board of Yeungnam University
Hospital. The board waived the need for informed
consent, as the subjects’ records and information were
anonymized and de-identified prior to analysis.
Study variables
Clinical and laboratory data collected during
clinical examination included the following: age,
serum creatinine (mg/dL), body mass index (BMI,
kg/m2), fasting blood glucose (mg/dL), total
cholesterol (mg/dL), high-density lipoprotein (HDL)
471
cholesterol levels (mg/dL), triglyceride levels
(mg/dL), high sensitivity C-reactive protein levels
(hsCRP, mg/dL), systolic blood pressure (mmHg),
diastolic blood pressure (mmHg), appendicular lean
mass (kg), visceral fat area (cm3), and hearing
thresholds.
Figure 1. Study flow chart.
Appendicular lean mass and visceral fat area
was measured using multi-frequency bioimepdance
analysis (In-Body 720; Biospace, Seoul, Korea).
Sarcopenia index was calculated as appendicular lean
mass (kg) divided by BMI (kg/m2). Participants were
divided into two groups based on criteria from the
Foundation for the National Institute of Health
Sarcopenia Project: a normal group (sarcopenia index
≥ 0.512) and a sarcopenia group (sarcopenia index <
0.512) [17]. Serum creatinine levels were measured
using a Hitachi Automatic Analyzer (alkaline picrate,
Jaffé kinetic). The estimated glomerular filtration rate
(eGFR) was calculated using the Chronic Kidney
Disease Epidemiology Collaboration (CKD-EPI)
equation [18]. Chronic kidney disease was defined as
an eGFR < 60 mL/min/1.73 m2. Diabetes mellitus
(DM) was defined as a fasting blood glucose level ≥
126 mg/dL or a self-reported history of DM.
Hypertension was defined as a systolic blood pressure
measurement of ≥ 140 mmHg or a diastolic
measurement of ≥ 90 mmHg or a self-reported history
of hypertension. The National Cholesterol Education
Program Adult Treatment Panel III guidelines were
used to define the metabolic syndrome [18].
Hearing thresholds were measured using an
automatic audiometer at 0.5 kHz, 1 kHz, 2 kHz, 3
kHz, 4 kHz, and 6 kHz. None of the participants had
been receiving ototoxic medication and none had ear
disease (e.g., chronic otitis media). Hearing was tested
in both ears of each participant. Low-frequency
(Low-Freq),
mid-frequency
(Mid-Freq),
and
high-frequency (High-Freq) values were obtained
calculating the pure tone averages at 0.5 and 1 kHz, 2
and 3 kHz, and 4 and 6 kHz, respectively. The average
Int. J. Med. Sci. 2017, Vol. 14
hearing threshold (AHT) was calculated as the pure
tone average at the 4 frequencies of 0.5 kHz, 1 kHz, 2
kHz, and 3 kHz. Mild HL was as an AHT of 24 to 40
dB; moderate-to-profound HL was defined as an AHT
of 40 dB or greater.
Statistical analyses
The data were analyzed using the Statistical
package for the Social Sciences software package
(SPSS v.21, Chicago, IL., USA). Categorical variables
were expressed as both counts and percentages.
Continuous variables were expressed as the mean ±
standard deviation (SD) or standard error (SE). The
Pearson’s χ2 or Fisher’s exact test was used to analyze
categorical variables, as appropriate. For continuous
variables, Student’s t-test was used to compare the
means.
Linear regression analysis was performed to
assess independent predictors of hearing thresholds.
Logistic regression analyses were used to estimate
odds ratios (OR) and 95% confidence intervals (CI),
which were then used to determine the association
between sarcopenia and HL.
The multivariate analysis was adjusted for age,
diabetes mellitus, hypertension, eGFR, total
cholesterol, HDL cholesterol, and triglyceride level.
Multivariate analyses using analyses of covariance,
multiple linear regression, or multiple logistic
regression were used determine the independent
predictors of HL. Discrimination– which is the ability
of the model to differentiate between participants
who have HL and those who do not –was examined
using the area under the receiver operating
characteristic (AUROC) curve. AUROC analysis was
also performed in order to calculate sensitivity and
specificity. The AUROC was calculated using the
MedCalc software package (v.11.6.1.0, MedCalc,
Mariakerke, Belgium). A P-value < 0.05 was
considered statistically significant.
Results
Clinical characteristics of participants
Of the 4,038 participants, 272 (6.7%) were
allocated to the sarcopenia group, leaving 3,766
(93.3%) in the normal group (Table 1). Sarcopenia
index in the normal and sarcopenia groups was 0.656
± 0.080 and 0.479 ± 0.030, respectively. Age, BMI,
fasting blood glucose, total cholesterol, triglyceride
levels, and systolic and diastolic blood pressure were
higher in the sarcopenia group than in the normal
group. HDL cholesterol level and eGFR were lower in
472
the sarcopenia group than in the normal group. In the
normal group, 396 (10.5%) participants had DM, vs. 51
(18.8%) in the sarcopenia group (P < 0.001). The
groups also differed significantly in terms of having
hypertension (775 [20.6%] vs. 108 [39.7%]; P < 0.001)
or metabolic syndrome (817 [21.7%] vs. 110 [40.4%]; P
< 0.001) in the normal and sarcopenia groups,
respectively. The number of metabolic syndrome
components in the normal and sarcopenia groups was
1.62 ± 1.12 and 2.23 ± 0.98, respectively (P < 0.001).
Visceral fat area (cm3) in the normal and sarcopenia
groups was 99.0 ± 21.9 cm3 and 117.0 ± 21.8 cm3 ,
respectively (P < 0.001). The hsCRP level was higher
in the sarcopenia group than in the normal group.
Table 1. Clinical characteristics of participants
Age (years)
Body mass index (kg/m2)
Fasting blood glucose (mg/dL)
Systolic blood pressure (mmHg)
Diastolic blood pressure (mmHg)
eGFR(mL/min/1.73 m2)
Total cholesterol (mg/dL)
Triglyceride (mg/dL)
HDL cholesterol (mg/dL)
hsCRP (mg/dL)
Sarcopenia index
Normal
(n = 3,766)
59.5 ± 7.4
23.8 ± 2.8
95.2 ± 21.6
120 ± 15
76 ± 11
91.2 ± 26.0
208.0 ± 37.8
116.7 ± 76.9
59.2 ± 15.0
0.16 ± 0.55
0.656 ± 0.080
Sarcopenia
(n = 272)
67.7 ± 7.6
26.7 ± 3.8
100.4 ± 26.0
128 ± 16
80 ± 11
87.6 ± 19.7
213.9 ± 39.6
135.4 ± 71.9
56.7 ± 15.1
0.31 ± 1.22
0.479 ± 0.030
P-value*
<0.001
<0.001
<0.001
<0.001
<0.001
0.027
0.013
0.010
<0.001
<0.001
<0.001
Data are expressed as numbers (percentages) for categorical variables and mean ±
standard deviations for continuous variables.
*P values were tested by student t-test. Abbreviations: eGFR, estimated glomerular
filtration rate; HDL, high-density lipoprotein; hsCRP, high sensitivity C-reactive
protein.
Association between sarcopenia and hearing
thresholds
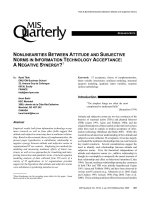
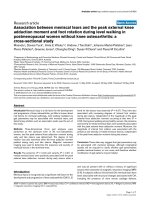
Hearing thresholds (mean ± SE) in the normal
and sarcopenia groups were 25.6 ± 0.2 dB and 34.6 ±
1.0 dB in Low-Freq, 28.8 ± 0.2 dB and 41.1 ± 1.2 dB in
Mid-Freq, 35.2 ± 0.3 dB and 51.6 ± 1.2 dB in High-Freq,
and 27.2 ± 0.2 dB and 37.9 ± 1.0 dB in AHT (Figure 2).
Multivariate analysis revealed that hearing thresholds
in the normal and sarcopenia groups were 25.7 ± 0.2
dB and 33.7 ± 0.7 dB in Low-Freq, 28.9 ± 0.2 dB and
39.8 ± 0.9 dB in Mid-Freq, 35.4 ± 0.3 dB and 49.8 ± 1.1
dB in High-Freq, and 27.3 ± 0.2 dB and 36.8 ± 0.8 dB in
AHT. For univariate and multivariate analyses, all 4
hearing thresholds were higher in the sarcopenia
group than in the normal group. In addition, linear
regression analyses showed Low-Freq, Mid-Freq, and
High-Freq to be inversely correlated with the
sarcopenia index (Table 2).
Int. J. Med. Sci. 2017, Vol. 14
473
Figure 2. Hearing thresholds according to the presence of sarcopenia. The multivariate analysis was adjusted for age, diabetes mellitus, hypertension,
estimated glomerular filtration rate, total cholesterol level, high-density lipoprotein level, and triglyceride level (P < 0.001 for trend in all analyses). The data are
expressed as mean and standard error values. Abbreviation: Low-Freq, low frequency; Mid-Freq, middle frequency; High-Freq, high frequency; AHT, average hearing
threshold.
Table 2. Linear regression analyses of variable hearing thresholds by sarcopenia index.
Dep: Low-Freq
Sarcopenia index
Age
Fasting blood glucose
Systolic blood pressure
Diastolic blood pressure
eGFR
Total cholesterol
HDL cholesterol
Triglyceride
Dep: Mid-Freq
Sarcopenia index
Age
Fasting blood glucose
Systolic blood pressure
Diastolic blood pressure
eGFR
Total cholesterol
HDL cholesterol
Triglyceride
Dep: High-Freq
Sarcopenia index
Age
Fasting blood glucose
Systolic blood pressure
Diastolic blood pressure
eGFR
Total cholesterol
HDL cholesterol
Triglyceride
Univariate
Standardized β ± SE
P-value*
Multivariate
Standardized β ± SE
P-value*
-–0.257 ± 2.005
0.462 ± 0.021
0.107 ± 0.008
0.133 ± 0.012
0.119 ± 0.017
–0.058 ± 0.007
–0.019 ± 0.005
–0.103 ± 0.012
0.082 ± 0.002
<0.001
<0.001
<0.001
<0.001
<0.001
<0.001
0.227
<0.001
<0.001
–0.067 ± 2.059
0.441 ± 0.025
0.038 ± 0.008
–0.074 ± 0.023
0.060 ± 0.032
0.045 ± 0.007
–
–0.044 ± 0.012
–0.004 ± 0.002
<0.001
<0.001
0.008
0.015
0.046
0.002
–
0.003
0.786
–0.286 ± 2.462
0.506 ± 0.026
0.114 ± 0.010
0.151 ± 0.014
0.136 ± 0.021
–0.073 ± 0.009
–0.013 ± 0.006
–0.118 ± 0.015
0.088 ± 0.003
<0.001
<0.001
<0.001
<0.001
<0.001
<0.001
0.399
<0.001
<0.001
–0.079 ± 2.747
0.478 ± 0.030
0.038 ± 0.009
–0.079 ± 0.028
0.070 ± 0.039
0.038 ± 0.008
–
–0.055 ± 0.014
–0.010 ± 0.003
<0.001
<0.001
0.007
0.008
0.016
0.006
–
<0.001
0.050
–0.327 ± 2.999
0.593 ± 0.030
0.136 ± 0.013
0.180 ± 0.018
0.152 ± 0.026
–0.102 ± 0.011
–0.011 ± 0.007
–0.133 ± 0.019
0.108 ± 0.004
<0.001
<0.001
<0.001
<0.001
<0.001
<0.001
0.467
<0.001
<0.001
–0.083 ± 2.847
0.557 ± 0.035
0.045 ± 0.011
–0.044 ± 0.032
0.034 ± 0.045
0.029 ± 0.009
–
–0.055 ± 0.016
–0.002 ± 0.003
<0.001
<0.001
0.001
0.115
0.214
0.025
–
<0.001
0.871
*The dependent variable was Low-Freq, Mid-Freq, or High-Freq, and independent variables were sarcopenia index, age, fasting blood glucose level, systolic blood pressure,
diastolic blood pressure, eGFR, total cholesterol level, HDL cholesterol level, and triglyceride level.
Multivariate analysis was adjusted for sarcopenia index, age, fasting blood glucose level, systolic blood pressure, diastolic blood pressure, eGFR, HDL cholesterol level, and
triglyceride level.
Abbreviations: Low-Freq, low frequency; Mid-Freq, mid-frequency; High-Freq, high-frequency; eGFR, estimated glomerular filtration rate; HDL, high-density lipoprotein.
Int. J. Med. Sci. 2017, Vol. 14
474
Association between sarcopenia and hearing
loss
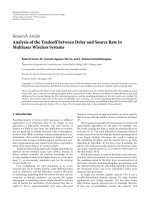
The AUROCs of the sarcopenia index for mild
and moderate-to-profound HL were 0.630 (95% CI,
0.615–0.645) and 0.672 (95% CI, 0.657–0.686),
respectively (Figure 3). The sensitivity and specificity
for predicting HL were 53.2% and 65.9% in mild HL
and 55.7% and 69.4% in moderate-to-profound HL,
respectively.
The prevalence of mild or moderate-to-profound
HL was 30.7% and 13.5% in the normal group, and
37.1% and 37.9% in the sarcopenia group. The
prevalence of HL was higher in the sarcopenia group
than in the normal group (P < 0.001). The unadjusted
OR for mild HL was 2.692 (95% CI, 1.963–3.692; P <
0.001) in the sarcopenia group relative to the normal
group, with an adjusted OR of 1.584 (95% CI,
1.131–2.217; P = 0.007). The unadjusted OR for
moderate-to-profound HL in the sarcopenia group
relative to the normal group was 6.246 (95% CI,
4.530–8.612; P < 0.001); the adjusted OR was 2.667
(95% CI, 1.866–3.812; P < 0.001).
Subgroup analysis by age
For participants aged 50-59 years and 70-79
years, all 4 hearing thresholds were higher in the
sarcopenia group than in the normal group. For those
aged 60-69 years, there was a significant difference
only in the High-Freq hearing threshold between the
two groups (Table 3). The univariate and multivariate
analyses showed similar results.
Figure 3. Receiver operating characteristic curves of sarcopenia
index for the prediction of hearing loss. A. mild hearing loss. B.
moderate-to-profound hearing loss.
Table 3. Subgroup analyses for the association between hearing thresholds and sarcopenia
50–59 aged
Low-Freq
Mid-Freq
High-Freq
AHT
60–69 aged
Low-Freq
Mid-Freq
High-Freq
AHT
70–79 aged
Low-Freq
Mid-Freq
High-Freq
AHT
Univariate
Normal
Sarcopenia
P-value*
Multivariate
Normal
Sarcopenia
P-value*
22.1 ± 0.2
23.9 ± 0.2
28.0 ± 0.3
23.0 ± 0.2
23.9 ± 0.2
22.0 ± 3.3
36.6 ± 2.6
29.7 ± 2.1
<0.001
<0.001
<0.001
<0.001
22.1 ± 8.2
23.9 ± 10.2
28.0 ± 12.9
23.0 ± 8.7
26.7 ± 1.2
32.6 ± 1.6
36.6 ± 1.6
28.7 ± 1.3
0.002
<0.001
<0.001
<0.001
28.1 ± 0.3
32.4 ± 0.4
40.8 ± 0.5
30.2 ± 0.4
30.5 ± 1.4
35.0 ± 1.7
46.2 ± 1.9
32.8 ± 1.5
0.051
0.078
0.003
0.055
28.0 ± 0.3
32.3 ± 0.4
41.0 ± 0.5
30.2 ± 0.4
30.0 ± 1.2
34.2 ± 1.4
44.7 ± 1.7
32.1 ± 1.2
0.105
0.197
0.031
0.133
35.6 ± 0.6
42.2 ± 0.7
54.3 ± 0.8
38.9 ± 0.6
40.3 ± 1.5
48.4 ± 1.6
60.7 ± 1.5
44.3 ± 1.5
0.001
<0.001
<0.001
<0.001
35.7 ± 0.7
42.4 ± 0.7
54.6 ± 0.8
39.1 ± 0.7
39.5 ± 1.3
47.6 ± 1.4
59.8 ± 1.5
43.5 ± 1.3
0.009
0.002
0.002
0.003
Data are expressed as mean ± standard errors.
*P values were tested by student t-test for univariate analysis and by analysis of covariance for multivariate analysis. Multivariate analysis was adjusted for sarcopenia index,
age, fasting blood glucose level, systolic blood pressure, diastolic blood pressure, eGFR, HDL cholesterol level, and triglyceride level.
Abbreviations: Low-Freq, low frequency; Mid-Freq, mid-frequency; High-Freq, high-frequency; eGFR, estimated glomerular filtration rate; HDL, high-density lipoprotein.
Int. J. Med. Sci. 2017, Vol. 14
Discussion
Our study included only postmenopausal
women for exclusion of sex or hormonal effects.
Participants were divided into a sarcopenia and
normal group based on the sarcopenia index. The
sarcopenia and normal groups were compared with
respect to hearing impairment and HL. Participants in
the sarcopenia were significantly older and a greater
proportion met the criteria for the metabolic
syndrome than those without sarcopenia. The
sarcopenia index had a significant AUC for prediction
of mild or moderate-to-profound HL and was
inversely correlated with hearing thresholds. All 4
hearing thresholds were higher in the participants
with sarcopenia than in those without sarcopenia. In
addition, logistic regression analyses showed an
association between the presence of sarcopenia and
mild or moderate-to-profound HL. These results
indicate that sarcopenia may be associated with
hearing impairment through the mechanism of
increased metabolic disturbance in postmenopausal
women.
The association between sarcopenia and
metabolic disturbance is well-known, but the
association is very complex. Sarcopenia can cause
metabolic disturbances; conversely, metabolic
disturbances can induce the sarcopenia. Muscles
utilize large amounts of glucose, and decreases in
muscle bulk can increase the risk of insulin resistance
[20, 21]. Metabolic syndrome is associated with
increased visceral fat mass. Such an increase is
associated with inadequate activation of the PI3/Akt
signaling pathway by means of insulin resistance, and
resulting in accelerated breakdown of muscle mass
[22]. Chronic inflammation caused by the metabolic
syndrome can also play a role in decreasing muscle
mass. Our results demonstrate that sarcopenia is
associated with both the metabolic syndrome and
chronic inflammation. These factors can lead to
endothelial damage in stria vascularis, which can
result in hearing impairment [23, 24].
Our results show an association between
sarcopenia and hearing thresholds (as a continuous
variable) and HL (as a categorical variable). The
predictive effect in moderate-to-profound HL was
higher than that in mild HL. We postulate that this
association is a result of metabolic disturbances
combined with sarcopenia. Although we did not
evaluate causality between sarcopenia and metabolic
disturbances, these results indicate that participants
with sarcopenia should be closely monitored for
hearing impairment.
Age is an important confounding factor as it is
associated with both sarcopenia and hearing
475
impairment. Thus, we adjusted for age in the
multivariate analysis. In addition, we tried to decrease
the confounding effect of age by stratification into
three subgroups (50-59; 50-69 and 70-79 years of age).
In the subgroup analysis, Low-, Mid-, High-Freq, and
AHT were significantly higher in the sarcopenia
group than in the normal group amongst those aged
50-59 and 70-79. Amongst participants aged 60-69,
only the High-Freq hearing threshold was
significantly higher in the sarcopenia group than in
the normal group. Although no statistically
significance observed, the other hearing thresholds in
the sarcopenia group showed a higher trend than in
those in the normal group.
This study has a number of limitations. First, as it
is a retrospective cross-sectional design, it cannot
establish causality between sarcopenia and metabolic
disturbances or between sarcopenia and hearing
impairment or HL. Second, the study included an
ethnically homogenous population at a single center,
affecting generalizability. Third, this study did not
evaluate sensitive components of either hearing
impairment (such as speech discrimination) or
sarcopenia (such as muscle strength).
In conclusion, sarcopenia may be associated with
HL. Further prospective studies are needed to
evaluate the strength of the association between
sarcopenia and HL. However, it may be beneficial to
perform screening audiometry in patients with
sarcopenia.
Acknowledgement
This work was supported by the Medical
Research Center Program (2015R1A5A2009124)
through the National Research Foundation of Korea
(NRF) funded by the Ministry of Science, ICT and
Future Planning.
Competing Interests
The authors have declared that no competing
interest exists.
References
[1]
[2]
[3]
[4]
[5]
[6]
Studenski SA, Peters KW, Alley DE, Cawthon PM, McLean RR, Harris TB, et
al. The FNIH sarcopenia project: rationale, study description, conference
recommendations, and final estimates. J Gerontol A Biol Sci Med Sci.
2014;69:547-58.
Foley RN, Wang C, Ishani A, Collins AJ, Murray AM. Kidney function and
sarcopenia in the United States general population: NHANES III. Am J
Nephrol. 2007;27:279-86.
Morley JE, Vellas B, van Kan GA, Anker SD, Bauer JM, Bernabei R, et al.
Frailty consensus: a call to action. J Am Med Dir Assoc. 2013;14:392-97.
Cruz-Jentoft AJ, Baeyens JP, Bauer JM, Boirie Y, Cederholm T, Landi F, et al.
European Working Group on Sarcopenia in Older People. Sarcopenia:
European consensus on definition and diagnosis: Report of the European
Working Group on Sarcopenia in Older People. Age Ageing. 2010;39:412-3.
Buford TW, Anton SD, Judge AR, Marzetti E, Wohlgemuth SE, Carter CS, et al.
Models of accelerated sarcopenia: critical pieces for solving the puzzle of
age-related muscle atrophy. Ageing Res Rev. 2010;9:369-83.
Dominguez LJ, Barbagallo M. The cardiometabolic syndrome and sarcopenic
obesity in older persons. J Cardiometab Syndr. 2007;2:183-9.
Int. J. Med. Sci. 2017, Vol. 14
[7]
[8]
[9]
[10]
[11]
[12]
[13]
[14]
[15]
[16]
[17]
[18]
[19]
[20]
[21]
[22]
[23]
[24]
476
Lee SW, Youm Y, Lee WJ, Choi W, Chu SH, Park YR, et al. Appendicular
skeletal muscle mass and insulin resistance in an elderly Korean population:
the Korean Social Life, Health and Aging Project-Health Examination cohort.
Diabetes Metab J. 2015;39:37-45.
Kim BC, Kim MK, Han K, Lee SY, Ko SH, Kwon HS, et al. Low muscle mass is
associated with metabolic syndrome only in nonobese young adults: the Korea
National Health and Nutrition Examination Survey 2008-2010. Nutr Res.
2015;35:1070-8.
Jennings MB, Shaw L. Impact of hearing loss in the workplace: raising
questions about partnerships with professionals. Work. 2008;30:289-95.
Walling AD, Dickson GM. Hearing loss in older adults. Am Fam Physician.
2012;85:1150-6.
Stevens G, Flaxman S, Brunskill E, Mascarenhas M, Mathers CD, Finucane M,
et al. Global and regional hearing impairment prevalence: an analysis of 42
studies in 29 countries. Eur J Public Health. 2013;23:146-52.
Agrawal Y, Platz EA, Niparko JK. Risk factors for hearing loss in US adults:
data from the National Health and Nutrition Examination Survey, 1999 to
2002. Otol Neurotol. 2009;30:139-45.
Van Eyken E, Van Camp G, Van Laer L. The complexity of age-related hearing
impairment: contributing environmental and genetic factors. Audiol
Neurootol. 2007;12:345-58.
Kang SH, Jung da J, Cho KH, Park JW, Yoon KW, Do JY. The association
between metabolic syndrome or chronic kidney disease and hearing
thresholds in Koreans: the Korean National Health and Nutrition Examination
Survey 2009-2012. PLoS One. 2015;10:e0120372.
Sun YS, Fang WH, Kao TW, Yang HF, Peng TC, Wu LW, et al. Component of
metabolic syndrome as risk factors for hearing thresholds shifts. PLoS One.
2015;10:e0134388
Oron Y, Elgart K, Marom T, Roth Y. Cardiovascular risk factors as causes for
hearing impairment. Audiol Neurootol. 2014;19:256-60.
Studenski SA, Peters KW, Alley DE, Cawthon PM, McLean RR, Harris TB, et
al. The FNIH sarcopenia project: rationale, study description, conference
recommendations, and final estimates. J Gerontol A Biol Sci Med Sci.
2014;69:547-58.
Levey AS, Stevens LA, Schmid CH, Zhang YL, Castro AF 3rd, Feldman HI, et
al. A new equation to estimate glomerular filtration rate. Ann Intern Med.
2009;150:604-12.
Grundy SM, Cleeman JI, Daniels SR, Donato KA, Eckel RH, Franklin BA, et al.
Diagnostic and management of the metabolic syndrome: an American Heart
Association/National Heart, Lung, and Blood Institute Scientific Statement.
Circulation. 2005;112:2735-52.
Karlsson HK, Zierath JR. Insulin signaling and glucose transport in insulin
resistant human skeletal muscle. Cell Biochem Biophys. 2007;48:103-13.
Srikanthan P, Karlamangla AS. Relative muscle mass is inversely associated
with insulin resistance and prediabetes. Findings from the third National
Health and Nutrition Examination Survey. J Clin Endocrinol Metab.
2011;96:2898-903.
Wang X, Hu Z, Hu J, Du J, Mitch WE. Insulin resistance accelerates muscle
protein degradation: Activation of the ubiquitin-proteasome pathway by
defects in muscle cell signaling. Endocrinology. 2006;147:4160-8.
Fetoni AR, Picciotti PM, Paludetti G, Troiani D. Pathogenesis of presbycusis in
animal models: a review. Exp Gerontol. 2011;46:413-425.
Yamasoba T, Lin FR, Someya S, Kashio A, Sakamoto T, Kondo K. Current
concepts in age-related hearing loss: epidemiology and mechanistic pathways.
Hear Res. 2013;303:30-38.