Measuring the corpus callosum and intracranial volumes of Vietnamese normal adults using magnetic resonance imaging
Bạn đang xem bản rút gọn của tài liệu. Xem và tải ngay bản đầy đủ của tài liệu tại đây (172.97 KB, 7 trang )
Journal of military pharmaco-medicine no6-2019
MEASURING THE CORPUS CALLOSUM AND INTRACRANIAL
VOLUMES OF VIETNAMESE NORMAL ADULTS USING
MAGNETIC RESONANCE IMAGING
Tong Quoc Dong1; Nguyen Le Chien1; Dang Tien Truong1
Hoang Van Luong1; Tran Hai Anh1
SUMMARY
Objectives: To determine volumes of corpus callosum and intracranial volumes of
Vietnamese normal adults. Subjects and methods: Analyzing volumes of corpus callosum and
intracranial volumes from cranial magnetic resonance images taken from 455 Vietnamese
healthy subjects (males 47.03%), and ranging in age from 17 to 87 years. Results: The total
3
volume of corpus callosum was indifferent between genders (males: 3.40 ± 0.47 cm ; females
3
3.32 ± 0.44 cm ; p = 0.06), but volumes of rostrum, genu, and splenium regions were larger in
3
males than those in females. The intracranial volume in females (1387.35 ± 96.72 cm ) was
3
10.76% smaller than that in males (1536.58 ± 103.46 cm ) (p < 0.001). The corpus callosum
was getting smaller with ageing, which appeared in men more obviously and dispersedly at
truncus and isthmus subregions, whereas in women that tendency was at central-truncus only.
Conclusions: Findings from this morphological study on corpus callosum and intracranial
volumes contributed to the reference anthropometric values of current Vietnamese adults using
non-invasive imaging tools.
* Keywords: Corpus callosum; Intracranial volume; Anthropometry; Vietnamese adults; MRI.
INTRODUCTION
With the development of modern
analytical techniques, methods for
evaluation of brain morphological
characteristics and their changes based
on magnetic resonance imaging (MRI)
have been being conducted at many
research centres abroad, and had also
attracted interest over the past decade in
Vietnam [2, 3]. There have been noninvasive studies using MRI in healthy
people as well as in people with brain
damaging diseases to investigate changes
of brain morphology, yet an issue on
normal values of brain structures with age
and sex in healthy adults is still open,
raising a requirement for building-up
reference ranges of brain structures with
this novel imaging technique.
Situating in the centre of the human
brain consisting of approximately 200
250 million myelinated axons [7], the corpus
callosum (CC) forms the largest commissural
white matter bundle, connecting the
hemispheres and brain cortical regions [9].
1. Vietnam Military Medical University
Corresponding author: Tran Hai Anh ()
Date received: 10/07/2019
Date accepted: 12/08/2019
128
Journal of military pharmaco-medicine no6-2019
Therefore, changes in the brain structures
or functions in both physiological (age,
sex) or pathological states might affect
the CC and compromise this morphogical
structure. The total intracranial volume
relates to hard tissue and relatively stable,
hence it has often been regarded as a
reference measurement for adjustment in
analyzing brain soft tissues, including the
CC [4].
From above mentioned issues, the
present study was conducted in order to:
Determine the corpus callosum and
intracranial volumes of Vietnamese normal
adults using MRI.
SUBJECTS AND METHODS
1. Subjects.
MRI were taken from 455 right-handed
Vietnamese adults (214 males, 19 - 82 years
old; 241 females, 17 - 87 years olds), who
visited the outpatient ward at 108 Military
Central Hospital from Nov. 2017 to Nov.
2018. They had no history of neuropsychiatric disorders or chronic diseases,
and had informed consent to participate in
the study. Image data analysis and
processing were performed at Department
of Physiology, Vietnam Military Medical
University.
2. Methods.
* MRI procedure and analysis:
Three-dimensional brain scans were
taken by a 1.5 Tesla MRI scanner system
(Siemen, Germany), using the T1-weighted
sagittal sequence with parameters: slice
thickness 1 mm, TR = 15 ms, TE = 5 ms,
NEX = 1 ms, flip angle = 30°, 25 x 25 cm
FOV; matrix = 256 x 256, with more than
300 contiguous slices on each subject.
Brain image scans were then reviewed
and confirmed by specialist physicians
that of subjects having no damages of
central nervous system. The imaging data
were stored in DICOM format, compressed
to NIFTI, rendering and analyzing for brain
regions using FreeSurfer software version
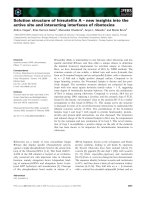
6.0.0 [5]. Volumetric values (cm3) of the
total corpus callosum volume and its
subregions (figure 1) as well as intracranial
volume were taken into account.
Figure 1: Corpus callosum and its subregion (Hampel et al, 1998 [6]).
129
Journal of military pharmaco-medicine no6-2019
* Data analysis:
Subjects were categorized by gender
and divided into 6 groups of age, ranging
from 17 to 87 years old. The volumes of
total corpus callosum and its subregions
were compared among age groups within
sex by a co-variance analysis (ANCOVA);
the differences in age and the proportion
of subjects among groups were compared
using the Student’s t.test and proportional
comparisons (Chi-square tests). The
analyses were made with SPSS 22.0
(IBM Inc., USA) and a significant difference
was set as p value of less than 0.05.
RESULTS
1. Demography of subjects.
Table 1: Age and gender of subjects.
Male
Female
p
214 (47.03)
241 (52.97)
0.21
45.57 ± 14.04
44.62 ± 12.25
0.44
≤ 24
14 (22.14 ± 2.03)
9 (20.44 ± 2.79)
25 - 34
45 (30.47 ± 3.00)
51 (30.43 ± 2.74)
Age group
35 - 44
47 (39.62 ± 2.84)
56 (40.30 ± 2.75)
(n, X ± SD)
45 - 54
42 (49.83 ± 2.87)
71 (49.14 ± 3.01)
55 - 64
44 (59.34 ± 2.65)
46 (58.11 ± 2.62)
≥ 65
22 (68.41 ± 3.87)
8 (62.6 ± 1.96)
Gender, n (%)
Mean age
0.012
The results on table 1 showed no significant differences in mean age and the
gender proportion of subjects. However, the proportions of males and females among
age groups were significantly different (p = 0.012). This difference can be attributed to
the variety in the proportion of subjects by gender among groups of 45 - 54 and from
65 years old.
Table 2: Corpus callosum and intracranial volumes (cm3) in both genders.
Male
Female
(x̅ ± SD)
(x̅ ± SD)
Total corpus callosum volume
3.40 ± 0.47
3.32 ± 0.44
0.06
Rostrum and genu
0.88 ± 0.13
0.84 ± 0.12
0.002
Anterior truncus
0.52 ± 0.11
0.50 ± 0.12
0.052
Central truncus
0.52 ± 0.12
0.53 ± 0.13
0.32
Posterior truncus and isthmus
0.51 ± 0.11
0.51 ± 0.09
0.67
Splenium
0.97 ± 0.15
0.93 ± 0.13
0.004
1536.58 ± 103.46
1387.35 ± 96.72
< 0.001
Intracranial volume
130
p
Journal of military pharmaco-medicine no6-2019
Results in table 2 showed that though the total corpus callosum volume was
indifferent between males and females, the volume of the rostrum-genu and splenium
of the corpus callosum in females were smaller than that of males (p = 0.002 and p =
0.004, respectively). The intracranial volume in females was also marked smaller than
that in males (p < 0.001). The difference in intracranial volume between genders would
have certain effects on the size and volume of internal brain structures. Therefore, in
evaluation of the corpus callosum volume in this study, the intracranial volume was
regarded as a covariance.
2. Change of corpus callosum volume by age groups.
Table 3: Values of corpus callosum volumes (cm3) in males of age groups.
Age group
Corpus
callosum
volumes
Total
volume
Rostrum
and genu
Anterior
truncus
Central
truncus
Posterior
truncus and
isthmus
Splenium
≤ 24
(x̅ ± SE)
3.42 ± 0.12
0.84 ± 0.03
0.52 ± 0.03
0.57 ± 0.03
0.54 ± 0.03
0.95 ± 0.04
25 - 34
(x̅ ± SE)
3.51 ± 0.07
0.87 ± 0.02
0.57 ± 0.01
0.58 ± 0.02
0.53 ± 0.02
0.95 ± 0.02
35 – 44
(x̅ ± SE)
3.53 ± 0.06
0.90 ± 0.02
0.55 ± 0.01
0.55 ± 0.02
0.54 ± 0.02
0.98 ± 0.02
45 – 54
(x̅ ± SE)
3.42 ± 0.07
0.91 ± 0.02
0.50 ± 0.02
0.50 ± 0.02
0.51 ± 0.02
0.99 ± 0.02
55 – 64
(x̅ ± SE)
3.25 ± 0.07
0.86 ± 0.02
0.47 ± 0.02
0.47 ± 0.02
0.48 ± 0.02
0.97 ± 0.02
≥ 65
(x̅ ± SE)
3.16 ± 0.09
0.87 ± 0.03
0.45 ± 0.02
0.43 ± 0.02
0.44 ± 0.02
0.97 ± 0.03
F (5,207)
3.66
1.41
7.98
9.32
3.50
0.44
pcommon
0.003
0.22
< 0.001
< 0.001
0.005
0.82
(The volume values shown were adjusted with the total intracranial volume)
Analyzing on males (table 3) showed that except for a might increase in volume of
the splenium even ageing, the corpus callosum continuously grew to about 35 - 44
years old and then began to shrink (p = 0.003). Moreover, the callosal shrinkage by
ageing occurred mainly in the truncus and isthmus (included the anterior, p < 0.001;
central, p < 0.001; posterior truncus and isthmus, p = 0.005).
131
Journal of military pharmaco-medicine no6-2019
Table 4: Values of corpus callosum volumes (cm3) in females of age groups.
Corpus
callosum
volumes
and genu
Anterior
truncus
Central
truncus
Posterior
truncus and
isthmus
Splenium
3.33 ± 0.14
0.79 ± 0.04
0.56 ± 0.04
0.61 ± 0.04
0.52 ± 0.03
0.86 ± 0.04
3.39 ± 0.06
0.83 ± 0.02
0.52 ± 0.02
0.58 ± 0.02
0.52 ± 0.01
0.94 ± 0.02
3.37 ± 0.06
0.85 ± 0.01
0.50 ± 0.01
0.53 ± 0.02
0.53 ± 0.01
0.96 ± 0.02
3.27 ± 0.05
0.84 ± 0.01
0.49 ± 0.01
0.52 ± 0.01
0.51 ± 0.01
0.92 ± 0.01
3.28 ± 0.06
0.86 ± 0.02
0.48 ± 0.02
0.50 ± 0.02
0.51 ± 0.01
0.94 ± 0.02
3.11 ± 0.15
0.86 ± 0.04
0.43 ± 0.04
0.44 ± 0.04
0.48 ± 0.03
0.90 ± 0.05
F (5,234)
1.02
0.67
1.60
3.70
0.57
1.62
pcommon
0.41
0.64
0.16
0.003
0.73
0.16
≤ 24
(x̅ ± SE)
25 - 34
Age group
(x̅ ± SE)
35 - 44
(x̅ ± SE)
45 - 54
(x̅ ± SE)
55 - 64
(x̅ ± SE)
≥ 65
(x̅ ± SE)
Total
Rostrum
volume
(The volume values shown after adjusted with the total intracranial volume)
In females, the shrinking phenomenon of the total corpus callosum as well as its
subregions was unobservable (p = 0.41), except for the central segment (p = 0.003).
Moreover, the central volume also reached the peak value earlier than that in males, at
the group “To 24”, and then gradually decreased with age.
DISCUSSION
Anthropometrics of cranial sizes and
volumes of the Vietnamese population,
along with understandings of morphological
changes in functional brain regions aids in
determining normal ranges of values that
are references for studies on pathological
conditions in human. However, negligence
of inter-individual variability of brain
structure and head size could cause
deviations in the determination of volumes
of brain structures [1]. Several studies
analyzing volumes of brain regions on MRI
images of normal human showed that
132
intracranial volume in women was smaller
than that in men. Buckner et al (2014), by
manually measuring intracranial volume,
concluded that this volume was 10 - 20%
greater in men than in women and it was
minimally affected by age [4]. Le Huu
Hung (1995) also measured intracranial
volume on the Vietnamese population and
demonstrated that it was 8.43% greater in
men than in women, with respective
values of 1363.97 ± 103.2 cm 3 and
1257.91 ± 92.2 cm3 [1]. In this study, the
total intracranial volume in men was
1536.58 cm3, which was 10.76% greater
Journal of military pharmaco-medicine no6-2019
than that in women (1387.35 cm3). The
results reported by Le Huu Hung were
smaller than ours, which could be
attributable to the discrepancy in measuring
methods between two studies. Our study
measured cranial size on MRI of alive
human while previous studies measured
on archaeological crania, which could have
shrunk due to dehydration after death or
in the process of cadaver preservation.
Besides, changes in socio-economic status
between present and previous times
require more novel studies to establish
systematically reference ranges of human
anthropometrics.
The present study analysed volume of
corpus callosum in both genders in
correlation with age and intracranial
volume. Our results showed that corpus
callosum decreased in size at certain
ages, and more significantly and obviously
in men than in women. In men, the corpus
callosum reached the peak at the age of
35 - 44 years old, then started to shrink
mainly at the truncus. In women, the
corpus callosum did not present an obvious
change in total volume in adults and its
shrinkage was clearly observed only in
the central truncus. Those findings were
different from many abroad studies on
volume of the corpus callosum.
Takeda et al (2003) analysed several
indexes of the corpus callosum of
Japanese normal population in relation
with age by manually measuring on MRI,
which showed that changes occurred
mainly at the genu portion with no
difference between males and females
[10]. Junle et al (2008) analysed biometric
indexes of the corpus callosum on T1weighted MRI of 286 healthy Chinese
from 20 to 86 years old found that among
six regions of the corpus callosum, the
length of the genu, 1/3 anterior, central
and 1/3 posterior truncus, and splenium
tended to declined over age [8]. However,
they noted a bigger volume of the corpus
callosum in females than in males [8].
Those inconsistencies may due to
discrepancies in ethnics and measuring
methods on MRI, and negligence of
co-variants affecting intracranial volume in
data analysis. Another study by Prendergast
et al [9] on cranial MRI of 305 American
adults showed that the corpus callosum
developed maximally at the age of 32.2
for men and of 40.1 for women, which
was consistent with our findings, but the
decrement occurred mainly at the CC
genu portion.
CONCLUSIONS
Investigation on brain MRI showed that
the intracranial volume of Vietnamese
adults presently had different properties
than those of previous studies, and the
corpus callosum of the Vietnamese people
also had compromised traits differed from
those of other ethnicities and races.
Therefore, our findings in the present
study contributed to the anthropometrics
reference of current Vietnamese adults.
REFERENCES
1. Lê Hữu Hưng. Đặc điểm hình thái nhân chủng sọ người Việt hiện đại. Luận án
Tiến sỹ Y học. Trường Đại học Y Hà Nội.
1995.
2. Nguyễn Giang Hòa, Nguyễn Duy Bắc,
Nguyễn Minh Hải và CS. Biến đổi khoảng
cách liên móc và thể tích vùng hải mã trên
phim cộng hưởng từ sọ não ở bệnh nhân
Alzheimer. Tạp chí Sinh lý học Việt Nam.
2011, 15 (2), tr.15-21.
133
Journal of military pharmaco-medicine no6-2019
3. Phạm Thành Nguyên, Lâm Khánh,
Nguyễn Duy Bắc. Nghiên cứu đặc điểm hình
thái của đồi thị ở người trưởng thành bình
thường bằng cộng hưởng từ khuếch tán 3.0
Tesla. Tạp chí Y - Dược học Quân sự. Số
chuyên đề Hình thái học. 2017, tr.64-71.
4. Buckner R.L, Head D, Parker J et al. A
unified approach for morphometric and
functional data analysis in young. old. and
demented adults using automated atlas-based
head size normalization: reliability and
validation against manual measurement of
total intracranial volume. NeuroImage. 2004,
23 (2), pp.724-738.
5. Fischl B. FreeSurfer. Neuro Image.
2012, 62 (2), pp.774-781.
6. Hampel H, Teipel S.J, Alexander G.E et
al. Corpus callosum atrophy is a possible
indicator of region- and cell type-specific
neuronal degeneration in Alzheimer disease:
134
A magnetic resonance imaging analysis.
Archives of Neurology. 1998, 55 (2),
pp.193-198.
7. Jarbo K, Verstynen T, Schneider W. In
vivo quantification of global connectivity in the
human corpus callosum. Neuro Image. 2012,
59 (3), pp.1988-1996.
8. Junle Y, Youmin G, Yanjun G et al. A
MRI quantitative study of corpus callosum in
normal adults. Journal of Medical Colleges of
PLA. 2008, 23, pp.346-351.
9. Prendergast D.M, Ardekani B, Ikuta T.
Age and sex effects on corpus callosum
morphology across the lifespan. Human Brain
Mapping. 2015, 3 (7), pp.2691-2702.
10. Takeda S, Hirashima Y, Ikeda H et al.
Determination of indices of the corpus
callosum associated with normal aging in
Japanese individuals. Neuroradiology. 2003,
45, pp.513-518.