A new look at causal factors of idiopathic scoliosis: Altered expression of genes controlling chondroitin sulfate sulfation and corresponding changes in protein synthesis in vertebral body
Bạn đang xem bản rút gọn của tài liệu. Xem và tải ngay bản đầy đủ của tài liệu tại đây (1.01 MB, 10 trang )
Int. J. Med. Sci. 2019, Vol. 16
Ivyspring
International Publisher
221
International Journal of Medical Sciences
2019; 16(2): 221-230. doi: 10.7150/ijms.29312
Research Paper
A New Look at Causal Factors of Idiopathic Scoliosis:
Altered Expression of Genes Controlling Chondroitin
Sulfate Sulfation and Corresponding Changes in Protein
Synthesis in Vertebral Body Growth Plates
Alla M. Zaydman1, Elena L. Strokova1, Alena O.Stepanova2,3, Pavel P. Laktionov2,3, Alexander I.
Shevchenko4, Vladimir M. Subbotin5,6
1.
2.
3.
4.
5.
6.
Novosibirsk Research Institute of Traumatology and Orthopaedics n.a. Ya.L. Tsivyan, Novosibirsk, Russia
Meshalkin National Medical Research Center, Ministry of Health of the Russian Federation, Novosibirsk, Russia
Institute of Chemical Biology and Fundamental Medicine, Russian Academy of Science, Novosibirsk, Russia
Institute of Cytology and Genetics, Russian Academy of Science, Novosibirsk, Russia
University of Pittsburgh, Pittsburgh PA, USA
Arrowhead Pharmaceuticals, Madison WI, USA
Corresponding authors: Alla M. Zaydman, Vladimir M. Subbotin, ; Office:
1-608-316-3924; Fax: 1-608-441-0741
© Ivyspring International Publisher. This is an open access article distributed under the terms of the Creative Commons Attribution (CC BY-NC) license
( See for full terms and conditions.
Received: 2018.08.17; Accepted: 2018.12.07; Published: 2019.01.01
Abstract
Background: In a previous report, we demonstrated the presence of cells with a neural/glial phenotype
on the concave side of the vertebral body growth plate in Idiopathic Scoliosis (IS) and proposed this
phenotype alteration as the main etiological factor of IS. In the present study, we utilized the same
specimens of vertebral body growth plates removed during surgery for Grade III–IV IS to analyse gene
expression. We suggested that phenotype changes observed on the concave side of the vertebral body
growth plate can be associated with altered expression of particular genes, which in turn compromise
mechanical properties of the concave side.
Methods: We used a Real-Time SYBR Green PCR assay to investigate gene expression in vertebral body
growth plates removed during surgery for Grade III–IV IS; cartilage tissues from human fetal spine were
used as a surrogate control. Special attention was given to genes responsible for growth regulation,
chondrocyte differentiation, matrix synthesis, sulfation and transmembrane transport of sulfates. We
performed morphological, histochemical, biochemical, and ultrastructural analysis of vertebral body
growth plates.
Results: Expression of genes that control chondroitin sulfate sulfation and corresponding protein
synthesis was significantly lower in scoliotic specimens compared to controls. Biochemical analysis
showed 1) a decrease in diffused proteoglycans in the total pool of proteoglycans; 2) a reduced level of
their sulfation; 3) a reduction in the amount of chondroitin sulfate coinciding with raising the amount of
keratan sulfate; and 4) reduced levels of sulfation on the concave side of the scoliotic deformity.
Conclusion: The results suggested that altered expression of genes that control chondroitin sulfate
sulfation and corresponding changes in protein synthesis on the concave side of vertebral body growth
plates could be causal agents of the scoliotic deformity.
Key words: idiopathic scoliosis, vertebral body growth plate, gene expression
Introduction
Scoliotic deformity is one of the most common
spine pathologies affecting children and adolescents.
Idiopathic scoliosis (IS) occurs in otherwise healthy
children and adolescents, affecting 2–4 million people
in the Russian Federation (extrapolated from [1]) and
approximately 8 million in the United States,
Int. J. Med. Sci. 2019, Vol. 16
representing tremendous medical, social, and
financial burden [2, 3]. While etiological factors of IS
have not been identified [4], [5], which to some extent
could be attributed to the absence of a proper animal
model [6], several hypotheses have tried to delineate
possible causative factors. The first hypotheses
founded on a biomechanical model was offered by
Somerville in 1952 [7] and further elaborated by Roaf
[8]. In modern times, mechanical effects on vertebral
growth have been investigated in detail by Ian Stokes
(e.g. [9]).
While all agree that asymmetric growth of the
concave and convex sides of vertebral body growth
plates causes IS deformity (e.g. [9]) and
implementation of the Hueter-Volkmann principle is
intuitive[10], approaches based on biomechanical
models were not able to offer radical cure or
prevention. During the last few decades, the genetic
nature of IS has been intensively investigated, but
recent studies concluded that identification of genes
determining the development of this disease is very
difficult [11]. Some studies have even achieved rather
contradictory data. Gorman et al., [12] analyzed 50
representative studies including 34 candidate gene
studies and 16 full genome ones. The authors
concluded that contemporary data on the genetics of
IS do not explain its etiology and could not be used to
determine the prognosis of the disease [12]. Different
treatment strategies based on neurological models
also were investigated, but general agreement is that
additional research is needed (for a detailed account
of IS hypotheses see [1, 13]). The analysis of Wang and
co-authors on contemporary hypotheses and
approaches to an IS cure concluded that “The current
treatment at best is treating the morphologic and
functional sequelae of AIS and not the cause of the
disease” [14].
Driven by the fact that prevailing models cannot
explain pathological features of IS [15, 16], Burwell
and co-authors outlined a novel multifactorial
Cascade Concept of IS pathogenesis [17], which
together with previous ideas by the same group [18]
put an emphasis on epigenetic factors affecting
vertebral growth in infancy and early childhood.
We hypothesised that such epigenetic factors
may affect vertebral structure development much
earlier, during neural crest cell migration through
somites, resulting in altered vertebral growth plate
differentiation. In a previous report, we demonstrated
the presence of cells with a neural/glial phenotype on
the concave side of the vertebral body growth plate in
IS and proposed this phenotype alteration as the main
etiological factor of the IS [19]. In the present study we
utilized selected specimens from the same study
(vertebral body growth plates removed during
222
surgery for Grade III–IV IS) to analyse gene
expression. We suggested that phenotype changes
observed on the concave side of the vertebral body
growth plate can be associated with altered
expression of particular genes, which in turn
compromise mechanical properties of the concave
side. This study included morphological and
biochemical analyses of the vertebral growth plate of
the deformity and investigation of the expression of
genes whose products can influence IS development.
The objective of the study was to conduct an
expression analysis of the genes regulating
differentiation and functioning of chondrocytes, as
well as the synthesis of intracellular matrix
components, with simultaneous morphological and
biochemical analyses of the growth plate cartilage in
IS.
Materials and Methods
Clinical specimens
Vertebral body growth plates from the curve
apex and from above and below the curve apex were
removed during the surgery of anterior release and
interbody fusion in 12 patients aged 11–15 years with
IS of Grade III–IV [19]. An ideal control for this study
would be normal, non-hypoxic human growth plate
specimens
from
non-scoliotic
subjects
of
corresponding ages. However, such specimens are
extremely rarely accessible; for example, these
specimens may become available following urgent
surgery for spinal trauma, when removal of vertebral
body growth plates would be dictated by treatment
requirements. In reality, however, such control
specimens have never been achievable in our settings
(or for other research groups, as far as we know).
However, existing information allows for bridging
gene expression patterns from vertebral body growth
plates of different developmental stages and then
using available specimens as a provisional control.
Comparison of gene expression patterns of human
vertebral fetal growth plate cartilage showed
similarities between 8–12 and 12–20 week old fetal
cartilage [20-22]. No obvious changes were observed
in RAGE expression between fetal, juvenile, and
young adolescent discs (until the age of 13 years) [23].
Therefore, as a provisional control, cartilage structural
components of the human fetal spine at 10–12 weeks
of development were used. Ten specimens were
obtained from healthy women immediately after
medical abortions performed in the clinics licensed by
Ministry of Health of The Russian Federation, in
accordance with the approved list of medical
indications. All patients gave written informed
consent to participate in the study. The study was
Int. J. Med. Sci. 2019, Vol. 16
performed in accordance with the ethical principles of
the Helsinki Declaration and standards of the
Institutional Bioethical Committee.
Morphology,
histochemistry,
biochemistry,
ultrastructural analysis. Morphological, histochemical,
biochemical, and ultrastructural studies of cells and
matrix growth plates of the vertebral bodies of
patients with IS and of the control samples were
performed according to protocols described
previously [24].
Isolation of cells from tissue specimens
Hyaline cartilage of the growth plates and fetal
cartilage were washed in saline solution, milled to a
size of 1–2 mm in a petri dish with a minimal volume
of Roswell Park Memorial Institute (RPMI) medium,
placed in a 1,5% solution of collagenase in siliconized
dishes and incubated in a CO2 incubator at 37°C for
22–24 hours. The resulting cell suspension was passed
through a nylon filter to remove the tissue pieces, and
the cells were pelleted by centrifugation for 10
minutes at 2000 rpm. The pelleted cells were
re-suspended in saline, and the total amount of cells
was determined using a haemocytometer.
Isolation of RNA from cells and preparation of
samples for PCR
223
the
manufacturer’s
recommendations.
The
precipitated RNA was dissolved in 30–50 µl of
RNAse-free water (Fermentas, Latvia).
To remove genomic DNA, the isolated RNA was
treated with RNAse-free DNAse (Fermentas, Latvia)
according to the manufacturer's recommendations.
cDNA was obtained from reverse transcription of 2 μg
of total RNA of each sample using the Oligo (dT)15
primer (BIOSSET, Russia), and the enzyme M-MLV
Reverse Transcriptase (Promega, USA) according to
the manufacturer's recommendations (200 u. M-MLV
reaction, reaction volume 25 µl).
Determination of mRNA levels of the tested
genes by quantitative PCR
All real-time PCR reactions were performed in a
iCycler IQ5 thermocycler (Bio-Rad, USA) in the
presence of the dye SYBR Green I. The volume of the
reaction mixture was 30 µl: 8,6 µl of water, 0,2 µl of
each forward and reverse primer (45 μM), 1 µl (5
units) of Taq polymerase (Fermentas, Latvia), and 5 µl
of cDNA were added to 15 µl of 2x buffer (7 mM
MgCl2, 130 mM Tris-HCl, pH 8,8, 32 mM (NH4)2SO4,
0,1% Tween-20, 0,5 mM of each dNTP). Primer
sequences and PCR conditions are presented in Table
1.
Total cellular RNA was isolated from cells by the
trizol method (TRI Reagent, Sigma, USA) according to
Table 1. List of genes, primers, and conditions of Real-Time SYBR Green I PCR
№
Name of gene
Genes, GenBank acc. N
GAPDH
NM_002046.3
Sequence of primers
(5'->3'):
F: TGAAGGTCGGAGTCAACGGATTTGGT
R: CATCGCCCCACTTGATTTTGGAGGG
Size of fragment (nucleotides)
PCR conditions
258
2
ACAN
NM_013227.3
F: GGCGAGCACTGTAACATAGACCAGG
R: CCGATCCACTGGTAGTCTTGGGCAT
206
3
LUM
NM_002345.3
F:ACCTGGAGGTCAATCAACTTGAGAAGTTTG
R: AGAGTGACTTCGTTAGCAACACGTAGACA
172
4
VCAN
NM_004385.4
F: CTGGCAAGTGATGCGGGTCTTTACC
R: GGAGCCCGGATGGGATATCTGACAG
278
5
COL1A1
NM_000088.3
F: GAAGACATCCCACCAATCACCTGCGTA
R: GTGGTTTCTTGGTCGGTGGGTGACT
227
6
COL2A1
NM_001844.4
F: AAGGAGACAGAGGAGAAGCTGGTGC
R: AATGGGGCCAGGGATTCCATTAGCA
299
1. 95º С – 3,5 min
2. 40 cycles
95ºС – 20 sec
66º С – 15 sec
72º С – 30 sec
84º С – 10 sec
1. 95ºС – 3,5 min.
40 cycles
95ºС – 20 sec.
66ºС – 15 sec.
72ºС – 30 sec.
88ºС – 10 sec.
1. 95º С – 3,5 min
2. 40 cycles
95º С – 20 sec.
64º С – 15 sec.
72º С – 30 sec
82º С – 10 sec
1. 95º С – 3,5 min
2. 40 cycles
95º С – 20 sec
66º С – 15 sec
72º С – 30 sec
86º С – 10 sec
1. 95º С – 3,5 min
2. 40 cycles
95º С – 20 sec
66º С – 15 sec
72º С – 30 sec
88º С – 10 sec
1. 95º С – 3,5 min
2. 40 cycles
95º С – 15 sec
1
Int. J. Med. Sci. 2019, Vol. 16
224
7
HAPLN1
NM_001884.3
F: GGTAGCACTGGACTTACAAGGTGTGGT
R: GGCTCTCTGGGCTTTGTGATGGGAT
222
8
PAX1
NM_006192.3
F: AACATCCTGGGCATCCGGACGTTTA
R: AGGGTGGAGGCCGACTGAGTGTAT
194
9
PAX9
NM_006194.3
F: CTCCATCACCGACCAAGTGAGCGA
R: GAGCCATGCTGGATGCTGACACAAA
212
10
SOX9
NM_000346.3
F: ACTACACCGACCACCAGAACTCCAG
R: AGGTCGAGTGAGCTGTGTGTAGACG
206
11
IHH
NM_002181.3
F: GATGAACCAGTGGCCCGGTGTG
R: CCGAGTGCTCGGACTTGACGGA
233
12
GHR
NM_000163.2
F: TGCCCCCAGTTCCAGTTCCAAAGAT
R: AGGTTCACAACAGCTGGTACGTCCA
284
13
IGF1R
NM_000875.3
F: CGCACCAATGCTTCAGTTCCTTCCA
R: CCACACACCTCAGTCTTGGGGTTCT
266
14
EGFR
NM_005228.3
F: ATAGACGACACCTTCCTCCCAGTGC
R: GTTGAGATACTCGGGGTTGCCCACT
177
15
TGFBR1
NM_001130916.1
F: GGGCGACGGCGTTACAGTGTT
R: AGAGGGTGCACATACAAACGGCCTA
179
16
SLC26A2
NM_000112.3
F: CCTGTTTTGCAGTGGCTCCCAA
R: CCACAGAGATGTGACGGGAGGT
208
17
CHST1
NM_003654.5
F: ATACGGCACCGTGCGAAACTCG
R: AGGCTGACCGAGGGGTTCTTCA
165
18
CHST3
NM_004273.4
F: AGAAAGGACTCACTTTGCCCCAGGA
R: TGAAGCTGGGAGAAGGCTGAATCGA
268
The PCR results were evaluated by the computer
program iCycler IQ 5. The specificity of the reaction
was determined by analyzing the melting curves of
65º С – 10 sec
72º С – 20 sec
88º С – 10 sec
1. 95º С – 3 min
30 sec
2. 40 cycles
95º С – 20 sec
67º С – 15 sec
72º С – 20 sec
87º С – 10 sec
1. 95º С – 3,5 min
2. 40 cycles
95º С – 20 sec
68º С – 15 sec
72º С – 30 sec
89,5º С – 10 sec
1. 95º С – 3,5 min
2. 40 cycles
95º С – 20 sec
68º С – 15 sec
72º С – 30 sec
89,5º С – 10 sec
1. 95º С – 3,5 min
2. 40 cycles
95º С – 20 sec
68º С – 15 sec
72º С – 30 sec
88º С – 10 sec
1. 95º С – 3,5 min
2. 40 cycles
95º С – 12 sec
58º С – 08 sec
72º С – 20 sec
89º С – 10 sec
1. 95º С – 3,5 min
2. 40 cycles
95º С – 20 sec
60º С – 15 sec
72º С – 30 sec
82º С – 10 sec
1. 95º С – 3,5 min
2. 40 cycles
95º С – 20 sec
66º С – 15 sec
72º С – 30 sec
85º С – 10 sec
1. 95º С – 3,5 min
2. 40 cycles
95º С – 20 sec
62º С – 15 sec
72º С – 30 sec
87º С – 10 sec
1. 95º С – 3,5 min.
2. 40 cycles
95º С – 25 sec
59º С – 05 sec
72º С – 20 sec
83º С – 10 sec
1. 95º С – 3,5 min.
2. 40 cycles
95º С – 25 sec
59º С – 05 sec
72º С – 20 sec
84º С – 10 sec
1. 95º С – 3,5 min.
2. 40 cycles
95º С – 15 sec
62º С – 10 sec
72º С – 20 sec
89º С – 10 sec
1. 95º С – 3,5 min.
2. 40 cycles
95º С – 20 sec
68º С – 15 sec
72º С – 20 sec
84º С – 10 sec
amplification products ranging from 65°C to 95°C in
increments of 1°C. To control PCR crosscontamination, RNAse-free water was added to the
Int. J. Med. Sci. 2019, Vol. 16
RNA precipitate, which was then used as a negative
control. The gene glyceraldehyde-3-phosphate
dehydrogenase (GAPDH) was used as a reference
housekeeping gene. PCR products obtained after
amplification of cDNA with specific primers were
used as standards.
To construct the calibration curves, serial
dilutions were prepared from obtained standards,
and the Real-Time SYBR Green I PCR reaction was
conducted.
The GAPDH gene was chosen as a reference
gene to evaluate the relative levels of mRNA
expression of target genes. The average value of a
target gene was divided by the average value of the
GAPDH gene for normalization. To represent the
data, the smallest value designated as a calibrator was
taken from the obtained normalized data. To calculate
the relative amount of a target gene, normalized
values of this gene were divided by the value of the
calibrator (Figures 3, 4).
Statistical analysis
Statistical analysis of the results was performed
using the package Microsoft Office Excel 2007 and the
standard software package STATISTICA 6,0. The
arithmetic mean value (M) and standard error of the
mean value (m) were determined. The nonparametric
statistical Mann-Whitney U-test was used to identify
the difference in the probability of compared
averages. Differences were considered significant at
the 5% significance level (p < 0.05). Factor analysis
was performed using the software package
STATISTICA 6,0.
225
Morphological and biochemical criteria of
growth asymmetry
Structural and functional organization of the
growth plates on the convex and concave sides of the
spinal deformity were studied to evaluate qualitative
and quantitative differences.
Biochemical data
The levels of proteoglycans (PG) and of their
constituent glycosaminoglycans (GAGs) on the
convex and concave sides of the deformity apex
quantified by biochemical methods are presented in
Table 2. Decreases in the share of PG1 in the total pool
of PG and in the level of sulfation, which reduces the
amount of chondroitin sulfate (CS) and raises the
amount of keratan sulfate (KS), were detected on the
concave side of the deformity.
Table 2. Characteristics of PG of the vertebral body growth
plates from different sides of curvature in IS patients (PG output is
calculated in µg per mg of tissue wet weight. The relative amount
of PG2 in the pool is shown as a percentage in parentheses).
PG output
CS/KS
Degree of
sulfation (%)
Convex side of deformity
n=18
PG1
PG2
18,4±2,25
38,2±3,89*
(63,5±3,62 (%))
1,28+0,098
0,75+0,058*
Concave side of deformity
n=18
PG1
PG2
10,2±1,56*1
28,8±1,74*1.2
(74,1±6,85 (%))
0,81+0,065*1
0,59+0,041*1.2
30,2±2,78
18,4±0,15*1
5,7±0,65*
7,7±0,84*2
PG1 – diffused PG; PG2 - PGs linked with collagen; * - significant difference р<0,05;
*1 - significant difference from analogous pool of convex side *2 - Significant
difference from PG of convex side
Results and discussion
Electrophoretic separation of PG from vertebral
body growth plates showed a reduction in the amount
of CS and an increase in KS.
Justification of the choice of candidate genes
determining the development of IS
Light microscopy analysis of growth plates of
the scoliotic deformity
One undeniable factor in the formation of
scoliotic deformity is the asymmetry of growth, which
rationalizes choosing the growth plate as a possible
source of misbalanced genetic growth regulations. By
the time of birth, the vertebral body undergoes
enchondral osteogenesis, with the exception of the
cartilaginous plate, which undergoes longitudinal
spinal growth. The process of growth in the postnatal
period is a step-morphogenesis, the essence of which
is proliferative periodization and chondrocyte
differentiation from minimal differentiation to
terminally
differentiated
chondrocytes
and
subsequent osteogenesis. Because regulations of both
embryonic and postnatal development follow the
same pattern [25], embryonic growth plates (12 weeks
of embryogenesis) were utilized as controls for the
study of gene expression levels.
The growth plate on the convex side of the
deformity showed preserved structural organization
(Figure 1A). Columns of chondrocytes are arranged
horizontally with respect to the axis of the spine and
consist of 4–5 cells with large nuclei and narrow rims
of cytoplasm. Groups of chondrocytes are embedded
in homogeneous matrix. There are 1–2 nucleoli and
dispersed chromatin in each nucleus. The
ultrastructure of these cells corresponds to the
differentiated stage. High polymeric CS are defined in
chondrocytes and extracellular matrix (Figure 1C).
The concave side of the growth plate is devoid of
zonal structuring. The poorly differentiated
chondroblasts are scattered in the matrix. Rare cell
groups, consisting of few cells, are localized in the
lower layers (Figure 1B). Highly polymerized
structures of CS are present in much low density in
the matrix and cells (Figure 1D).
Int. J. Med. Sci. 2019, Vol. 16
An
acellular
matrix
containing
highpolymerized PGs is located between the convex and
concave sides of the growth plate deformity. Vessels
penetrating vertebral growth plate are accompanied
by osteogenesis (data not shown).
Ultrastructural analysis.
Chondrocytes on the convex side (columnar
arrangement) have off-centre nuclei, with both
dispersed and condensed chromatin. The Golgi
apparatus with numerous vacuoles is dispersed
throughout the cytoplasm (Figure 2A). Ultrastructural
226
arrangement of chondrocytes on the concave side is
strongly modified: scarce Golgi apparatus, mainly
located near nuclei, connected to inflated cisternae of
the
endoplasmic
reticulum.
Nuclei
contain
electron-dense chromatin assembly (Figure 2B).
A layer of hypertrophic cells consists of two
types of chondrocytes: actively synthesizing and
terminally differentiated cells, some of which undergo
apoptosis. Cytoplasmic granules of CDH and
NADH-diaphorase are found in the cells of the
column layer and in the active hypertrophic cells. The
cytoplasm of the lower hypertrophic cell layers is
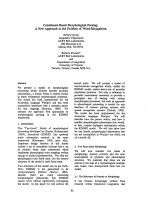
Figure 1. The vertebral body growth plate from the convex (A) and concave (B) sides of deformity in an IS patient. Hematoxylin & eosin staining, x200. Intensive staining for high
polymeric CS on the convex side (C) and diminishing staining for high polymeric CS in the concave side, (Hale’s reaction), x200.
Figure 2. Ultrastructural organization of chondroblasts of the vertebral body growth plate from the convex (A) and concave (B) sides of a deformity in IS, x5000.
Int. J. Med. Sci. 2019, Vol. 16
filled with granules of alkaline phosphatase (data not
shown).
Study of the expression of candidate genes
conceivably determining IS
Alterations in the structural organization of cells
and matrix on the concave side of the spinal deformity
are the obvious cause of growth asymmetry. The
presented data suggested the following basis for the
selection of possible candidate genes determining IS.
The expression levels of genes regulating the
differentiation and metabolism of growth plate
cartilage cells localized on the concave and convex
sides of the deformity were investigated to identify
genes whose hypo- or hyper-expression may cause
the development of IS. The following genes were
selected: genes involved in chondrocyte growth
regulation: growth factors (GHR, EGFR, IGF1R, and
TGFBR1), in differentiation signaling (IHH, PAX1,
PAX9, and SOX9), in the regulation of essential
protein synthesis – structural components of matrix
PGs (ACAN, LUM, VCAN, COL1A1, СOL2A1, and
HAPLN1), and in the sulfation and transmembrane
transport of sulfates (DTDST, CHST1, and CHST3).
The expression levels of genes of interest
measured relative to the expression level of the
227
housekeeping gene GAPDH are presented in Figure 3.
The studied genes can be divided into three groups
according to their expression levels in cells of patients
with IS relative to control cells: expression level does
not differ from the norm (ACAN, LUM, VCAN,
COL1A1, COL2A1, IGF1R, and GHST1), is below the
norm (PAX9, SOX9, HAPLN1, and GHR), and is
significantly higher than the norm (IHH, PAX1,
TGFBR1, EGFR, SLC26A2, and CHST3).
The genes of the first group (ACAN, LUM,
VCAN, COL1A1, COL2A1, IGF1R, and GHST1) are
mainly represented by genes encoding proteins or PG
core - peptide components of the matrix. The main
structural components of the matrix are collagen and
PGs [26, 27]. Collagen I is the major collagen type of
bone tissue. It is present in fetal cartilage and initiates
the differentiation of osteoblasts in the endochondral
osteogenesis zone [28-30]. Collagen II is the major
collagen of the mature cartilage matrix. It constitutes
the structural basis of the chondron and forms a
chondrometabolic barrier together with PGs [24].
Cartilage PGs perform metabolic, barrier, receptor,
and other functions [31, 32]. Aggrecan is the most
representative cartilage PG. It contains up to 100 CS
chains covalently bound to a protein core [33, 34].
Versican is a component of the extracellular matrix
Figure 3. Growth factors and chondroblast gene expression levels in vertebral body growth plates and fetal vertebra are shown using SYBR-Green real time RT–PCR. Relative
gene expression is calculated with respect to the GAPDH mRNA concentration as an internal control. Error bars represent standard deviation in each point. * - significant
difference (р < 0,05). А. Genes encoding growth factors, B. Genes encoding transcription factors, C. Genes encoding PGs, D. Genes encoding sulfate group metabolism-related
proteins.
Int. J. Med. Sci. 2019, Vol. 16
containing long CS chains. It is involved in chondron
formation, matrix stabilization, cell proliferation,
adhesion and migration in early embryogenesis [35].
The functions of lumican are to organize and "bind"
collagen fibers. Another gene in this group is CHST1
(carbohydrate (KS Gal-6) sulfotransferase 1), which
transfers sulfate groups [36].
Unchanging levels of expression of these genes
in patients with IS indicate that the protein matrix
components in this group are synthesized normally
and, apparently, cannot cause the development of IS.
A group of genes with low levels of expression in
IS consists of genes with different functions. Key
genes encoding the transcription factors PAX9, SOX9,
and GHR and the link-protein gene HAPLN1 are
found in this group. Low expression of HAPLN1 may
reduce the contact between the structural components
of the matrix, thus adversely affecting mechanical
properties of the cartilage [37]. Growth hormone is
one of the key hormones that regulate cartilage cell
metabolism [38]. Reduced GH receptor expression in
growth plate chondrocytes of the vertebral bodies, as
compared with the control, notably diminishes
binding of growth hormone by these cells and its
efficiency. The genes PAX9 and SOX9, encoding
transcription factors, are involved in the
differentiation of chondrogenic cells in both somites
and in growth plates during the postnatal period [39].
A high level of expression of PAX9 is typical for
minimally differentiated cells [40], and the expression
of SOX9 is necessary to induce the differentiation of
chondrocytes and endochondral osteogenesis [41].
The group of genes that are hyper-expressed in
IS includes IHH, PAX1, TGFBR1, EGFR, SLC26A2,
and CHST3. The PAX1 gene determines the pattern of
sclerotome segmentation and the development of the
intervertebral disc during formation of the axial
skeleton [41]. High expression of PAX1, which
228
regulates chondrogenic differentiation, was observed
in growth plate chondrocytes of patients with IS. It
likely indicative of a low level of differentiation of
chondrocytes because PAX1 is expressed at the early
stages of sclerotome chondrogenic differentiation [42].
The IHH gene is the principle transcription factor that
is involved in the recognition of activating signals
from both Bmp and IGF and is normally expressed in
prehypertrophic chondrocytes of the growth plate
[43]. We discovered single hypertrophic cells on the
concave sides of growth plates of IS patients, and a
high level of expression of this gene suggests a trend
towards chondrocyte hypertrophy in patients with IS.
The EGFR and TGFBR1 genes facilitate the expression
of the corresponding growth factor receptors, and
their expression is characteristic of actively
proliferating cells [41]. It is also known that both of
these factors are essential for the chondrocyte
differentiation of the vertebral column growth [42,
43]. Although data on the expression levels of these
genes are ambiguous, certain patterns could be
assumed. For example, biochemical data show a
decrease in PG sulfation and in CS relative to KS on
the concave side of the deformity, although the SHST3
gene (responsible for sulfation of CS) is overexpressed
and CHST1 expression remains stable. These data
may only suggest a different degree of sulfation of
these molecules. In turn, unbalanced expression of
genes can result in the disruption of differentiation
and physiological activity of cells. Because normal
expression patterns of the corresponding genes define
normal morphogenesis, alteration of cycling and gene
interactions lead to the formation of anomalous
structures [43]. Indeed, factor analysis showed a
fundamental difference between the groups of IS
patient samples and control samples. Each of the IS
patient samples had a combination of features
distinguishing it from the control sample (Figure 4).
Figure 4. Factor analysis of chondroblast gene expression in IS vertebra and normal fetal vertebra. Control samples (isolated from normal fetal vertebra) are marked in red, and
samples isolated from the concave and convex sides of damaged IS vertebra are marked in blue.
Int. J. Med. Sci. 2019, Vol. 16
Conclusion
In a previous repot, we presented new data on
the deposition of the neural crest cells into growth
plates of vertebral bodies [19]. It is known that during
migration, neural crest cells change their expression
profiles [44]. We hypothesize that changes in
expression of adhesion molecules [45] promoted
neural crest cell settlement in the sclerotome
mesenchymal environment [46]. As a putative
signaling pathway we suggest upregulation of Pax1.
Within the mesenchymal sclerotome, Pax1 is
subsequently downregulated in cells that undergo
chondrogenesis and only maintained in the
mesenchymal anlagen of the intervertebral discs and
the perichondrium of the vertebral bodies [47, 48].
Thus, even though Pax1 is required to initially trigger
chondrogenesis in the early sclerotome [39], Pax1
overexpression prevents chondrocyte maturation in
the differentiating sclerotome and inhibits Nkx3.2
expression and accumulation of proteoglycans [49],
explaining why after the establishment of the
chondrogenic lineage, Pax1 expression is supressed in
chondrocytes.
In this study we were able to demonstrate
altered expression of genes regulating CS sulfation
and corresponding protein synthesis in scoliotic
specimens
compared
with
control
tissues.
Biochemical analysis revealed 1) a decrease in
diffused PG in the total pool of PG; (2) reduced level
of their sulfation; 3) a reduction in the amount of CS
coinciding with an increased amount of KS; and 4)
reduced levels of sulfation on the concave side of the
scoliotic deformity. It was suggested that growth
asymmetry in IS patients is associated with complex
functional impairment of the vertebral cartilage cells.
Such impairment may be indicative of the existence of
cells with different phenotypes, which may not
respond to normal signals of differentiation in the
growth plate. Elevated expression levels of growth
factor receptors suggest a lack of growth factors or
intermediary molecules. Further study should be
directed toward the analysis of cartilage cell
subpopulations and their gene expression.
We strongly believe that identification of
alterations in gene expression causing IS is the first
step to break a theoretical barrier in finding the cure
for IS. Of course, a logical solution for the correction
of the altered gene expression would be local gene
modulation or protein compensation (DNA
transfection, RNA silencing, etc.), which is an
extremely difficult task. However, no matter how
difficult the suggested mission is, it will become a
practical challenge rather than a theoretical barrier if
we can identify the therapeutic targets.
229
Abbreviations
IS: idiopathic scoliosis; PG: proteoglycans;
GAGs: glycosaminoglycans; CS: chondroitin sulfate;
KS: keratan sulfate.
Acknowledgements
We thank Maria Afrazi and Lucas Trilling
(Arrowhead Pharmaceuticals) for technical assistance.
We also thank anonymous reviewers for the
comments that allowed us to improve the manuscript.
Competing Interests
The authors have declared that no competing
interest exists.
References
1.
2.
3.
4.
5.
6.
7.
8.
9.
10.
11.
12.
13.
14.
15.
16.
17.
18.
Fadzan M, Bettany-Saltikov J. Etiological Theories of Adolescent Idiopathic
Scoliosis: Past and Present. The open orthopaedics journal. 2017; 11: 1466.
Ogilvie J. Adolescent idiopathic scoliosis and genetic testing. Current opinion
in pediatrics. 2010; 22: 67-70.
Martin CT, Pugely AJ, Gao Y, Mendoza-Lattes SA, Ilgenfritz RM, Callaghan JJ,
et al. Increasing hospital charges for adolescent idiopathic scoliosis in the
United States. Spine (Phila Pa 1976). 2014; 39: 1676-82.
Cheng JC, Castelein RM, Chu WC, Danielsson AJ, Dobbs MB, Grivas TB, et al.
Adolescent idiopathic scoliosis. Nat Rev Dis Primers. 2015; 1.
Shinozaki K, Ebert O, Kournioti C, Tai YS, Woo SLC. Oncolysis of multifocal
hepatocellular carcinoma in the rat liver by hepatic artery infusion of vesicular
stomatitis virus. Molecular Therapy. 2004; 9: 368-76.
Sharma S, Gao X, Londono D, Devroy SE, Mauldin KN, Frankel JT, et al.
Genome-wide association studies of adolescent idiopathic scoliosis suggest
candidate susceptibility genes. Human molecular genetics. 2011; 20: 1456-66.
Somerville E. Rotational lordosis: the development of the single curve. The
Journal of bone and joint surgery British volume. 1952; 34: 421-7.
Roaf R. The basic anatomy of scoliosis. The Journal of bone and joint surgery
British volume. 1966; 48: 786-92.
Stokes I. Mechanical effects on skeletal growth. Journal of Musculoskeletal and
Neuronal Interactions. 2002; 2: 277-80.
Stokes IA, Burwell RG, Dangerfield PH. Biomechanical spinal growth
modulation and progressive adolescent scoliosis–a test of the'vicious
cycle'pathogenetic hypothesis: Summary of an electronic focus group debate
of the IBSE. Scoliosis. 2006; 1: 16.
Terhune EA, Baschal EE, Miller NH. Genetics and Functional Pathology of
Idiopathic Scoliosis. In: Kusumi K, Dunwoodie SL, editors. The Genetics and
Development of Scoliosis. Cham: Springer International Publishing; 2018. p.
159-78.
Gorman KF, Julien C, Moreau A. The genetic epidemiology of idiopathic
scoliosis. European spine journal : official publication of the European Spine
Society, the European Spinal Deformity Society, and the European Section of
the Cervical Spine Research Society. 2012; 21: 1905-19.
Wajchenberg M, Astur N, Kanas M, Martins DE. Adolescent idiopathic
scoliosis: current concepts on neurological and muscular etiologies. Scoliosis
and spinal disorders. 2016; 11: 4.
Wang WJ, Yeung HY, Chu WC, Tang NL, Lee KM, Qiu Y, et al. Top theories
for the etiopathogenesis of adolescent idiopathic scoliosis. Journal of pediatric
orthopedics. 2011; 31: S14-27.
Burwell RG, Aujla RK, Kirby AS, Dangerfield PH, Moulton A, Cole AA, et al.
Body mass index of girls in health influences menarche and skeletal
maturation: a leptin-sympathetic nervous system focus on the trunk with
hypothalamic asymmetric dysfunction in the pathogenesis of adolescent
idiopathic scoliosis? Studies in health technology and informatics. 2008; 140:
9-21.
Burwell RG, Aujla RK, Grevitt MP, Dangerfield PH, Moulton A, Randell TL, et
al. Pathogenesis of adolescent idiopathic scoliosis in girls - a double
neuro-osseous theory involving disharmony between two nervous systems,
somatic and autonomic expressed in the spine and trunk: possible dependency
on sympathetic nervous system and hormones with implications for medical
therapy. Scoliosis. 2009; 4: 24.
Burwell RG, Clark EM, Dangerfield PH, Moulton A. Adolescent idiopathic
scoliosis (AIS): a multifactorial cascade concept for pathogenesis and
embryonic origin. Scoliosis and spinal disorders. 2016; 11.
Burwell RG, Dangerfield PH, Moulton A, Grivas TB. Adolescent idiopathic
scoliosis (AIS), environment, exposome and epigenetics: a molecular
perspective of postnatal normal spinal growth and the etiopathogenesis of AIS
with consideration of a network approach and possible implications for
medical therapy. Scoliosis. 2011; 6: 26.
Int. J. Med. Sci. 2019, Vol. 16
19. Zaydman AM, Strokova EL, Kiseleva EV, Suldina LA, Strunov AA,
Shevchenko AI, et al. A New Look at Etiological Factors of Idiopathic Scoliosis:
Neural Crest Cells. International journal of medical sciences. 2018; 15: 436-46.
20. Zhang H, Marshall KW, Tang H, Hwang DM, Lee M, Liew CC. Profiling genes
expressed in human fetal cartilage using 13,155 expressed sequence tags.
Osteoarthritis and Cartilage. 2003; 11: 309-19.
21. Tagariello A, Schlaubitz S, Hankeln T, Mohrmann G, Stelzer C, Schweizer A,
et al. Expression profiling of human fetal growth plate cartilage by EST
sequencing. Matrix biology : journal of the International Society for Matrix
Biology. 2005; 24: 530-8.
22. Pogue R, Sebald E, King L, Kronstadt E, Krakow D, Cohn DH. A
transcriptional profile of human fetal cartilage. Matrix Biology. 2004; 23:
299-307.
23. Nerlich AG, Bachmeier BE, Schleicher E, Rohrbach H, Paesold G, Boos N.
Immunomorphological analysis of RAGE receptor expression and NF-kappaB
activation in tissue samples from normal and degenerated intervertebral discs
of various ages. Annals of the New York Academy of Sciences. 2007; 1096:
239-48.
24. Zaidman A, Zaidman M, Strokova E, Korel A, Kalashnikova E, Rusova T, et al.
The mode of inheritance of Scheuermann’s disease. BioMed research
international. 2013; 2013: 1-9.
25. Hojo H, Ohba S, Yano F, Chung UI. Coordination of chondrogenesis and
osteogenesis by hypertrophic chondrocytes in endochondral bone
development. Journal of bone and mineral metabolism. 2010; 28: 489-502.
26. James CG, Stanton LA, Agoston H, Ulici V, Underhill TM, Beier F.
Genome-wide analyses of gene expression during mouse endochondral
ossification. PloS one. 2010; 5: e8693.
27. Eames BF, de la Fuente L, Helms JA. Molecular ontogeny of the skeleton. Birth
defects research Part C, Embryo today : reviews. 2003; 69: 93-101.
28. Shepard JB, Gliga DA, Morrow AP, Hoffman S, Capehart AA. Versican
knock-down compromises chondrogenesis in the embryonic chick limb. Anat
Rec (Hoboken). 2008; 291: 19-27.
29. Roughley PJ. The structure and function of cartilage proteoglycans. European
cells & materials. 2006; 12: 92-101.
30. Luo W, Guo C, Zheng J, Chen TL, Wang PY, Vertel BM, et al. Aggrecan from
start to finish. Journal of bone and mineral metabolism. 2000; 18: 51-6.
31. Carney S, Muir H. The structure and function of cartilage proteoglycans.
Physiological reviews. 1988; 68: 858-910.
32. Roughley P. The structure and function of cartilage proteoglycans. European
cells & materials. 2006; 12.
33. Seyfried NT, McVey GF, Almond A, Mahoney DJ, Dudhia J, Day AJ.
Expression and purification of functionally active hyaluronan-binding
domains from human cartilage link protein, aggrecan and versican: formation
of ternary complexes with defined hyaluronan oligosaccharides. The Journal
of biological chemistry. 2005; 280: 5435-48.
34. Rossi A, Superti-Furga A. Mutations in the diastrophic dysplasia sulfate
transporter (DTDST) gene (SLC26A2): 22 novel mutations, mutation review,
associated skeletal phenotypes, and diagnostic relevance. Human mutation.
2001; 17: 159-71.
35. Nilsson O, Marino R, De Luca F, Phillip M, Baron J. Endocrine regulation of
the growth plate. Hormone research. 2005; 64: 157-65.
36. Kronenberg HM. Developmental regulation of the growth plate. Nature. 2003;
423: 332-6.
37. Akiyama H, Kim JE, Nakashima K, Balmes G, Iwai N, Deng JM, et al.
Osteo-chondroprogenitor cells are derived from Sox9 expressing precursors.
Proc Natl Acad Sci U S A. 2005; 102: 14665-70.
38. Hata K, Takashima R, Amano K, Ono K, Nakanishi M, Yoshida M, et al.
Arid5b facilitates chondrogenesis by recruiting the histone demethylase Phf2
to Sox9-regulated genes. Nat Commun. 2013; 4: 2850.
39. Rodrigo I, Hill RE, Balling R, Munsterberg A, Imai K. Pax1 and Pax9 activate
Bapx1 to induce chondrogenic differentiation in the sclerotome. Development.
2003; 130: 473-82.
40. Wang Q, Fang WH, Krupinski J, Kumar S, Slevin M, Kumar P. Pax genes in
embryogenesis and oncogenesis. J Cell Mol Med. 2008; 12: 2281-94.
41. Miraoui H, Oudina K, Petite H, Tanimoto Y, Moriyama K, Marie PJ. Fibroblast
growth factor receptor 2 promotes osteogenic differentiation in mesenchymal
cells via ERK1/2 and protein kinase C signaling. The Journal of biological
chemistry. 2009; 284: 4897-904.
42. Hall KC, Hill D, Otero M, Plumb DA, Froemel D, Dragomir CL, et al.
ADAM17 controls endochondral ossification by regulating terminal
differentiation of chondrocytes. Molecular and cellular biology. 2013; 33:
3077-90.
43. Park M, Ohana E, Choi SY, Lee MS, Park JH, Muallem S. Multiple roles of the
SO4(2-)/Cl-/OH- exchanger protein Slc26a2 in chondrocyte functions. The
Journal of biological chemistry. 2014; 289: 1993-2001.
44. Gammill LS, Bronner-Fraser M. Neural crest specification: migrating into
genomics. Nature Reviews Neuroscience. 2003; 4: 795.
45. Akitaya T, Bronner‐Fraser M. Expression of cell adhesion molecules during
initiation and cessation of neural crest cell migration. Developmental
Dynamics. 1992; 194: 12-20.
46. Scaal M. Early development of the vertebral column. Seminars in Cell &
Developmental Biology: Elsevier; 2016. p. 83-91.
47. Wallin J, Wilting J, Koseki H, Fritsch R, Christ B, Balling R. The role of Pax-1 in
axial skeleton development. Development. 1994; 120: 1109-21.
230
48. Takimoto A, Mohri H, Kokubu C, Hiraki Y, Shukunami C. Pax1 acts as a
negative regulator of chondrocyte maturation. Experimental cell research.
2013; 319: 3128-39.
49. Rainbow RS, Kwon H, Zeng L. The role of Nkx3. 2 in chondrogenesis.
Frontiers in biology. 2014; 9: 376-81.