Finger photoplethysmography: Intensive development and validation for noninvasive measurement of blood glucose
Bạn đang xem bản rút gọn của tài liệu. Xem và tải ngay bản đầy đủ của tài liệu tại đây (492.41 KB, 6 trang )
Journal of Science & Technology 136 (2019) 044-049
Finger-Photoplethysmography: Intensive Development and Validation for
Noninvasive Measurement of Blood Glucose
Dao Viet Hung*
Hanoi University of Science and Technology - No. 1, Dai Co Viet Str., Hai Ba Trung, Ha Noi, Viet Nam
Received: April 15, 2019; Accepted: June 24, 2019
Abstract
This paper presents a specialized design and intensive validations for measuring blood glucose using
photoplethysmography with pulsed light. Glucose level is an important index because whose excess can
cause serious complications. Photoplethysmography had been introduced as a potential method for daily
monitoring glucose level. Following the trend, most of the published studies focused on identifying the
correlation between the glycemic index and infrared light absorption. However, the simple measurement
system limits the development of the potential technique. This paper presents a specialized design and
intensive validations to apply and verify the use of pulsed light sources for developing more feasible
measurement devices. Experimental results not only confirmed applicabilities of the new design with
modulated light, but also exhibited remarkable phenomena and notable parameters for error prevention.
Hence, this research could contribute useful reference for further studies.
Keywords: Blood glucose, Glycemic index, Photoplethysmography, PPG
1. Introduction*
categories: invasive, minimally invasive, and noninvasive [4, 7]. The most common invasive technique
is blood analysis. The others could be using
implantable sensors [8] or accompanying with microdialysis [4]. Generally, these methods give accurate
results; however, have the potential risk of infection,
require complex execution, and cause physical
discomfort for patients. Some minimally invasive
techniques have been developed such as reverse
iontophoresis [9], ultrasonic (sonophoresis) [10],
laser-induced micropores [11], microneedle technique
[12]. These methods share a common drawback of
causing fewer injuries on the skin. Noninvasive
methods can be mainly divided into: optics-related
[13-16], bio-impedance spectroscopy [17], and
electrochemical [18-20]. Among these techniques, the
method of using photoplethysmography (PPG) to
detect the glycemic concentration has significantly
attracted researchers. The main basis of this method
is that the blood glucose strongly absorbs near
infrared (NIR) light with the wavelength of 750–1500
nm [21]. PPG has many outstanding features such as
paint-less, low-cost, easy to use, risk-free, and has
ability to monitor glucose level continuously.
In recent years, hundreds of millions of people
around the world have been affected by diabetes
mellitus (DM), one of the chronic diseases tending to
spread widely in an uncontrolled manner [1, 2]. In
2011, 336 million people had DM and it is predicted
to rise to 552 million in 2030 [3]. DM is a common
manifestation of metabolic disorder, the modern
lifestyle with unhealthy diets increases the morbidity
of this disease, particularly in adults. The glucose
concentration in human blood should be 3.9–7.8
mmol/l (70–140 mg/dl). Getting above or below this
threshold, the patient is in hyperglycemic or
hypoglycemic condition, respectively [4]. It is
considered that DM patients have a higher risk of the
amputation, loss of vision, renal dialysis, mortality,
and coronary artery disease [5]. However, the current
technologies cannot comprehensively cure the
diabetic patients [6]. Therefore, the need for
monitoring glycemic index in the body is increasingly
more concerned than ever. Indeed, it is essential to
frequently monitor the glycemic condition for early
treatment or adjust the diet to achieve normoglycemia
level. Hence, effective methods for self-monitoring
glucose concentration at home are urgently required.
In PPG technique, designing a good sensing
portion is one of the most important issues. In the
transmitter unit, the light source can be controlled in
two modes: continuous or pulse emission. The
advantage of using continuous emission is simplicity
of designing LED drivers and acquisition circuits [2224]. However, this method leads to inevitable
drawbacks such as limited light intensity and the
Over the past decades, in order to estimate the
blood glucose level, many approaches have been
developed. They can be classified into three
* Corresponding author: Tel.: (+84) 917.515.242
Email:
44
Journal of Science & Technology 136 (2019) 044-049
strong influence of the ambient light. This causes a
serious trouble when measuring thick tissues [25].
Another limitation could be the lack of ability to
conduct measurement with multiple wavelengths. The
approach of generating interleaved pulses of the light
at different wavelengths can address the above
drawbacks [8, 25-27]. However, the correlation
between signals obtained with the two modes of
emission is not considered and validated. There is
also no research revealing impossibility of occurring
cross-influence when generating interleaved pulses of
two different wavelength lights. In addition, although
blood glucose gains the peak of light absorption at the
wavelength of 1550 nm, water also absorbs strongly
this spectrum. This makes the magnitude of the
received signal completely unpredictable. A high gain
amplifier may necessary for the thick human fingers;
however, this can be saturated when measuring
thinner ones. Thus, there is a need for studies to
develop an intensive design and validate the method
of using pulsed light in blood glucose measurement.
achieved results could contribute to developing a
highly applicable device.
It should be noted that the aim of this work is to
develop a specialized design and validate the use of
pulsed light in measuring blood glucose. Methods of
estimating the glycemic concentration from the PPG
signal could be found in [23, 24, 28].
2. Method
2.1 Measurement hardware
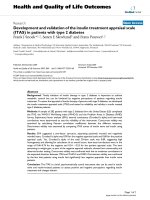
A complete system hardware is shown in Fig. 1.
On the transmitter side, the microcontroller unit
(MCU), digital-to-analog converter (DAC), and LED
drivers control the power, switching frequency, and
the pulse width of signals provide for two LEDs. On
the receiver side, the analog processing unit amplifies
and filters the signal before feed into an analog-todigital converter (ADC). Digital data are processed
by the MCU and transferred to displaying devices.
In this work, the author proposed a specialized
design and an experimental system to validate the use
of photoplethysmography with pulsed light for
noninvasive measurement of blood glucose. First, a
complete measurement hardware and a so-called
auto-adjustment process were proposed. This can
capture the PPG signal and adapt any thickness of the
fingers by regulating the average magnitude of the
received signal. The system uses two typical
wavelengths of 940 nm and 1550 nm in three modes:
continuous emission, pulse emission with single
LED, and pulse emission with two LEDs. The pulse
width and pulse frequency can be adjusted in
flexibility when testing. Second, a dedicated
experimental system and intensive validations were
proposed to identify any potential problem when
using pulsed light. All tests were conducted with a
phantom instead of real human fingers to ensure the
uniformity of the sample under test.
Fig. 1. System hardware with key blocks
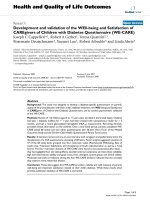
The two LED drivers were designed carefully
using the schematic shown in Fig. 2. Each of them
contains two MOSFETs: T1 controls the duty cycle
while T2 controls the LED current. Here, the
operational amplifier (Op-amp) A2, transistor T2, and
resistor Rsens allow exactly setting the current flow
through the LED in a wide range of about 10–600
mA. Thus, the MCU can easily adjust the light
intensities of the LEDs by controlling output voltages
of the DACs.
The experimental results not only confirmed the
desired operation of the proposed system, but also
exhibited notable facts for future designs. First, the
auto-adjustment process allows the system to work
fairly well with different thickness of the samples.
The pulse mode has a good ambient light noise
immunity if there is no abrupt change of background
light. Second, the validations showed that at low
switching frequencies, there is no difference between
the effect of continuous and pulse emission;
nonetheless, at higher frequency, there may be
differences because of signal distortion. The crossinfluence could occur when altering the two LEDs
without any idle state. However, this can be solved by
a short delay between them. Although the
experiments were conducted with phantom only, the
Fig. 2. Simplified schematic of the LED driver
45
Journal of Science & Technology 136 (2019) 044-049
The analog processing unit consists of three
major portions. The first stage is a current-to-voltage
converter (I-V converter) that converts and amplifies
the signal from a PIN photodiode, as shown in Fig. 3.
After being high-pass filtered with a cutoff frequency
of about 100 Hz at the second stage, the signal is
amplified again by an instrumentation amplifier in the
third stage. Finally, the output signal pass through a
low-pass filter for anti-aliasing. In order to regulate
the strength of the received signal, the system has an
auxiliary path to measure the output voltage of the IV converter without high-pass filtering.
magnitude (process value) of the received signal with
a desired value (set point) and adjusts the LED
current. Here, the average magnitude of the received
signal is obtained by filtering and digitizing the signal
from the auxiliary path. The set point is chosen of
about half the source voltage to maximize the
dynamic range of the signal. Because the process
value is nearly unchanged in each measurement, the
proportional gain can be easily adjusted, by using
manual tuning method. After auto-adjustment, the
luminous intensities of the LEDs are fixed and the
major measurement process is started.
2.3 Validation with Phantom
In order to validate the applicability of the
pulsed light in measuring the glycemic index, the
author used a simple phantom instead of real human
fingers. The main reason is that the human body
always changes by the time. This makes the
comparison between signals captured in different
period of time become meaningless. In contrast, an
artificial phantom allows performing many different
tests under almost same condition.
Fig. 3. Simplified schematic of the I-V converter
In some experiments, the author only measured
the signal at the output of the I-V converter (Uiv) and
signal at the output of the high-pass filter (Uhp) by a
high performance digital oscilloscope. This is to
obtain the best evaluation, without the influences of
skippable processing steps.
On the basis of the PPG mechanism, the author
created the phantom by using a small transparent
glove with blood inside. Theoretically, PPG is an
optical method to detect blood and its substances
volume changes. Blood parameters could be
estimated, if any, based on processing these
variations. Hence, liquid blood in a soft container can
be used to verify the behavior of the PPG in blood
glucose measurement.
Regarding the component selection, the author
chose following configuration for the hardware
system:
• Main NIR LED: MTE5015-525 (Marktech
Optoelectronics), with the wavelength of 1550
nm.
The structure of the phantom is illustrated in
Fig. 4. One finger of the glove was filled up with
blood and surrounded by a hard shell. The glove
material is chosen to be almost transparent to the
measurement wavelengths. A motor and a cam were
used to change the pressure inside the finger
periodically. This makes the volume of blood and
glucose solution in the glove fingertip rises and falls
continuously. The periodical changes in glucose
volume at fingertip make sure the uniformity of the
tests during a short period of time. This experimental
setup is a novelty of this study.
• Auxiliary NIR LED: IR333-A
(Everlight
Electronics), with the wavelength of 940 nm.
• Photodiode:
C30641GH
(Excelitas
Technologies) with a large area InGaAs PIN
junction.
• I-V converter: using OPA2727 (Texas
Instruments), a high precision CMOS Op-amp.
• LED driver: using MAX44246 (Maxim
Integrated), a rail-to-rail output Op-amp.
• Microcontroller: Tiva TM4C123GH6PM (Texas
Instruments) with integrated 16-bit PWM unit.
2.2 Auto-adjustment process
The auto-adjustment process is an important
contribution of this study. The process is performed
at the beginning of each measurement to find out the
optimal luminous intensities for the LEDs. This takes
a few second before each test by using a proportional
controller. The MCU compares the average
Fig. 4. Simple phantom and experimental setup
46
Journal of Science & Technology 136 (2019) 044-049
Voltage before filtering, Uiv (V)
3. Experiments and Results
3.1 Experimental Steps
Using the proposed design, the author
performed four separated experiments to evaluate and
validate the use of pulsed light. In the first test, the
size of the artificial finger is changed before each
measurement to evaluate the effectiveness of the LED
auto-adjustment process. In the second test, the motor
is stopped. The main NIR LED is turned on by a
continuous current in five second, then by a pulse of
10% duty cycle in the next five seconds. A strong and
controllable lamp is used to change the ambient light.
The values of both Uiv and Uhp were recorded for
comparison. In the third test, the motor rotates at a
speed of 70 revolutions per minute for simulating the
change in blood pressure. The main NIR LED is
turned on by a continuous current in five second; then
by a pulse of 1 kHz, 10% duty cycle, in the next five
seconds. The values of Uiv were fully recorded for
comparison. In the final test, each LED is powered by
a pulse of 10% duty cycle, alternatingly. The motor
runs in five seconds and stops during the next five
seconds. The values of Uiv were also fully recorded
by the digital oscilloscope for evaluation.
1.0
0.0
-1.0
-2.0
(a)
-3.0
-4.0
-5.0
0
5
10
15
20
Voltage after filtering, Uhp (V)
Time (ms)
1.0
0.0
-1.0
-2.0
(b)
-3.0
-4.0
-5.0
0
5
10
15
20
Time (ms)
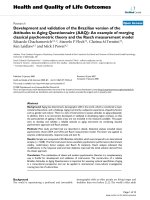
Fig. 5. Measured signals when the ambient light is
changed: (a) before filtering, and (b) after filtering
I-V converter output, Uiv (V)
1.0
3.2 Results
The first test confirmed a fairly good ability of
the proposed design to regulate the strength of the
received signal. The author also verified the ability of
the LED to flash a high intensity of light. When
working with a pulse of 10% duty cycle, the LED can
be powered up to 600 mA, six times greater than the
maximum acceptable average current, without any
problem. At this intensity, the experiment confirmed
that the light can pass through a thick layer of water.
However, if the artificial finger is too big, the
received signal could be very weak because of the
limited ability to penetrate.
0.0
-1.0
-2.0
(a)
-3.0
-4.0
-5.0
0.0
0.5
1.0
1.5
2.0
Time (ms)
I-V converter output, Uiv (V)
1.0
In the second test, the pulse emission mode
showed an excellent ambient light noise immunity,
whereas the signal in the continuous emission mode
was strongly affected by the background light. Fig. 5
shows the signals at the output of the I-V converter
and the output of the high-pass filter when the
ambient light is changed. The slow variation of the
whole wave totally disappears after passing the filter.
In fact, when the ambient light changes fast (e.g.,
abruptly turn on or turn off the lamp) the output of
the high-pass filter has transient voltage. However,
the influence is very small and negligible. On the
other hand, if the ambient light is much stronger than
the LED light, the sensing circuit can be partially or
fully saturated. In this case, there is neither noise
immunity nor accurate data.
0.0
-1.0
-2.0
(b)
-3.0
-4.0
-5.0
0.0
0.5
1.0
1.5
2.0
Time (ms)
Fig. 6. Cross-influence between two pulses of the
lights when: (a) there is no idle time, and (b) there is
a delay of 80 μs
In the next test, when the switching frequency of
the LED is 1 kHz or lower, there is no difference
between the shapes and amplitudes of the captured
signals in the two emission modes. However, when
both the switching frequency of the pulse and the
gain of the I-V converter are high, the captured signal
of the pulse emission mode has significant distortion.
This can cause serious measurement error.
47
Journal of Science & Technology 136 (2019) 044-049
In the final test, cross-influence occurred when
altering the two LEDs without any idle state. The
light from the auxiliary LED strongly affects the
signal induced by the main LED, as shown in Fig.
6(a). Even, the signal from the main LED could be
overridden if the pulse of the lights is short.
Nevertheless, when there is a delay of about 80 μs
between the two pulses, the cross-influence is no
longer significant, as shown in Fig. 6(b).
measurement of blood glucose. The whole proposed
system and validation results could contribute to
developing a highly applicable device.
Acknowledgments
This research is funded by Hanoi University of
Science and Technology (HUST) under grant number
T2017-PC-110.
References
4. Discussion
The auto-adjustment process has notable
advantages. This allows the proposed system to be
able to measure the PPG signal at the desired and
optimal set point. There is no influence of the control
loop to the measurement signal because this process
is only activated at the beginning and disabled during
the test.
At high frequency of pulsed light, the distortion
in the captured signal could be the effect of the
combination among the photodiode parasitic
capacitance, CF, RF (see Fig. 3), and the limited
bandwidth of the Op-amp. This could be reduced by
using higher quality components. In fact, high
frequency may not really necessary for measuring the
slow changes in the glucose level.
The ambient light noise immunity and crossinfluence effect of the whole system could depend on
the DC operating points (DC bias) of both the
transmitter and the receiver. Higher transmitting light
power may have a better ambient light noise
immunity; however, have greater potential of crossinfluence.
5. Conclusion
In this work, the author has been successfully
proposed a new measurement system and carefully
validated the method of using photoplethysmography
with pulsed light for measuring glycemic index. In
the proposed system, the dedicated measurement
hardware and the special auto-adjustment process
allow capturing the PPG signal from different finger
thicknesses under the optimal conditions. Although
experiments were conducted with phantom only, the
achieved results exhibited some remarkable
phenomena and notable parameters when using
pulsed light. First, the intensive tests confirmed a
good immunity of the pulsed light from the
background light if the set point is well established.
This advantage is very meaningful for developing
wearable devices. Second, the recorded data
confirmed the applicabilities of the pulse emission
mode at low frequencies, whereas the higher ones
could cause serious errors. Finally, the author
discovered and addressed the cross-influence problem
when using the two typical wavelengths for
[1]
D. R. Whiting, L. Guariguata, C. Weil, and J. Shaw,
IDF Diabetes Atlas: Global Estimates of the
Prevalence of Diabetes for 2011 and 2030, Diabetes
Research and Clinical Practice. 94:3, (2011) 311–321.
[2]
A. F. Amos, D. J. McCarty, and P. Zimmet, The
Rising Global Burden of Diabetes and Its
Complications: Estimates and Projections to the Year
2010, Diabetic Medicine, 14:12, (1997) S7–S85.
[3]
International Diabetes Federation, IDF Diabetes
Atlas, 23–44, Brussels, 5th ed. 2011.
[4]
S. Delbeck, T. Vahlsing, and S. Leonhardt, NonInvasive Monitoring of Blood Glucose Using Optical
Methods for Skin Spectroscopy—Opportunities and
Recent Advances, Analytical and Bioanalytical
Chemistry, 11:1, (2018) 63–77.
[5]
K. Al-Rubeaan, The Impact of Diabetes Mellitus on
Health and Economy of Gulf Cooperation Council
Countries, Diabetes Management, 4:4, (2014) 49–58.
[6]
W. Xu, Y. Deng, and M. Zhang, A New Strategy for
Early Diagnosis of Type 2 Diabetes Mellitus by
Standard-Free, Label-Free LC-MS/MS Quantifcation
of Glycated Peptides, Diabetes, (2013) DB_130347.
[7]
P. J. Watkins, ABC of Diabetes, BMJ Books,
London, 5th ed. 2003.
[8]
A. Trabelsi, M. Boukadoum, and M. Siaj, A
Preliminary Investigation into the Design of an
Implantable Optical Blood Glucose Sensor, American
Journal of Biomedical Engineering, 1:2, (2011) 62–
67.
[9]
J. A. Tamada, S. Garg, L. Jovanovic, K. R. Pitzer, S.
Fermi, and R. O. Potts, Noninvasive Glucose
Monitoring: Comprehensive Clinical Results, Jama American Medical Association, 282:19, (1999) 1839–
1844.
[10] J. Kost, M. Pishko, and S.Mitragotri, Transdermal
Monitoring of Glucose and Other Analytes Using
Ultrasound, Nature Medicine, 6:3, (2000) 347–350.
[11] J. Kottmann, J. M. Rey, and M. W. Sigrist, MidInfrared Photoacoustic Detection of Glucose in
Human Skin: Towards Non-Invasive Diagnostics,
Sensors, 16:10, (2016) 1–14.
[12] K. Takeuchi and B. Kim, Functionalized
Microneedles for Continuous Glucose Monitoring,
Nano Convergence, 5:28, (2018) 1–10.
48
Journal of Science & Technology 136 (2019) 044-049
[13] N. V. Alexeeva and M. A. Arnold, Impact of Tissue
Heterogeneity on Noninvasive Near-Infrared Glucose
Measurements in Interstitial Fuid of Rat Skin, Journal
of Diabetes Science and Technology, 4:5, (2010)
1041–1054.
[21] H. M. Heise and A. Bittner; Near Infrared
Spectrometric Investigation of Pulsatile Blood Flow
for Non-Invasive Metabolite Monitoring; The 11th
International Conference on Fourier Transform
Spectroscopy; New York; 1998; 282–285.
[14] L. Heinemann and G. Schmelzeisen-Redeker, NonInvasive Continuous Glucose Monitoring in Type I
Diabetic Patients with Optical Glucose Sensors,
Diabetologia, 41:7, (1998) 848–854.
[22] C. D. Bobade and M. S. Patil, Non-Invasive Blood
Glucose Level Monitoring System for Diabetic
Patients Using Near-Infrared Spectroscopy, American
Journal of Computer Science and Information
Technology, 4:1, (2016).
[15] M. A. Pleitez, T. Lieblein, A. Bauer, O. Hertzberg, H.
Lilienfeld-Toal, and W Mäntele, In Vivononinvasive
Monitoring of Glucose Concentration in Human
Epidermis by Mid-infrared Pulsed Photoacoustic
Spectroscopy, Analytical Chemistry, 85:2, (2012)
1013–1020.
[23] P. Daarani and A. Kavithamani, Blood
Glucose
Level Monitoring by Noninvasive Method Using
Near Infrared Sensor, International Journal of Latest
Trends in Engineering and Technology, (2017) 141–
147.
[16] R. Pandey, S. K. Paidi, T. A Valdez, C. Zhang, N.
Spegazzini, R. R. Dasari, and I. Barman, Noninvasive
Monitoring of Blood Glucose with Raman
Spectroscopy, Accounts of Chemical Research, 50:2,
(2017) 264–272.
[24] C. D. Chua, I. M. Gonzales, E. Manzano, and M. C.
Manzano; Design and Fabrication of a Non-Invasive
Blood Glucometer Using Paired Photo-Emitter and
Detector Near-Infrared LEDs; DLSU Research
Congress; Philippines; 2014.
[17] G. Gelao, R. Marani, V. Carriero, and A. G. Perri,
Design of a Dielectric Spectroscopy Sensor for
Continuous and Non-Invasive Blood Glucose
Monitoring, International Journal of Advances in
Engineering & Technology, (2012) 55–64.
[25] Y. Yamakoshi, K. Matsumura, T. Yamakoshi, J. Lee,
P. Rolfe, Y. Kato, K. Shimizu, and K. Yamakoshi,
Side-Scattered
Finger-photoplethysmography:
Experimental Investigations Toward Practical
Noninvasive Measurement of Blood Glucose, Journal
of Biomedical Optics, 22:6, (2017) 067001.
[18] J. Kim, A. S. Campbell, and J. Wang, Wearable noninvasive epidermal glucose sensors: A review.
Talanta, 177, (2018) 163–170.
[26] B. Javid, F. F. Ghazvini, Fahime, and S. Zakeri,
Noninvasive Optical Diagnostic Techniques for
Mobile Blood Glucose and Bilirubin Monitoring,
Journal of Medical Signals & Sensors, 8:3, (2018)
125–139.
[19] E. Cengiz and W. V. Tamborlane, A Tale of Two
Compartments: Interstitial Versus Blood Glucose
Monitoring, Diabetes Technology & Therapeutics,
11:1, (2009) S11–S16.
[27] M. Vanitha, G. Mathew, K. S. Divya, and R. Vignesh,
Non-Invasive Glucose Estimation Using IR
Spectroscopy, International Journal of Scientific and
Research Publications, 6:5, (2016) 217–220.
[20] S. N. Thennadil, J. L. Rennert, B. J. Wenzel, K. H.
Hazen, T. L. Ruchti, and M. B. Block, Comparison of
Glucose Concentration in Interstitialfluid and
Capillary and Venous Blood During Rapid Changes
in Blood Glucose Levels, Diabetes Technology &
Therapeutics, 3:3, (2009) 357–365.
[28] Duong Trong Luong, Nguyen Xuan Huy, Dao Viet
Hung, Nguyen Thai Ha, and Nguyen Duc Thuan,
Research and Design a Non- Invasive Blood Glucose
Measuring Module, American Journal of Biomedical
Sciences, 10:3, (2018) 149–156.
49