Palmitate induced regulation of PPARγ via PGC1α: A mechanism for lipid accumulation in the liver in non-alcoholic fatty liver disease
Bạn đang xem bản rút gọn của tài liệu. Xem và tải ngay bản đầy đủ của tài liệu tại đây (1.28 MB, 10 trang )
Int. J. Med. Sci. 2016, Vol. 13
Ivyspring
International Publisher
169
International Journal of Medical Sciences
Research Paper
2016; 13(3): 169-178. doi: 10.7150/ijms.13581
Palmitate-induced Regulation of PPARγ via PGC1α: a
Mechanism for Lipid Accumulation in the Liver in Nonalcoholic Fatty Liver Disease
Hitoshi Maruyama, Soichiro Kiyono, Takayuki Kondo, Tadashi Sekimoto, Osamu Yokosuka
Department of Gastroenterology and Nephrology, Chiba University Graduate School of Medicine, 1-8-1, Inohana, Chuou-ku, Chiba, 260-8670, Japan
Corresponding author: Hitoshi Maruyama. TEL: 81-43-2262083, FAX: 81-43-2262088, E-MAIL:
© Ivyspring International Publisher. Reproduction is permitted for personal, noncommercial use, provided that the article is in whole, unmodified, and properly cited. See
for terms and conditions.
Received: 2015.08.17; Accepted: 2015.11.11; Published: 2016.02.11
Abstract
The aim was to examine the effect of free fatty acids on the regulation of PPARγ-PGC1α pathway,
and the effect of PPARγ/PGC1α in NAFLD. The mRNA and protein expression of PGC1α and
phospho/total PPARγ were examined in Huh7 cells after the palmitate/oleate treatment
with/without the transfection with siRNA against PGC1a. The palmitate content, mRNA and
protein expression of PGC1α and PPARγ in the liver were examined in the control and NAFLD
mice. Palmitate (500 μM), but not oleate, increased protein expression of PGC1α and phospho
PPARγ (PGC1α, 1.42-fold, P=0.038; phospho PPARγ, 1.56-fold, P=0.022). The palmitate-induced
PPARγ mRNA expression was reduced after the transfection (0.46-fold), and the protein expressions of PGC1α (0.52-fold, P=0.019) and phospho PPARγ (0.43-fold, P=0.011) were suppressed in siRNA-transfected cells. The palmitate (12325.8 ± 1758.9 μg/g vs. 6245.6 ± 1182.7 μg/g,
p=0.002), and mRNA expression of PGC1α (11.0 vs. 5.5, p=0.03) and PPARγ (4.3 vs. 2.2,
p=0.0001) in the liver were higher in high-triglyceride liver mice (>15.2 mg/g) than in
low-triglyceride liver mice (<15.2 mg/g). The protein expressions of both PGC1α and PPARγ were
higher in the NAFLD group than in the controls (PGC1α, 1.41-fold, P=0.035; PPARγ, 1.39-fold,
P=0.042), and were higher in the high-triglyceride liver group (PGC1α, 1.52-fold, p=0.03; PPARγ,
1.22-fold, p=0.05) than in the low-triglyceride liver group. In conclusion, palmitate appear to
up-regulate PPARγ via PGC1α in Huh7 cells, and both PGC1α and PPARγ are up-regulated in the
NAFLD mice liver, suggesting an effect on lipid metabolism leading to intrahepatic triglyceride
accumulation.
Key words: Palmitate; peroxisome proliferator-activated receptor γ; peroxisome proliferator-activated receptor
coactivator 1 α; triglyceride; liver; nonalcoholic fatty liver disease
Introduction
Nonalcoholic fatty liver disease (NAFLD) is increasing worldwide as one of the leading causes of
chronic liver diseases [1-3]. The condition comprises
nonalcoholic fatty liver (NAFL) and nonalcoholic steatohepatitis (NASH), both with hepatic steatosis; the
latter is distinguished from the former by the presence
of cytological ballooning and inflammation on histology [4, 5]. NAFLD is closely associated with obesity, diabetes, hyperlipidemia, physical inactivity, and a
high-fat diet [6-8]. Although the mechanism is still
unclear, free fatty acids (FFA) may play a critical role
in the development of NAFLD [9-13].
The PPARs (peroxisome proliferator-activated
receptors) belong to the nuclear receptor superfamily.
There are 3 subtypes in the PPAR family, PPARα,
PPARδ/β, and PPARγ, and tissue distribution varies
depending on the subtype: PPARα is found mainly in
liver, heart, and kidney; PPARγ mainly in adipose
tissue; and PPARδ is ubiquitously-distributed [14-16].
They function as transcription factors which control
the expression of genes involved in fat and glucose
metabolism, and cellular proliferation and differenti
Int. J. Med. Sci. 2016, Vol. 13
ation. They act by binding to the promoter of the target gene after forming a heterodimer with the retinoid
X receptor. Previous studies have shown a close relationship between PPAR and clinical presentations
such as diabetes, obesity, and inflammation [17].
Various biological functions regulated by PPARγ may
account for the principal mechanisms for type 2 diabetes [18] and arteriosclerosis [19-21].
The peroxisome proliferator-activated receptor
coactivator 1 (PGC1) comprises a family of transcriptional coactivators, including PGC1α, PGC1β, and the
PGC related coactivator (PRC) [22]. PGC1α shows an
interaction with transcriptional factors like PPARα,
PPARγ, estrogen-related receptor, liver X receptor,
and hepatocyte nuclear factor-4α. In addition, PGC1α
functions as a regulator of mitochondrial metabolism
[23]. It regulates energy, glucose and fat metabolism,
and is recognized as an important therapeutic target
for diabetes and obesity.
Based on these backgrounds, we hypothesized
that PGC1α and PPARγ may have an interactive effect
on the pathogenesis of NAFLD. The study investigated the expression of PGC1α and PPARγ in
FFA-treated culture cells, and measured the content of
palmitate and expression of PGC1α and PPARγ in
NAFLD mice with respect to the triglyceride content.
The aim of this study was to examine the in vivo and
in vitro effect of fatty acid via PGC1α and PPARγ in
the pathogenesis of NAFLD.
Materials and Methods
Cell culture
A human hepatoma cell line (Huh7) was used in
the study. Cells were cultured in Dulbecco's Modified
Eagle's Medium (DMEM) supplemented with 10%
heat-activated fetal bovine serum, 100 IU/ml penicillin, and 100 μg/ml streptomycin.
FFA treatment
Two FFAs were used in the study, palmitate and
oleate; they were purchased from Sigma Chemical
Company (St. Louis, MO). The cells (500,000
cells/well) seeded in the 6-well plates were incubated
with each of FFAs mixed with 5% bovine serum albumin at final concentrations of 100-1000 μM.
Cell transfection
Huh7 cells were seeded on 6-well plates, and
transfection with siRNA against PGC1α (sc-38884)
was performed according to the manufacturer's protocol (Santa Cruz Biotechnology, Inc., Dallas, TX). The
scrambled sequence that does not lead to the specific
degradation of any known cellular mRNA (sc-37007)
was used as a control. Huh7 cells were incubated for
6 h with the transfection reagent, and normal growth
170
medium containing serum and antibiotics was added
for overnight incubation. Then, the medium was replaced with normal growth medium and the cells
were used for FFA-treatment procedures 1 day later.
Animal model for NAFLD
The study used six- to ten-week-old male
STAMTM mice, which were purchased from Stelic Institute & Co. (Charles River Laboratories, Japan Inc.)
and sacrificed to obtain liver tissue. The mouse model
was established by the following protocol supported
by the similar procedure in the literature [24];
2-day-old male pups were injected with streptozotocin (200 μg per mouse) and started on a high-fat diet
(HFD-32) from the age of 4 weeks. The animals develop steatosis to steatohepatitis from 6 to 8 weeks of
age, and fibrosis from 9 to 12 weeks of age, showing
various grades of NAFLD. The study also used control mice under control diet. The mice were euthanized by the inhalation of methoxyflurane to take
the blood and liver sample. Animal care and study
protocols were approved by the Animal Care Committee of Chiba University.
Real-time quantitative reverse transcription
polymerase chain reaction
Total RNA in the cell or tissue was extracted
using TRIzol reagent according to the manufacturer's
protocol (Invitrogen, Carlsbad, CA). Single-strand
cDNAs were synthesized from 2 μg total RNA in a 20
μL reaction (SuperScript® VILOTM, cDNA Synthesis
Kit, Invitrogen). Polymerase chain reactions (PCR)
were performed using cDNA, SYBR green (Platinum® SYBR® Green qPCR SuperMix-UDG with
ROX, Invitrogen) and primers for PGC1α, PPARγ,
and glyceraldehyde-3-phosphate dehydrogenase
(GAPDH, endogenous control), purchased from
Takara Bio (Tokyo, Japan; Table 1, 2). Reactions were
run in triplicate and data were calculated as the
change in cycle threshold (ΔCT) for the target gene
relative to the ΔCT for GAPDH.
Protein extraction and western blot analysis
Cell lysates and liver samples after homogenization were centrifuged at 12,000 g for 15 min and proteins in the supernatants were used for western blotting to detect PGC1α, phospho PPARγ (S112) and
PPARγ.
Proteins were separated using 4%-12% NuPAGE® Novex Bis-Tris Mini Gels (Invitrogen) and
were transferred to a nitrocellulose membrane for
1.5 h at 40 V using a western blot apparatus (Invitrogen). After overnight incubation with primary antibody, the membranes were washed and then incubated with horseradish peroxidase-conjugated secondary antibodies. Proteins were detected with an
Int. J. Med. Sci. 2016, Vol. 13
171
enhancement using SuperSignal chemiluminescence
reagent (Pierce Biotechnology, Inc., Rockford, IL) and
the density was quantified using an LAS-4000UV (Fuji
Film, Tokyo, Japan) and Adobe Photoshop (CS4;
Adobe Systems, San Jose, CA). Primary antibodies
were purchased as follows: phospho PPARγ and
PPARγ from Abcam® (Tokyo, Japan) and PGC1α
from Santa Cruz Biotechnology, Inc. (Dallas, TX). A
secondary antibody and β-actin were purchased from
Cell Signaling (Beverly, MA).
Statistical analysis
Table 1. Primers for quantitative polymerase chain reaction
(human)
Changes in mRNA expression of PGC1α after
palmitate treatment in Huh7 cells
Gene
PGC1α
Firstly, a 500 μM dose of palmitate was used according to the literatures [26,27]. The mRNA expression of PGC1α showed incubation time-related
changes and maximum expression (15.7-fold change
vs. control) was observed after 12 h of treatment
(Figure 1A). Next, changes in mRNA expression of
PGC1α were examined after 12 h of treatment with
different doses of palmitate, ranging from 100 to 1000
μM. The mRNA expression of PGC1α showed
dose-related changes and maximum expression
(12.5-fold change vs. control) was observed at a dose
of 500 μM palmitate (Figure 1B).
PPARγ
GAPDH
Forward/reverse
Forward
Reverse
Forward
Reverse
Forward
Reverse
Sequence 5’-3’
GGAGACGTGACCACTGACAATGA
TGTTGGCTGGTGCCAGTAAGAG
TTGAAAGAAGCCAACACTAAACCAC
AATGGCATCTCTGTGTCAACCAT
GCACCGTCAAGGCTGAGAAC
TGGTGAAGACGCCAGTGGA
Table 2. Primers for quantitative polymerase chain reaction
(mouse)
Gene
PGC1α
PPARγ
GAPDH
Forward/reverse
Forward
Reverse
Forward
Reverse
Forward
Reverse
Sequence 5’-3’
ACACAACGCGGACAGAATTGAG
TCACAGGTGTAACGGTAGGTGATG
GGAGCCTAAGTTTGAGTTTGCTGTG
TGCAGCAGGTTGTCTTGGATG
TGTGTCCGTCGTGGATCTGA
TTGCTGTTGAAGTCGCAGGAG
Quantification of lipid accumulation
Lipid accumulation in the cultured cells was
quantitatively assessed using Steatosis Colorimertic
Assay kit (Cayman Chemical Company, MI). After
overnight incubation of 5,000 cells/well in 96 well
plates, the cells were transfected with siRNA against
PGC1α or scrambled RNA, both followed by 24-h
palmitate treatment (500 μM). The cells were stained
according to the manufacture’s protocol, and lipid
accumulation was determined by the absorbance at
490nm. The lipid accumulation was expressed as a
ratio of FFA-treated cells to control (untreated cells).
Lipid analysis in the mouse liver tissue
Lipids were extracted from liver tissue (approximately 100 mg per mouse) according to Folch’s
method with chloroform/methanol [25]. Triglyceride
and total cholesterol were quantified using Cholestest® (Sekisui Medical Corp. Tokyo, Japan). Total fatty
acid content (free and esterified, μg/g) in the liver
tissue was measured by gas chromatography (GC
profiles) with the samples prepared by chloroform
and methanol using GC-2010 Plus (Shimadzu, Kyoto,
Japan).
Data are presented by mean ± standard deviation, or range. Continuous variables were compared
by the Student’s t-test or Fisher’s Protected Least Significant Difference test. P-values less than 0.05 were
considered statistically significant in all analyses. Statistical analysis was performed using the Dr. SPSS
software package (version 11.0J for Windows; SPSS
Inc., Chicago, Illinois, USA).
Results
Changes in mRNA expression of PGC1α after
oleate treatment in Huh7 cells
Time-related changes in mRNA expression of
PGC1α were also examined after treatment with
500 μM oleate. There were no significant changes in
the expression after oleate treatment (Figure 2A).
Similarly, mRNA expression of PGC1α showed no
significant changes after 12 h of treatment with different doses of oleate, ranging from 100 to 1000 μM
(Figure 2B).
Changes in mRNA expression of PPARγ after
FFA treatment
Time-related changes in mRNA expression of
PPARγ were examined after treatment with 500 μM
palmitate and the maximum increase (3.92-fold
change vs. control, Figure 3A) was seen after 24 h of
incubation. However, the mRNA expression of
PPARγ did not show any significant change after
treatment with 500 μM oleate over an incubation time
ranging from 3 to 24 h (Figure 3B).
Regulation of mRNA expression of PPARγ by
PGC1α
The mRNA expression of PGC1α after 500 μM of
palmitate treatment was significantly decreased in
Huh7 cells transfected with siRNA against PGC1α
(0.17-fold vs. control after 12 h of treatment, 0.23-fold
Int. J. Med. Sci. 2016, Vol. 13
vs. control after 24 h of treatment) (Figure 4A, 4B). The
mRNA expression of PPARγ after 500 μM of palmitate treatment showed a significant decrease in Huh7
172
cells after transfection with siRNA against PGC1α
(0.51-fold vs. control after 12 h of treatment, 0.46-fold
vs. control after 24 h of treatment) (Figure 4C, 4D).
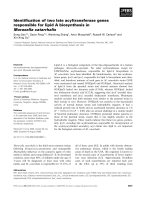
Figure 1. Changes in mRNA expression of PGC1α after palmitate treatment. A. The mRNA of PGC1α showed incubation time-related changes following 500 μM of palmitate
treatment, and maximum expression (15.7-fold change vs. control) was observed with 12 h of treatment. B. The mRNA of PGC1α showed dose-related changes (100 to
1000 μM), and maximum expression (12.5-fold change vs. control) was observed at a dose of 500 μM after 12 h of palmitate treatment. Data are expressed as mean ± standard
deviation. Four independent experiments were performed to generate the results. PA, palmitate
Figure 2. Changes in mRNA expression of PGC1α after oleate treatment. A. There were no significant changes in PGC1α following 500 μM of oleate treatment B. PGC1α
showed no significant changes following 12 h of treatment with different doses of oleate, ranging from 100 to 1000 μM. Data are expressed as mean ± standard deviation. Four
independent experiments were performed to generate the results. OA, oleate
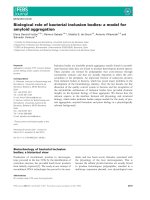
Figure 3 Changes in mRNA expression of PPARγ after FFA treatment. A. Time-related changes of mRNA expression of PPARγ were examined after incubation with 500 μM
palmitate, and maximum increase (3.92-fold change vs. control) was seen after 24 h of treatment. PA, palmitate. B. The mRNA expression of PPARγ did not show any significant
changes after treatment with 500 μM of oleate, over incubation times ranging from 3 to 24 h. OA, oleate. Data are expressed as mean ± standard deviation. Four independent
experiments were performed to generate the results.
Int. J. Med. Sci. 2016, Vol. 13
173
Figure 4. Regulation of mRNA expression of PPARγ by PGC1α. A. The mRNA expression of PGC1α after 12 h of treatment with 500 μM palmitate showed a significant
decrease in Huh7 cells transfected with siRNA against PGC1α (0.17-fold vs. control transfected with scRNA). B. The mRNA expression of PGC1α after 24 h of treatment with
500 μM palmitate showed a significant decrease in Huh7 cells transfected with siRNA against PGC1α (0.23-fold vs. control transfected with scRNA). C. The mRNA expression
of PPARγ after 12 h of treatment with 500 μM palmitate showed a significant decrease in Huh7 cells after transfection with siRNA against PGC1α (0.51-fold vs. control
transfected with scRNA). D. The mRNA expression of PPARγ after 24 h of treatment with 500 μM palmitate showed a significant decrease in Huh7 cells after transfection with
siRNA against PGC1α (0.46-fold vs. control transfected with scRNA). Data are expressed as mean ± standard deviation. Six independent experiments were performed to
generate the results. PA, palmitate.
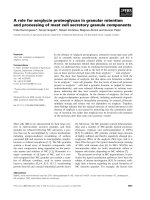
Lipid accumulation in Huh7 cells
Lipid accumulation was significantly lower in
the cells transfected with siRNA (1.34 ± 0.21) than
those transfected with scramble RNA (1.68 ± 0.25,
p=0.031, n=7) both followed by 24-h palmitate treatment (500 μM) (Figure 5A, 5B).
Protein analysis
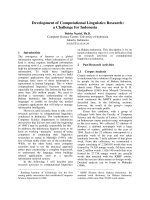
Analysis of protein extracts showed that 500 μM
of palmitate treatment induced a significant increase
in the expression of PGC1α and phospho PPARγ
(PGC1α, 1.42-fold vs. control, P=0.038; phospho
PPARγ, 1.56-fold vs. control, P=0.022) (Figure 6A, B,
C). The expression was suppressed in Huh7 cells
transfected with siRNA against PGC1α (PGC1α,
0.52-fold vs. scramble RNA as control, P=0.019;
phospho PPARγ, 0.43-fold vs. control, P=0.011) (Figure 6D, E, F). There was no significant change in the
expression of total PPARγ in the palmitate-treated
Huh7 cells.
Lipid analysis in mouse liver tissue
The study examined 16 mice: 4 control mice and
12 mice for NAFLD model (Figure 7; A control, B steatohepatitis model). Blood test showed significant
difference in total cholesterol and FFA between control (71 ± 9.9 mg/dl, 979 ± 178 μEq/L) and NAFLD
model (134 ± 31 mg/dl, 2463 ± 777μEq/L, Table 3).
Table 3. Blood test in the mice.
Total cholesterol (mg/dl)
Triglyceride (mg/dl)
Free fatty acid (μEq/L)
Control
71±9.9
48±6.4
979±178
NAFLD
134±31
270±448
2463±777
P value
0.04
0.53
0.044
The content of triglyceride and total cholesterol
in the liver is summarized in Figure 8 (A, triglyceride;
B, total cholesterol), showing significant difference
between control (n=4; triglyceride; 4.0 ± 1.4 mg/g,
total cholesterol, 2.6 ± 0.17 mg/g) and NAFLD mice
Int. J. Med. Sci. 2016, Vol. 13
(n=12; triglyceride; 21.3 ± 18 mg/g, p=0.026; total
cholesterol; 3.1 ± 0.22 mg/g, p=0.0032).
The content of palmitate was significantly higher
in the NAFLD group than in the controls (NAFLD,
14750.3 ± 5268.6 μg/g; controls, 5678.5 ± 678.6 μg/g,
p=0.01). When the NAFLD mice was divided into the
two groups according to the median value of triglyc-
174
eride content (15.2 mg/g), the content of palmitate
was significantly greater in the high-triglyceride liver
group (n=6; > 15.2 mg/g; palmitate 12325.8 ± 1758.9
μg/g) than in the low-triglyceride liver group (n=6;
<15.2 mg/g; palmitate 6245.6 ± 1182.7 μg/g, p=0.002)
(Figure 9).
Figure 5. Lipid accumulation in the cultured cell. A. Huh7 cells transfected with scramble RNA followed by 24-h palmitate treatment (500 μM). B. Huh7 cells transfected with
siRNA followed by 24-h palmitate treatment (500 μM).
Figure 6. Protein analysis. A. The 500μM of palmitate treatment induced an increase in the expression of PGC1α and phospho PPARγ. There was no expression change in the
total PPARγ in the palmitate-treated Huh7 cells. Control, untreated cells; PA, palmitate. The gels shown are representative of four independent experiments. B. The 500μM of
palmitate treatment induced a significant increase in the expression of PGC1α (1.42-fold vs. control, P=0.038). Control, untreated cells; PA, palmitate. The data in the graphs are
expressed as the ratio of the target protein to β-actin (n=4). C. The 500μM of palmitate treatment induced a significant increase in phospho PPARγ (phospho PPARγ, 1.56-fold
vs. control, P=0.022). There was no significant change in the expression of total PPARγ in the palmitate-treated Huh7 cells. Control, untreated cells; PA, palmitate; Black for
phospho PPARγ, grey for total PPARγ. The data in the graphs are expressed as the ratio of the target protein (phospho PPARγ/ total PPARγ) to total PPARγ or β-actin (n=4).
D. The protein expression in PGC1α, phospho PPARγ and total PPARγ was compared between control and cells transfected with siRNA against PGC1α, both treated with
palmitate. The expression in PGC1α and phospho PPARγ was suppressed in the Huh7 cells transfected with siRNA against PGC1α. There was no expression change in the total
PPARγ. Control, cells transfected with scRNA. The gels shown are representative of four independent experiments. E. The protein expression in PGC1α was compared
quantitatively between control and cells transfected with siRNA against PGC1α, both treated with palmitate. The expression of PGC1α was significantly suppressed in Huh7 cells
transfected with siRNA against PGC1α (PGC1α, 0.52-fold vs. control, P=0.019). Control, cells transfected with scRNA. The data in the graphs are expressed as the ratio of the
target protein to β-actin (n=4). F. The protein expression in phospho PPARγ and total PPARγ was compared quantitatively between control and cells transfected with siRNA,
both treated with palmitate. The expression of phospho PPARγ was significantly suppressed in the Huh7 cells transfected with siRNA against PGC1α (phospho PPARγ, 0.43-fold
vs. control, P=0.011). There was no significant change in the expression of total PPARγ. Control, cells transfected with scRNA; Black for phospho PPARγ, grey for total PPARγ.
The data in the graphs are expressed as the ratio of the target protein (phospho PPARγ/ total PPARγ) to total PPARγ or β-actin (n=4).
Int. J. Med. Sci. 2016, Vol. 13
175
Figure 7. Liver tissue images of mice. A. Control. B. The image shows steatosis, lobular inflammation, and ballooning, indicating a presence of steatohepatitis. The images show
typical findings of controls (n=4) and NAFLD mice (n=12).
Figure 8. A. The content of triglyceride in the liver tissue. Triglyceride showed significant difference between control (n=4; 4.0 ± 1.4 mg/g) and NAFLD mice (n=12; 21.3 ± 18
mg/g, p=0.026). B. The content of total cholesterol in the liver tissue. Total cholesterol showed significant difference between control (n=4; 2.6 ± 0.17 mg/g) and NAFLD mice
(n=12; 3.1 ± 0.22 mg/g, p=0.0032).
Figure 9. The content of palmitate in the liver tissue. The NAFLD mouse group was
divided into two groups according to the median value of triglyceride content (15.2
mg/g). The palmitate was significantly greater in the high-triglyceride liver group (n=6;
> 15.2 mg/g; palmitate 12325.8 ± 1758.9 μg/g) than in the low-triglyceride liver group
(n=6; <15.2 mg/g; palmitate 6245.6 ± 1182.7 μg/g, p=0.002).
The mRNA and protein expression of PPARγ
and PGC1α in mouse liver tissue
The mRNA expressions of both PGC1α and
PPARγ were significantly higher in the NAFLD group
than in the controls (PGC1α, 9.36-fold change vs.
control; PPARγ, 4.12-fold change vs. control). In addition, the mRNA expressions of PGC1α (11.0 ± 3.6 vs.
5.5 ± 1.9, fold to control, p=0.03) and PPARγ (4.3 ± 0.4
vs. 2.2 ± 0.2, fold to control, p=0.0001) were significantly greater in the high-triglyceride liver group
(n=6; > 15.2 mg/g) than in the low-triglyceride liver
group (n=6; <15.2 mg/g) (Figure 10A, B). There was
no significant relationship between total cholesterol
content and PPARγ/PGC1α.
The protein expressions of both PGC1α and
PPARγ were significantly higher in the NAFLD group
than in the controls (PGC1α, 1.41-fold to control,
P=0.035; PPARγ, 1.39-fold vs. control, P=0.042) (Figure 11). Similarly, the protein expressions in both
PGC1α and PPARγ were higher in the
high-triglyceride liver group (n=6; PGC1α, 1.52-fold,
p=0.03; PPARγ, 1.22-fold, p=0.05) than in the
low-triglyceride liver group (n=6), the difference in
the expression in the former was significant but that
in the latter remained marginal (Figure 11).
Discussion
Despite of the continuous effort on the research,
the mechanisms for NAFLD/NASH remain unclear
[3, 13]. The present study focused on the biological
function of FFA in the liver cell line and demonstrated
the significant effect of palmitate on the intrahepatic
triglyceride accumulation via PGC1a-PPAR pathway.
Int. J. Med. Sci. 2016, Vol. 13
The linkage of the content between palmitate and
triglyceride was also proved in the animal model. In
the various possible pathogenesis, FFA may play a
176
major role for developing NAFLD which are associated with an impaired hepatic metabolism and triglyceride accumulation in the liver [10-12, 28].
Figure 10. The mRNA expression of PGC1α and PPARγ in liver tissue. A. The NAFLD mouse group was divided into two groups according to the median value of triglyceride
content (15.2 mg/g). The mRNA expression of PGC1α was significantly greater in the high-triglyceride liver group (n=6; > 15.2 mg/g; 11.0 ± 3.6, fold to control) than in the
low-triglyceride liver group (n=6; <15.2 mg/g; 5.5 ± 1.9, fold to control, p=0.03). B. The NAFLD mouse group was divided into two groups according to the median value of
triglyceride content (15.2 mg/g). The mRNA expression of PPARγ was significantly greater in the high-triglyceride liver group (n=6; > 15.2 mg/g; 4.3 ± 0.4, fold to control) than
in the low-triglyceride liver group (n=6; <15.2 mg/g; 2.2 ± 0.2, fold to control, p=0.0001).
Figure 11. The protein expression of PGC1α and PPARγ in liver tissue. A. The protein expressions in both PGC1α and PPARγ were higher in the NAFLD mice than in the
control mice. The gels shown are representative of 6 independent experiments. B. The protein expression of PGC1α was significantly higher in the NAFLD group (n=12) than
in the controls (n=4; PGC1α, 1.41-fold to control, P=0.035). The data in the graphs are expressed as the ratio of the target protein to β-actin. C. The protein expression of both
PPARγ was significantly higher in the NAFLD group (n=12) than in the controls (n=4; PPARγ, 1.39-fold vs. control, P=0.042). The data in the graphs are expressed as the ratio
of the target protein to β-actin. D. The protein expressions in PGC1α and PPARγ were higher in the high-triglyceride liver group than in the low-triglyceride liver group in the
NAFLD mice. The gels shown are representative of 6 independent experiments. E. The protein expression of PGC1α was significantly higher in the high-triglyceride liver group
(n=6; 1.52-fold, P=0.03) than in the low-triglyceride liver group (n=6) in the NAFLD mice. The data in the graphs are expressed as the ratio of the target protein to β-actin. F.
The protein expression of PPARγ was significantly higher in the high-triglyceride liver group (n=6; 1.22-fold vs. control, P=0.05) than in the low-triglyceride liver group (n=6) in
the NAFLD mice. The data in the graphs are expressed as the ratio of the target protein to β-actin.
Int. J. Med. Sci. 2016, Vol. 13
PGC1α acts as a regulator of energy metabolism,
such as mitochondrial biogenesis and respiration,
adaptive thermogenesis, and gluconeogenesis [22, 29].
One of the major functions of PGC1α is a detoxification of reactive oxygen species which are generated
during mitochondrial respiration, resulting in the
increase of mitochondrial functions [30-32]. Exercise,
low temperatures, and fasting are physiological conditions that stimulate PGC1α expression [22]. The
present study demonstrated the additional function of
PGC1α, a potential mediator of the palmitate effect of
lipid metabolism. At this point, some studies have
focused on the FFA-related changes of PGC1α expression. One study showed that unsaturated FFA
increased the mRNA expression of PGC1α by 2- to
3-fold in human skeletal muscle cells, though saturated FFA did not affect the mRNA expression of
PGC1α [33]. Another two studies reported the palmitate-induced reduction of mRNA expression of
PGC1α; one showed that exposure of C2C12 skeletal
muscle cells to 0.75 mmol/l palmitate, but not to oleate, reduced PGC-1α mRNA levels (66%; p<0.001),
through a mechanism involving MAPK-extracellular
signal-regulated kinase (ERK) and NF-κB activation
[34]. Palmitate-induced reduction of PGC1α and β
expression by 38% (p=0.01) and 53% (p=0.006), respectively, via p38 MAPK-dependent transcriptional
pathways in C2C12 myotubes has also been reported
[35]. These data may contradict the results in our
study performed in human liver cells, suggesting a
different function of PGC1α in the liver in response to
palmitate treatment.
The present study demonstrated the increased
level of PPARγ in both cultured cell model and mice
model. Previous studies have also shown increased
mRNA expression of PPAR in the obesity-related liver, PPARγ in ob/ob mice [36], and PPARα and PPARγ
in murine models of obesity [37]. The authors of the
former study reported that lean mice expressed only
low levels of PPARγ1 and barely detectable amounts
of PPARγ2. However, obese animals showed a
marked increase of PPARγ2, with low levels of
PPARγ1. Therefore, they speculated that the peroxisome proliferator-like effects of rosiglitazone in obese
mice may be due to activation of PPARγ2. A recent
human study also reported that mRNA expression of
PPARγ was significantly higher in obese patients
(n=22, NAFLD) compared with controls. Furthermore, PPARγ expression in the liver showed positive
associations with sterol regulatory element binding
protein 1c mRNA levels, serum insulin levels, and
homeostasis model assessment-insulin resistance, and
negative correlations with total adiponectin [38].
These data strongly suggest the role of PPARγ in the
177
development of NAFLD, supporting the results in our
study.
As for the biochemical function of PPAR, the
current study stresses the effect on the fat accumulation. There are some studies focusing on this issue;
one study showed that PPARγ-deficient liver in
ob/ob mice was smaller and had a dramatically decreased triglyceride content compared with equivalent
mice
lacking
the
AlbCre
transgene
(ob/ob-PPARγ(fl/fl)AlbCre–) [39]. The mRNA levels
of the hepatic lipogenic genes, fatty acid synthase,
acetyl-CoA carboxylase, and stearoyl-CoA desaturase-1 were reduced and the levels of serum triglyceride and FFA were significantly higher in
ob/ob-PPARγ(fl/fl)AlbCre+ mice than in the control
mice. Another study reported similar findings; mice
without liver PPARγ, but with adipose tissue, developed relative fat intolerance, increased adiposity,
hyperlipidemia, and insulin resistance [40]. Therefore,
the authors concluded that liver PPARγ regulates
triglyceride homeostasis, contributing to hepatic steatosis, but protects other tissues from triglyceride
accumulation and insulin resistance.
In contrast, a previous study reported the no
significant effect of palmitate on the regulation of
PPARγ, being inconsistent with our data [41]. Although the exact reason is undetermined, it might be
explained by the difference in the experimental conditions, different cell line, different concentration of
FFA and bovine serum albumin. At the same time,
their study suggested the different influence on the
lipid accumulation between palmitate and oleate,
which were also detected in our study as the oleate
showed no effect on the PGC1α-PPARγ pathway.
Nonetheless, the dose of palmitate used in our study
may be relatively higher than the actual human environment, that is the major limitation of the study, a
substantial in vivo effect of FFA need to be validated in
the additional studies.
In summary, the current study has shown that
palmitate, but not oleate, up-regulates PPARγ via
PGC1α in Huh7 cells. Furthermore, both PGC1α and
PPARγ are up-regulated and palmitate content was
increased in the liver in the NAFLD mouse model
showing a positive relationship with triglyceride
content, suggesting a certain effect on lipid metabolism leading to intrahepatic triglyceride accumulation.
The findings may enhance a better understanding of
the pathogenesis of developing NAFLD/NASH and
indicate future therapeutic targets for the disease.
Abbreviations
NAFLD: Nonalcoholic fatty liver disease
NAFL: Nonalcoholic fatty liver
NASH: Nonalcoholic steatohepatitis
Int. J. Med. Sci. 2016, Vol. 13
tor,
FFA: Free fatty acids
PPAR: Peroxisome proliferator-activated recep-
PGC1: Peroxisome proliferator-activated receptor coactivator 1
PRC: PGC related coactivator
DMEM: Dulbecco's Modified Eagle's Medium
PCR: Polymerase chain reactions
GAPDH: Glyceraldehyde-3-phosphate dehydrogenase
178
21.
22.
23.
24.
Competing Interests
25.
The authors have declared that no competing
interest exists.
26.
References
27.
1.
2.
3.
4.
5.
6.
7.
8.
9.
10.
11.
12.
13.
14.
15.
16.
17.
18.
19.
20.
Browning JD, Szczepaniak LS, Dobbins R, Nuremberg P, Horton JD, Cohen JC,
Grundy SM, Hobbs HH. Prevalence of hepatic steatosis in an urban population in the United States: impact of ethnicity. Hepatology 2004; 40: 1387-1395.
Chalasani N, Younossi Z, Lavine JE, Diehl AM, Brunt EM, Cusi K, Charlton M,
Sanyal AJ; American Gastroenterological Association; American Association
for the Study of Liver Diseases. The diagnosis and management of
non-alcoholic fatty liver disease: practice guideline by the american gastroenterological association, American Association for the Study of Liver Diseases,
and American College of Gastroenterology. Gastroenterology 2012;
142:1592-1609.
Yki-Järvinen H. Non-alcoholic fatty liver disease as a cause and a consequence
of metabolic syndrome. Lancet Diabetes Endocrinol 2014; 2: 901-910.
Ludwig J, Viggiano TR, McGill DB, Oh BJ. Nonalcoholic steatohepatitis: Mayo
Clinic experiences with a hitherto unnamed disease. Mayo Clin Proc. 1980; 55:
434-438.
Cortez-Pinto H, de Moura MC, Day CP. Non-alcoholic steatohepatitis: from
cell biology to clinical practice. J Hepatol. 2006; 44: 197-208.
Neuschwander-Tetri BA, Caldwell SH. Nonalcoholic steatohepatitis: summary of an AASLD single topic conference. Hepatology 2003; 37: 1202-1219.
Farrell GC, Larter CZ. Nonalcoholic fatty liver disease: from steatosis to
cirrhosis. Hepatology 2006; 43 (Suppl): S99-S112.
Feldstein AE, Werneburg NW, Canbay A, Guicciardi ME, Bronk SF, Rydzewski R, Burgart LJ, Gores GJ. Free fatty acids promote hepatic lipotoxicity
by stimulating TNF-alfa expression via a lysosomal pathway. Hepatology
2004; 40: 185-194.
Carter-Kent C, Zein NN, Feldstein AE. Cytokines in the pathogenesis of fatty
liver and disease progression to steatohepatitis: implications for treatment.
Am J Gastroenterol 2008; 103: 1036-1042.
Feldstein AE. Novel insights into the pathophysiology of nonalcoholic fatty
liver disease. Semin Liver Dis 2010; 30: 391-401.
Cusi K. Role of obesity and lipotoxicity in the development of nonalcoholic
steatohepatitis: pathophysiology and clinical implications. Gastroenterology
2012; 142: 711-725.
Wree A, Broderick L, Canbay A, Hoffman HM, Feldstein AE. From NAFLD to
NASH to cirrhosis-new insights into disease mechanisms. Nat Rev Gastroenterol Hepatol 2013; 10: 627-636.
Ganz M, Szabo G. Immune and inflammatory pathways in NASH. Hepatol Int
2013; 7: S771–781.
Zhu Y, Alvares K, Huang Q, Rao MS, Reddy JK. Cloning of a new member of
the peroxisome proliferator-activated receptor gene family from mouse liver. J
Biol Chem. 1993; 268: 26817–26820.
Braissant O, Foufellie F, Scotto C, Dauca M, Wahli W. Differential expression
of peroxisome proliferator-activated receptors (PPARs): tissue distribution of
PPARα, -b and -g in the adult rat. Endocrinology 1996; 137: 354–366.
Jain S, Pulikuri S, Zhu Y, Qi C, Kanwar YS, Yeldandi AV, Rao MS, Reddy JK.
Differential expression of the peroxisome proliferator-activated receptor g
(PPAR g) and its coactivators steroid receptor coactivator-1 and PPAR-binding
protein PBP in the brown fat, urinary bladder, colon and breast of the mouse.
Am J Pathol. 1998; 153: 349-354.
Bortolini M, Wright MB, Bopst M, Balas B. Examining the safety of PPAR
onists - current trends and future prospects. Expert Opin Drug Saf. 2013; 12:
65-79.
Ahmadian M, Suh JM, Hah N, Liddle C, Atkins AR, Downes M, Evans RM.
PPARγ signaling and metabolism: the good, the bad and the future. Nat Med.
2013; 19: 557-566.
Li AC, Brown KK, Silvestre MJ, Willson TM, Palinski W, Glass CK. Peroxisome
proliferatorsactivated receptor gamma ligands inhibit development of atherosclerosis in LDL receptor-deficient mice. J Clin Invest. 2000; 106: 523–531.
Chen Z, Ishibashi S, Perrey S, Osuga J, Gotoda T, Kitamine T, Tamura Y,
Okazaki H, Yahagi N, Iizuka Y, Shionoiri F, Ohashi K, Harada K, Shimano H,
28.
29.
30.
31.
32.
33.
34.
35.
36.
37.
38.
39.
40.
41.
Nagai R, Yamada N. Troglitazone inhibits atherosclerosis in apolipoprotein
E-knockout mice: pleiotropic effects on CD36 expression and HDL. Arterioscler Thromb Vasc Biol. 2001; 21: 372–377.
Collins AR, Meehan WP, Kintscher U, Jackson S, Wakino S, Noh G, Palinski
W, Hsueh WA, Law RE. Troglitazone inhibits formation of early atherosclerotic lesions in diabetic and nondiabetic low density lipoprotein receptor-deficient mice. Arterioscler Thromb Vasc Biol. 2001; 21: 365-371.
Handschin C, Spiegelman BM. Peroxisome proliferator-activated receptor
gamma coactivator 1 coactivators, energy homeostasis, and metabolism. Endocr Rev. 2006; 27: 728-735.
Austin S, St-Pierre J. PGC1α and mitochondrial metabolism-emerging concepts and lerevance in aging and neurodegenerative disorders. J Cell Sci. 2012;
125: 4963-4971.
Fujii M, Shibazaki Y, Wakamatsu K, Honda Y, Kawauchi Y, Suzuki K, Arumugam S, Watanabe K, Ichida T, Asakura H, Yoneyama H. A murine model
for non-alcoholic steatohepatitis showing evidence of association between
diabetes and hepatocellular carcinoma. Med Mol Morphol 2013; 46: 141-152.
Folch J, Lees M, Sloane Stanley GH. A simple method for the isolation and
purification of total lipides from animal tissues. J Biol Chem. 1957; 226:
497-509.
Wei Y, Wang D, Gentile CL, Pagliassotti MJ. Reduced endoplasmic reticulum
luminal calcium links saturated fatty acid-mediated endoplasmic reticulum
stress and cell death in liver cells. Mol Cell Biochem. 2009; 331: 31-40.
Maruyama H, Takahashi M, Sekimoto T, Shimada T, Yokosuka O. Linoleate
appears to protect against palmitate-induced inflammation in Huh7 cells. Lipids Health Dis. 2014; 1: 78.
Puri P, Baillie RA, Wiest MM, Mirshahi F, Choudhury J, Cheung O, Sargeant
C, Contos MJ, Sanyal AJ. A lipidomic analysis of nonalcoholic fatty liver disease. Hepatology 2007; 46: 1081-1090.
Huss JM, Kopp RP, Kelly DP. Peroxisome Proliferator-activated Receptor
Coactivator-1α(PGC-1α) Coactivates the Cardiac-enriched Nuclear Receptors
Estrogen-related Receptor-α and γ. J Biol Chem. 2002; 277: 40265-46274.
St-Pierre J, Lin J, Krauss S, Tarr PT, Yang R, Newgard CB, Spiegelman BM.
Bioenergetic analysis of peroxisome proliferator-activated receptor gamma
coactivators 1alpha and 1beta (PGC-1alpha and PGC-1beta) in muscle cells. J
Biol Chem. 2003; 278: 26597-26603.
Valle I, Alvarez-Barrientos A, Arza E, Lamas S, Monsalve M. PGC-1alpha
regulates the mitochondrial antioxidant defense system in vascular endothelial cells. Cardiovasc Res. 2005; 66: 562-573.
St-Pierre J, Drori S, Uldry M, Silvaggi JM, Rhee J, Ja¨ger S, Handschin C, Zheng
K, Lin J, Yang W Simon DK, Bachoo R, Spiegelman BM. Suppression of reactive oxygen species and neurodegeneration by the PGC-1 transcriptional coactivators. Cell 2006; 127: 397-408.
Staiger H, Staiger K, Haas C, Weisser M, Machicao F, Haring HU. Fatty acid-induced differential regulation of the genes encoding peroxisome proliferator-activated receptor-γ coactivator-1α and -1β in human skeletal muscle cells
that have been differentiated in vitro. Diabetologia 2005; 48: 2115-2118.
Coll T, Jove M, Rodriguez-Calvo R, Eyre E, Palomer X, Sanchez RM, Merlos M,
Laguna JC, Vazquez-Carrera M. Palmitate-Mediated Downregulation of Peroxisome Proliferator–Activated Receptor-γ Coactivator 1α in Skeletal Muscle
Cells Involves MEK1/2 and Nuclear Factor-κB Activation. Diabetes 2006; 55:
2779-2787.
Crunkhorn S, Dearie F, Mantzoros C, Gami H, da Silva WS, Espinoza D,
Faucette R, Barry K, Bianco AC, Patti ME. Peroxisome Proliferator Activator
Receptor γCoactivator-1 expression is reduced in obesity. Potential pathogenic
role of saturated fatty acids and p38 mitogen-activated protein kinase activation. J Biol Chem. 2007; 282: 15439-15450.
Edvardsson U, Bergström M, Alexandersson M, Bamberg K, Ljung B, Dahllöf
B. Rosiglitazone (BRL49653), a PPAR g-selective agonist, causes peroxisome
proliferator-like liver effects in obese mice. J Lipid Res. 1999; 40: 1177-1184.
Memon RA, Tecott LH, Nonogaki K, Beigneux A, Moser AH, Grunfeld C,
Feingold KR. Up-Regulation of Peroxisome Proliferator-Activated Receptors
(PPAR-a) and PPAR-g Messenger Ribonucleic Acid Expression in the Liver in
Murine Obesity: Troglitazone Induces Expression of PPAR-g-Responsive
Adipose Tissue-Specific Genes in the Liver of Obese Diabetic Mice. Endocrinology 2000; 141: 4021-4031.
Pettinelli P, Videla LA. Up-Regulation of PPAR-γ mRNA Eexpression in the
liver of obese patients: an additional reinforcing lipogenic mechanism to
SREBP-1c induction. J Clin Endocrinol Metab. 2011; 96: 1424-1430.
Matsusue K, Haluzik M, Lambert G, Yim SH, Gavrilova O, Ward JM, Brewer B
Jr, Reitman ML, Gonzalez FJ. Liver-specific disruption of PPARgamma in leptin-deficient mice improves fatty liver but aggravates diabetic phenotypes. J
Clin Invest. 2003; 111: 737-747.
Gavrilova O, Haluzik M, Matsusue K, Cutson JJ, Johnson L, Dietz KR, Nicol
CJ, Vinson C, Gonzalez FJ, Reitman ML. Liver Peroxisome Proliferator-activated Receptor γContributes to Hepatic Steatosis, Triglyceride Clearance, and Regulation of Body Fat Mass. J Biol Chem. 2003; 278: 34268-34276.
Ricchi M, Odoardi MR, Carulli L, Anzivino C, Ballestri S, Pinetti A, Fantoni LI,
Marra F, Bertolotti M, Banni S, Lonardo A, Carulli N, Loria P. Differential effect of oleic and palmitic acid on lipid accumulation and apoptosis in cultured
hepatocytes. J Gastroenterol Hepatol. 2009; 24: 830-840.