Examination of the accuracy of the quantitative in-house kit for determining zinc concentration in seminal fluid
Bạn đang xem bản rút gọn của tài liệu. Xem và tải ngay bản đầy đủ của tài liệu tại đây (789.78 KB, 7 trang )
Life Sciences | Medicine
Doi: 10.31276/VJSTE.61(1).45-51
Examination of the accuracy of the quantitative
in-house kit for determining zinc concentration
in seminal fluid
Thi Trang Nguyen*, Thi Minh Phuong Le, Thi Huyen Trang Do, Thi Quynh Dien Tran, Ngoc Thach Pham
Hanoi Medical University
Received 10 December 2018; accepted 20 February 2019
Abstract:
Introduction
Zinc in seminal fluid originates primarily from the
prostate gland. It is pivotal for male sexual function
because it affects the quantity, quality and mobility of
sperm. Materials and methods: the semen samples were
obtained from 300 male partners of infertile couples who
attended the Department of Biomedicine and Genetics
at the Hanoi Medical University between the ages of
18 and 50 years; they were then analysed for routine
seminal parameters. They were collected and analysed
according to WHO 2010 guidelines. Seminal fluid was
centrifuged at 1,500 rpm for 10 minutes, and floating
fluid collected for zinc quantification using spectroscopy
with 5-Br-PAPS was used as a color indicator. In a pH
8.6-buffer solution, in a buffered media, zinc reacts
with specific complexing 5-Br-PAPS form a stable color
compound. The optical density is directly proportional
to the concentration of zinc in the semen. The results
yielded a linear regression model of y = 0.0666x +
1.2026 with a correlation coefficient of r=0.9956. The
calibration function was y = 0.9977x with R2=0.9995.
The repeatability was SD=0.004, and the coefficient of
variation was CV%=0.27%<5%. In terms of intermediate
precision, the standard deviation was (SD)=0.01, and the
coefficient of variation was CV%=0.64%<5%. Trueness
was tex=2.076 < tt=2.262. Specificity and sensitively were
100% at 64x dilution. Specificity and sensitivity were
100% and 99.05% respectively. A significant correlation
was discovered between the two methods, with r=0.975
and p<0.001; the average difference between the two
methods was 0.0002. Conclusion: successfully completed
the kit for determining zinc concentration in semen by the
colorimetric method.
Infertility is “a disease of the reproductive system
defined by the failure to achieve a clinical pregnancy after 12
months or more of regular unprotected sexual intercourse”
(by WHO) [1, 2]. The incidence of infertility in the world is
about 13 to 18%; the causes for men and women are similar
[3]. Recently, aside from tests involving semen analysis,
genetic testing and hormonal methods, biochemical tests
involving fructose and zinc have become more common
the diagnosis and treatment of infertility [4]. They have
therefore been established as reliable indicators of human
male fertility. Understanding the role of these indicators can
help to enable a deeper understanding of the mechanisms
that cause male infertility [5, 6].
Keywords: male infertility, seminal zinc, seminogram,
spectrophotometric method.
Classification number: 3.2
Zinc is an essential factor for the male reproductive
system. Zinc deficiency in the reproductive system causes
hypogonadism and gonadal hypofunction [7, 8]. Zinc is
crucial for maintaining normal functioning of the testes
and prostate, affecting the quantity, quality and mobility of
sperm [9, 10]. In Vietnam, tests for concentrations of zinc
in seminal plasma were used in 2013 at the Hanoi Medical
University Hospital, and these tests are increasingly popular
in clinics. The necessity of using test kits to quantify zinc
in semen is increasing. However, in Vietnam, no units nor
establishments currently produce this test. Therefore, all
tests must be imported from abroad with many intermediate
costs, often increasing the cost of the test.
Materials and method
Objects
The study subjects were semen samples of male patients
who visited for examination, counseling and testing semen at
the Genetic Counseling Center and the Urology and Urology
Clinic at Hanoi Medical University Hospital from June,
*Corresponding author: Email:
March 2019 • Vol.61 Number 1
Vietnam Journal of Science,
Technology and Engineering
45
Life Sciences | Medicine
2017 to March, 2018. The procedure for collecting semen
samples was conducted in accordance with the guidance of
the World Health Organization in 2010. Participants were
required to abstain from sex for 2 to 5 days. The semen was
deposited into a sterile vial with no spermicide and analysed
within 2 hours of sampling.
The formula used for a sample size for a descriptive
study by S.K. Luanga and Lemeshow [11] is as follows:
proportional to the concentration of zinc in the semen.
Measuring the concentration of zinc:
Materials:
Buffer A: Sodium bicarbonate (200 mmol/l), Sodium citrate
(170 mmol/l), Dimethylglyoxime (4 mmol/l), Triton-X100
(1%), 5-Br-PAPS (0.08 mmol/l).
Buffer B: Salicyaldoxime (2,9 mmol/l).
Working buffer, pH-8.6 (C):4A:1B.
In this equation Z1-α/2: confidence factor (with 95%
confidence, Z1-α/2=1.96); α=0.1 (reliability); ε=0.10; p=95%
(reference process precision), n=number of experiments
required, calculated by 21; a round of 30 was executed.
To calculate the sample size to determine sensitivity,
specificity, and equivalence the following were used:
Z1-α/2:
confidence
factor
(with
95%
confidence,
Z1-α/2=1.96).
According to Zahoor Ahmed and colleagues, in 2010,
the percentage of men with low zinc concentrations in the
azoospermia and oligospermia groups was p=25% [12]; ε
is 0.2, and n=1.962 x 0.25 x (1-0.25): (0.2 x 0.25)2=288.12,
rounded to 300.
The sample size of 300 was employed to increase
accuracy.
On the same sample of semen, zinc concentrations
were measured using two methods: one involved the IVD
kit (Zinc 5-Br-PAPS, Spinreact company, Spain), and one
involved the improvement kit. The difference between the
two kits was based on a Pearson correlation, T-test, and
Bland-Altman plot.
The selection criteria required semen samples from
male patients of reproductive ages between 18 and 50 years
without acute illness who consented to participate in the
study.
For the exclusion criteria, men with genital cancers, men
with HIV, syphilis, and gonorrhea, men suffering from acute
illness or mental illness, and men who did not consent to
enroll in the study were excluded.
Method
The principle of the method involved direct colorimetric
testing without deproteinisation of the sample. In a pH
8.6 buffer solution, zinc reacts with 5-Br-PAPS complexes
and produces stable color. The optical density is directly
46
Vietnam Journal of Science,
Technology and Engineering
Zinc standard (Merk).
Zinc color 5-Br-PAPS (Spinreac, Spain).
The procedure for zinc quantitative testing in semen:
The steps for the procedure of zinc quantitative testing in
semen are as follows:
+ Step 1: the semen sample is centrifuged at 1,500 rpm
for 10 minutes. This step is used to settle the sperm cells
down to the bottom; only the top of the semen containing
the zinc for testing is then gathered, as the sperm is not used
in the test.
+ Step 2: 200 μl of supernatant is added into 200 μl TCA
370 μmol/l, mixed thoroughly, and centrifuged at 10,000
rpm for 10 minutes. This step is used to remove the protein.
+ Step 3: 100 μl of supernatant is into 2 ml of working
buffer. This is then incubated at room temperature for 5
minutes.
+ Step 4: optical density (OD) is measured at 530 nm
wavelength and 1 cm curvature. For control, 100 μl of
distilled water is substituted for semen. The color of the
solution remained unchanged within 1 hour.
[Zn] µmol/l = (OD sample/OD blank) x C zinc standard
(µmol/l).
The sensitivity and specificity are calculated according
to the following formula:
The sensitivity (%) =
x 100%
The specificity (%) =
x 100%
Statistical analysis involved data processing
using
SPSS
software
version
20.0.
The
mean values were compared using student-t-tests. The
analysis is to be meaningful when the coefficient was
p<0.05.
Regarding ethical considerations, the research was
approved by the ethical council of Hanoi Medical
March 2019 • Vol.61 Number 1
Life Sciences | Medicine
University.
The
patient
completely
voluntarily
participated in the study. All of the information from
the database was kept under strict confidentiality.
No names were recorded.
Results
Construction of linear regression equations and
calibration function
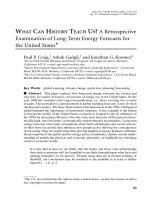
Linear regression equations were used to assess whether
the color intensity of the mixture is proportional to the
concentration of zinc in the seminal plasma. The linear
regression equation was used to calculate zinc concentrations
in seminal plasma based on measured photometer densities.
Fig. 1. Linear regression equations.
The regression equation of y = 0.0666x + 1.2026 was
used, the correlation coefficient of r=0.9956 was employed
(Fig. 1).
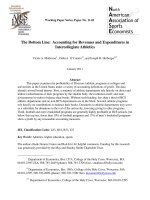
The calibration function is constructed with the standard
zinc concentration threshold of 0; 0.5; 1; 1.5; 2 g/l the OD
density was measured corresponding to each standard
zinc concentration threshold based on the completed test
procedure and the calibration curve was established as in
Fig. 2.
The calculation function equation is y = 0.9977x;
R2=0.9995.
Determining the accuracy of the kit (Table 1)
Fig. 2. Calibration curve.
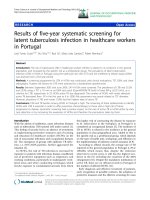
Table 1. Repeatability, intermediate precision and trueness of the in-house kit.
Measurement
Zinc
standard
concentration
(mmol/l)
Repeatability
OD
Intermediate precision
Trueness
The zinc
concentration
measured
(mmol/l)
Zinc concentrations measured by different
technicians (mmol/l)
Technicians 1
Technicians 2 Technicians 3
OD
The zinc
concentration
measured
(mmol/l)
1
1.53
1.352
1.527
1.559
1.523
1.530
1.332
1.521
2
1.53
1.354
1.529
1.524
1.527
1.524
1.335
1.524
3
1.53
1.358
1.533
1.504
1.524
1.534
1.333
1.522
4
1.53
1.352
1.527
1.532
1.525
1.526
1.334
1.523
5
1.53
1.36
1.536
1.513
1.532
1.534
1.340
1.530
6
1.53
1.362
1.538
1.537
1.533
1.524
1.341
1.531
7
1.53
1.356
1.531
1.527
1.536
1.534
1.343
1.533
8
1.53
1.351
1.525
1.514
1.530
1.529
1.338
1.528
9
1.53
1.353
1.528
1.520
1.536
1.532
1.343
1.533
10
1.53
1.356
1.531
1.544
1.528
1.536
1.336
1.525
SD
0.004
0.01
CV%
0.27
0.64
March 2019 • Vol.61 Number 1
Tex=2.076
Vietnam Journal of Science,
Technology and Engineering
47
Life Sciences | Medicine
Repeatability: based on the results in the Table 1, a
standard deviation (SD) of =0.004 and a coefficient of
variation of CV%=0.27 were calculated. The variation
coefficient of the in-house kit is within the allowable limits
(CV%<5%).
Comment:
• True negative: below normal zinc concentrations when
tested by both kits.
• False negative: below normal zinc concentrations when
Regarding the intermediate precision, based on the
results obtained from the table above, standard deviation of
(SD)=0.01 was obtained, so that the coefficient of variation
was CV%=0.64%. The coefficient of variation lies within
the CV%<5% limit.
tested by the in-house kit above normal zinc concentrations when
Based on the above results, tex=2.076 was calculated.
In addition, since tt=2.262, texachieved.
• False positive: normal zinc concentrations when tested
Sensitivity and specificity (Tables 2, 3)
Table 2. Statistics of zinc quantitative results in three groups of
patients.
The in - house
kit
Zinc concentration
Commerial
kit
Group 1 (Control group)
Below normal concentration
43
43
Normal
57
57
Group 2 (Group with some abnormal
seminal indexes)
tested by the commercial kit.
• True positive: normal zinc concentrations when tested
with both kits.
by the in-house kit; below normal zinc concentrations when
tested by the commercial kit.
Sensitivity and specificity were calculated according to the
following formula:
The sensitivity (%) =
x 100%
The specificity (%) =
x 100%
The sensitivity of the in-house kit is 99.05%, and the
specificity of the self-mixing kit is 100%.
Assessing the capability of detecting the concentration of
zinc between the in-house kit and the commercial standard
Below normal concentration
40
38
Normal
60
62
Below normal concentration
73
73
Normal
27
27
kit (Fig. 3)
Group 3 (Azoospermia group)
Table 3. Index of indicators to calculate sensitivity and
specificity.
True
positive
False positive
True
negative
False
negative
Group 1
57
0
43
0
Group 2
60
0
38
2
Group 3
27
0
73
0
Total
208
0
90
2
Sensitivity
99.05%
Specificity
100%
48
Vietnam Journal of Science,
Technology and Engineering
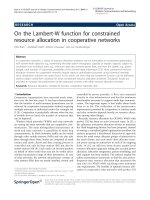
Fig. 3. Bland-Altman diagram assessing the capability of
detecting zinc concentrations between the in-house kit and the
commercial standard kit.
March 2019 • Vol.61 Number 1
Life Sciences | Medicine
- Use semen samples of 300 patients. Each sample
quantifies 2 times: using a commercial standard kit and inhouse kit (the list of 300 patients tested is included in the
appendix).
- The Pearson test results demonstrate a strong correlation
between the concentrations of zinc measured by the two kits,
with r=0.975 (0.983-0.995), p<0.001.
The in-house kit tends to yield higher results than the
commercial standard kit. The difference between the two
methods of detection is random (the value points are dispersed
and follow no pattern), and the error deviation is not related to
the zinc quantification results.
The mean difference between the two methods was
minimal, or (0.0002) close to 0, with a standard deviation of
4.94%. Most cases were within ±1.96 standard deviations.
Discussion
Concentrations of zinc in semen can be detected using
the method involving 5-Br-PAPS. At suitable pH levels,
zinc reacts with 5-Br-PAPS, creating a chelate with stable
colors. The darkness of the mixture’s color is proportional to
the quantity of zinc in semen. Concentrations of zinc can be
measured by the optical density of this mixture.
The researchers proceeded to measure the optical density
two times in the sequence 1.0; 1.5; 2.0; 2.5; 3.0; 3.5; 4.0
mmol/l, obtaining the average. Ms-Exel was used to draw the
linear line.
The linear regression equation is y = 0.0666x + 1.2026,
zinc concentration is indicated by the independent variables,
x, and optical density is the dependent variable, y.
The correlation coefficient of r=0.9956, and 0.995
concentrations and optical density.
• About construction of calibration function
When mixing chemicals, due to subjective or objective
reasons, error factors may yield different results between the
two tests. In this kit, to minimise these factors and to ensure
result stability between the tests, each time chemicals were
mixed, the researchers proceeded to build the calibration
function.
The calibration function was y = 0.9977x, and the
correlation relation coefficient was R2=0.9995. Such as
computational, quantitative results when using chemical
batch after need with coefficient 1, meaning that no additional
coefficients. No significant difference in the test results is
apparent between the different batches of chemical tests.
The calibration function equation was y = 0.9977x, and
the correlation coefficient was R2=0.9995.
• Accuracy
In trials, particularly in quantitative testing, numerous
error factors affect the test, producing inaccurate results.
Therefore, to control these confounding factors, it is necessary
to apply precision. Precision results only depend upon the
random error factor that is not related to the actual results of
the sample. When the precision of the standard deviation is
lower, the variance is greater.
Precision is based on three parameters, including
repeatability, intermediate precision, and reproducibility. This
study only involved experiments that calculated repeatability
and intermediate precision; since there is no reference
laboratory, it is not possible to calculate the reproducibility.
In this study, the in-house kit has a repeatability with a
CV% coefficient of 0.27%, so that the coefficient of variation
does not exceed 5%, which indicates that it satisfies the
requirements of the analysis.
The calculation of the intermediate yielded, the coefficient
of variation of CV%=0.64%. This coefficient of variation is
also valid for not more than 5%. Therefore, the process also
meets the requirements of the analysis.
Therefore, when the effect of random error elements is the
same, the concentration measured under different conditions
has a tolerable range.
• About the trueness
The trueness of the method demonstrates that the degree
of proximity between the result obtained and the actual value
or accepted value is true (μ).
By experimentally testing the trueness, the result obtained
is tex=2.076. Additionally, the table indicates that, the tt value
obtained is 2.262. This means that tex
March 2019 • Vol.61 Number 1
Vietnam Journal of Science,
Technology and Engineering
49
Life Sciences | Medicine
the actual concentration of the sample. The process achieves
the required accuracy of an analysis.
their kit can soon be the subject of quantity production,
replacing currently imported kits in health institutions.
A good test kit should have high sensitivity and specificity,
which means that the kit has low false positives and false
negatives. These are two important criteria for evaluating the
quality of an analysis kit.
However, this study has, only tested the kit on a laboratory
scale. Assessment on an industrial scale is fundamental for
the kit to become subject to quantity production.
The kit achieves a specificity of 100% and a sensitivity of
100% as well. It is therefore possible to use this kit to quantify
zinc in semen with high reliability.
To reassert the accuracy of the in-house kit, this study
continued to compare the results obtained by the kit with
those of the standard kit.
Results demonstrated significant correlations between the
two kits (r=0.975; p<0.001) and that, the mean difference
between the two methods was 0.0002, equivalent to 4.94%.
This difference was not statistically significant.
The chart illustrates that the difference is completely
random and independent from the standard scale.
In the kit, proteins were transformed using TCA 370
mmol/l. TCA is a non-poisonous, common, and easy to
purchase acid. Transforming proteins before mixing them
with color indicators limits the possibility of proteins reacting
to the color indicator and produces a mixture of inaccurate
color. In this manner, the accuracy of obtained results is
considerably improved.
Moreover, the in house test kit uses only simple, low-cost,
common, and easy-to-buy chemicals and fewer, chemicals
than commercial kits. The IVD kit used in this study is the
Zinc 5-Br-PAPS Test (Spain), which is being used widely
to measure zinc in semen in laboratories today. This kit also
follows the principle of the colorimetric method, but indol
is used as an expensive chemical that is difficult to purchase
in Vietnam and requires the use of a color-rendering stopper.
In addition, the kit must be imported from abroad, through
many intermediate stages, resulting in a high cost of testing
This means that this kit is more suitable for use in Vietnam,
where determination of zinc concentration in seminal fluid is
in high demand; however, the average annual income remains
only average.
With the achieved advancements, the researchers hope
50
Vietnam Journal of Science,
Technology and Engineering
Conclusions
Successfully complete the procedure to create the zinc
quatification kit using the colorimetric method.
Calibration function: y = 0.9977x; correlation coefficients
R2=0.9995.
• Accuracy
- Repeatability: SD=0.004, coefficient of variation
CV%=0.27%<5%.
- Intermediate precision: SD=0.01, coefficient of variation
CV%=0.64%<5%.
• Trueness: ttn=2.076 < tc=2.262.
- The sensitivity of the self-mixing kit is 99.05%, and its
specificity is 100%.
- The results indicate a strong correlation between the two
methods (r=0.975; p<0.001); the average difference between
the two kits is 0.0002, equivalent to 4.94%. The diference
has no statistical significance. Most cases yielded zinc
concentration data within ±1.96 standard deviations.
ACKNOWLEDGEMENTS
The authors would like to take this opportunity to extend
our sincere thanks to Ministry of Health for providing
financials support for the study. We also are grateful for the
technical support of the Hanoi Medical University Hospital
for the assay of the seminal zinc concentration.
The authors declare that there is no conflict of interest
regarding the publication of this article.
REFERENCES
[1] WHO (2010), WHO Laboratory manual for the Examination
and processing of human semen, 5th edn., Geneva: WHO Press.
[2] R.S. Swerdloff, C. Wang (2004), The testis and
male sexual function, 22nd ed. Goldman L, Ausiello
D, editors, Cecil Textbook of Medicine, Philadelphia
(PA): Saunders Publisher, pp.1472-1483.
March 2019 • Vol.61 Number 1
Life Sciences | Medicine
[3] H. Doshi, O. Heana, T.
levels in seminal plasma and
seminal
characteristics”,
Journal
Gynecology of India, 58, pp.152-155.
Hemali (2008), “Zinc
its relationship with
of
Obstetrics
and
andrological, immunological and obstetric outcome”, Eur. J.
Obstet. Gynecol. Reprod. Biol., 79(2), pp.179-184.
[9] S. Biswas, K.M. Ferguson, J. Stedronska, et al. (1978),
[4] A. Agarwal, F.M. Bragais, E. Sabanegh (2008), “Assessing
sperm function”, Urol. Clin. North Am., 35(2), pp.157-171.
[5] T.G. Cooper (2010), WHO laboratory manual for the
Examination and processing of human semen, 5th edn., Bern: WHO
Press, pp.1-157.
[6] D.I. Lewis Jones, I.A. Aird, M.M. Biljan, et al. (1996), “Effects
of sperm activity on zinc and fructose concentrations in seminal
plasma”, Human Reproduction, 11(11), pp.2465-2467.
[7] H.H. Sandstead, A.S. Prasad, A.R. Schulert, et al. (1967),
“Human zinc defciency, endocrine manifestations and response to
treatment”, Am. J. Clin. Nutr., 20(5), pp.422-442.
[8] A.E. Omu, H. Dashti, S. Al-Othman (1998),
“Treatment
of
asthenozoospermic
with
zinc
sulphate:
“Fructose and hormone levels in semen: their correlations with sperm
counts and motility”, Fertil. Steril., 2(30), pp.200-204.
[10]
B.O.M.
Saleh,
N.K.
Hussain,
A.Y.
Majid,
et
al. (2008), “Status of zinc and copper concentrations in
seminal
plasma
of
male
infertility
and
their
correlation
with various sperm parameters”, The Iraqi Postgraduate Medical
Journal, 7(1), pp.76-80.
[11] S.K. Luanga, Lemeshow (1991), Sample size determination
in health studies - a practical manual, 88pp.
[12] Zahoor Ahmed, et al. (2010), “Seminal fructose in various
classes of infertile patients”, Pak. J. Physiol., 6(1), pp.36-38.
March 2019 • Vol.61 Number 1
Vietnam Journal of Science,
Technology and Engineering
51