Prognostic utility of soluble suppression of tumorigenicity 2 level as a predictor of clinical outcomes in incident hemodialysis patients
Bạn đang xem bản rút gọn của tài liệu. Xem và tải ngay bản đầy đủ của tài liệu tại đây (696.94 KB, 8 trang )
Int. J. Med. Sci. 2018, Vol. 15
Ivyspring
International Publisher
730
International Journal of Medical Sciences
Research Paper
2018; 15(7): 730- 737. doi: 10.7150/ijms.23638
Prognostic Utility of Soluble Suppression of
Tumorigenicity 2 level as a Predictor of Clinical
Outcomes in Incident Hemodialysis Patients
Suk Min Seo,1 Sun Hwa Kim, 1 Yaeni Kim, 2 Hye Eun Yoon,2 Seok Joon Shin2
1.
2.
Cardiovascular Center and Cardiology Division, Department of Internal Medicine, Seoul St. Mary’s Hospital, The Catholic University of Korea, Seoul, Korea
Nephrology Division, Department of Internal Medicine, Incheon St. Mary’s Hospital, The Catholic University of Korea, Incheon, Korea
Corresponding author: Seok Joon Shin, MD, PhD, Nephrology Division, Department of Internal Medicine, Incheon St. Mary’s Hospital, The Catholic
University of Korea, 56 Dongsu-ro, Bupyeong-gu, Incheon 21431, Korea. Tel: +82.32-280-5091; Fax: +82.32-280-5987; E-mail:
© Ivyspring International Publisher. This is an open access article distributed under the terms of the Creative Commons Attribution (CC BY-NC) license
( See for full terms and conditions.
Received: 2017.11.02; Accepted: 2018.04.12; Published: 2018.05.14
Abstract
Background: The suppression of tumorigenicity 2 (ST2) is associated with cardiac remodeling and tissue
fibrosis. It is well known as a novel biomarker on predictor of cardiovascular events in patients with heart
failure. In patients needed to start dialysis treatment, most of them had congestive heart failure.
However, the prognostic implications of serum ST2 level are unknown in incident hemodialysis patients.
Methods: A total 182 patients undergoing incident hemodialysis were consecutively enrolled from
November 2011 to December 2014. These patients were classified into two groups according to their
median ST2 levels. The two groups were subsequently compared with respect to their major adverse
cerebro-cardiovascular events (MACCE) including all-cause mortality, heart failure admission, acute
coronary syndrome, and nonfatal stroke.
Results: The median duration of follow up was 628 days (interquartile range 382 to 1,052 days). ST2 was
significant correlated with variable echocardiographic parameters. The parameters of diastolic function,
deceleration time of the early filing velocity and maximal tricuspid regurgitation velocity were
independently associated with the ST2 levels. High ST2 group had significantly higher incidence of
all-cause mortality, and MACCE. High ST2 was a significant independent predictor of MACCE (adjusted
hazard ratio 2.33, 95% confidence interval 1.12 to 4.87, p=0.024).
Conclusion: The ST2 is associated with diastolic function and may be a predictor of clinical outcomes in
incident hemodialysis patients.
Key words: suppression of tumorigenicity 2; heat failure; incident hemodialysis
Introduction
Chronic renal failure can lead to cardiovascular
changes such as atherosclerosis and cardiac structural
and functional abnormalities caused by the kidney
disease itself and by dialysis treatment. About 20% of
dialysis patients have systolic dysfunction (1).
However, diastolic dysfunction is more frequent and
may be associated with poorer prognosis than systolic
dysfunction (2). Even most patients who begin
dialysis treatment already have heart failure (3).
Although there have been tremendous
improvements in the quality and utility of dialysis in
recent years, death from cardiovascular events is still
the biggest problem of dialysis (4). Therefore, it is
very important to predict the occurrence of
cardiovascular disease in chronic dialysis patients,
and many studies have been conducted on whether
various biomarkers can play such roles.
The suppression of tumorigenicity 2 (ST2) is
expressed as a response to myocardial stress and
injury and is known as a member of the interleukin-1
receptor family (5). It can be regarded as a marker of
fibrosis, remodeling, and inflammation. ST2 is well
known as a new biomarker to predict cardiovascular
events in patients with heart failure. (6~8). There are
Int. J. Med. Sci. 2018, Vol. 15
still few studies on the clinical usefulness of ST2 in
dialysis patients, especially those who started
hemodialysis for the first time, and few studies have
investigated the association of ST2 levels with cardiac
function and prognosis in these patients.
Our objective was to analyze the relationship
between the ST2 level and echocardiographic
parameter of cardiac function, and the prognostic
value of ST2 in incident hemodialysis patients.
Methods
Study population
This study consisted of 182 consecutive patients
who started hemodialysis treatment for the first time
in Incheon St. Mary’s Hospital between November
2011 and December 2014. Patients who provided
informed consent to enroll the study and blood bank.
No industries were involved in the design or
performance of the study or the analysis of its results.
The study protocol was reviewed and approved by
the appropriate institutional review board.
Echocardiographic data
We could analyze the echocardiographic data of
172 patients. Transthoracic echocardiography was
performed before the first hemodialysis or as early as
possible after first hemodialysis and stabilization of
patients. Two-dimensionally directed left ventricular
(LV) M-mode dimensions were acquired from the
parasternal long axis and carefully obtained
perpendicular to the LV long axis and measured at the
level of the mitral valve leaflet tips at end-diastole
following the recommendations of the American
Society of Echocardiography (9). LV end-systolic
volume and LV ejection fraction (LVEF) were
calculated using modified Simpson's method.
Diastolic function was assessed by 2D and Doppler
methods (10). Peak early diastolic flow velocity (E), its
deceleration time (DT), peak late diastolic flow
velocity (A), and a ratio of E wave, and A wave (E/A
ratio) were assessed form the mitral valve inflow
velocity curve using pulsed wave Doppler at the tips
of the mitral valve leaflet. Septal mitral annular early
peak velocity (e´) was obtained from tissue Doppler
imaging of the mitral annulus. A ratio of peak early
diastolic flow velocity to septal mitral annular
velocity (E/e´ ratio), an estimate of LV filling
pressure, was calculated. The maximal tricuspid
regurgitation (TR) velocity (TR Vmax) was acquired
from apical four-chamber view with color flow
imaging to obtain highest Doppler velocity aligned
with continuous wave. Left atrial (LA) volume was
measured by the biplane area length method using
the disk summation algorithm similar to that used to
measure LV volume (11).
731
Measurement of biomarkers
The blood sample was stored by venipuncture
prior to the first hemodialysis in EDTA-containing
tubes. After centrifugation, plasma samples were
stored at -80 ℃ in a refrigerator. Serum Galectin-3
levels were measured by an optimized enzyme-linked
immunosorbent assay (ELISA) using a Human Gal-3
Quantikine Kit (R&D Systems, Inc., Minneapolis,
Minnesota, USA). ST2 serum concentrations were
measured by ELISA using Presage® ST2 (Critical
Diagnostics, San Diego, CA, USA). Serum Galectin-3
and ST2 levels were measured by fiduciary institutions that professionally analyzes clinical specimens.
Study definition and clinical analysis
The primary study end point was major adverse
cerebro-cardiovascular events (MACCE) including
all-cause mortality, hospitalization for heart failure,
acute coronary syndrome (ACS), and nonfatal stroke.
All-cause mortality was considered to be cardiac
death after the exclusion of non-cardiac causes. ACS
was defined unstable angina or acute myocardial
infarction. Stroke, which was signified by the
presence of neurologic deficits, was confirmed by a
neurologist who evaluated the imaging studies of
affected patients. Patient follow-up data, including
censored survival data, were collected through July
31, 2015 via hospital chart, telephone interviews with
patients by trained reviewers who were blinded to the
study result, and reviews of the database of the
National Health Insurance Corporation, Korea, using
a unique personal identification number.
Statistical analysis
Continuous variables are expressed as mean ±
standard deviation and are compared using Student’s
t-test or the Mann-Whitney U-test. Discrete variables
are expressed as percentages and compared using the
χ2-test or Fisher’s exact test. Receiver operating
characteristic (ROC) curve analyses were performed
to identify the optimal cut-off value of biomarkers
with the highest sensitivity and specificity associated
with occurrence of events. Pearson’s univariate
correlation analysis for continuous variables or
Spearman rank correlation analysis for discrete
variables were carried out to analyze the association
between the ST2 and variables. To determine
variables independently associated with ST2, a
stepwise multiple linear regression analysis using
inclusion and exclusion criteria of 0.05 and 0.10,
respectively, was performed. A multivariable Cox
regression analysis (after confirming the appropriateness of the proportional hazards assumption) was
carried out to identify independent predictors for
cardiovascular events. Univariate Cox regression
Int. J. Med. Sci. 2018, Vol. 15
analysis was carried out with conventional risk factors
and variables with a statistical p value less than < 0.05
in the baseline characteristics (Table 1.) Then,
variables with a significant association (p < 0.05) in
the univariate analysis and conventional risk factors
were evaluated in the multivariable Cox regression
model. The effect of each variable in developing
models was assessed using the Wald test and
described as hazard ratios (HRs) with 95 % confidence
intervals (CIs). The cumulative survival was
estimated using the Kaplan–Meier survival curves
and compared using the log-rank tests. All statistical
analyses were two-tailed, with clinical significance
defined as values of p less than 0.05. Statistical
analysis was carried out using Statistical Analysis
Software package (SAS version 9.1, SAS Institute,
Cary, North Carolina).
Results
Characteristics of the study populations
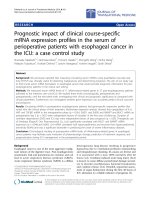
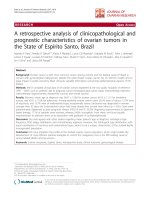
The study flow chart was briefly presented in
figure 1. Serum Gal-3 levels ranged from 21 to 280
ng/ml. The mean serum ST2 level was 80.7±59.2
ng/ml, and the median serum ST2 level was 59.5
ng/ml (interquartile range (IQR) 40-102.5). All the
patients enrolled herein were divided into the
following two groups according to their median ST2
levels: a high ST2 group (n=91) and a low ST2 group
(n=91).
Baseline characteristics between the two groups
are shown in table 1. High ST2 group were older and
had more reduced kidney function. These patients
with high ST2 were more likely to have higher high
sensitivity C-reactive protein (hs-CRP), creatine
kinase-MB fraction (CK-MB), galectin-3, and B-type
natriuretic peptide (BNP) and lower albumin level.
Echocardiographic data was obtained in 172 patients.
Patients with high ST2 had a worse diastolic function
than those with low ST2 and no significant difference
in systolic function compared to those with low ST2.
Figure 1. The study flow chart. f/u=follow up, HD=hemodialysis;
IQ=interquartile; ST2=suppression of tumorigenicity 2
732
Table 1. Baseline patient demographic,
echocardiographic data according to ST2
Variables
Demographics
Age, year
Age ≥65 yrs
Male gender
Risk factors
BMI (kg/m2)
Diabetes mellitus
Hypertension
Current smoking
Prior history of stroke
Prior history of MI
Prior history of PCI
Discharge medication
Aspirin
Statin
Beta-blocker
ACEI or ARB
CCB
Laboratory data
Hemoglobin, g/dl
HbA1c (%)
BUN, mg/dl
Creatinine, mg/dl
eGFR, mL/min/1.73 m2
Albumin, g/dl
Uric acid, mg/dl
Total cholesterol, mg/dl
Triglycerides, mg/dl
HDL cholesterol, mg/dl
LDL cholesterol, mg/dl
Hs-CRP, mg/l
CK-MB, ng/ml
Troponin-t, ng/ml
BNP, pg/ml
Galectin-3, ng/ml
ST2, ng/ml
Echocardiographic data
Diastolic function parameters
E/A ratio
Median e’ (m/s)
Median E/e’
Deceleration time (msec)
TR Vmax (m/s)
LAVI (ml/m2)
Systolic function parameters
LVMI (g/m2)
LVEF (%)
Median s` (m/s)
LVEDVI (ml/m2)
clinical,
and
Low ST2
(n=91)
High ST2
(n=91)
p
value
61.9±13.3
41 (45.1)
51 (56.0)
60.6±15.3
39 (42.9)
55 (60.4)
0.567
0.881
0.548
23.8±3.8
46 (50.5)
77 (84.6)
21 (23.1)
8 (8.8)
0 (0)
0 (0)
23.8±4.3
56 (61.5)
70 (76.9)
20 (22.0)
13 (14.3)
2 (2.2)
3 (3.3)
0.984
0.179
0.259
1.000
0.353
0.497
0.246
27 (29.7)
38 (41.8)
39 (42.9)
31 (34.1)
42 (46.2)
35 (38.5)
34 (37.4)
38 (41.8)
39 (42.9)
52 (57.1)
0.274
0.649
1.000
0.286
0.182
9.29±1.60
6.5±1.6
75.2±25.0
6.66±2.69
8.81±3.75
3.52±0.63
8.00±2.36
170.5±59.8
157.3±92.6
40.6±15.3
108.3±43.9
11.5±42.9
2.07±3.73
43.0±104.5
427.5±673.1
20.6 ± 9.8
40.44±9.89
9.06±1.76
69.9±1.9
90.1±28.8
8.22±4.21
7.58±3.43
3.25±0.68
8.33±2.27
174.6±70.5
147.3±78.3
44.5±16.5
112.8±55.5
27.9±43.2
3.56±4.87
84.5±271.0
1141±1670
27.3±13.3
120.89±60.58
0.359
0.215
<0.001
0.003
0.022
0.005
0.331
0.684
0.459
0.145
0.584
0.012
0.022
0.175
<0.001
<0.001
<0.001
0.785±0.313
5.62±1.90
12.51±4.98
228.10±68.90
2.35±0.41
48.99±13.83
0.875±0.366
5.72±1.76
13.46±4.56
203.31±66.57
2.54±0.58
59.44±23.19
0.091
0.711
0.199
0.017
0.014
0.001
124.05±29.38
59.03±7.82
7.08±1.65
61.71±16.05
132.17±37.10
59.07±11.57
6.72±1.79
64.92±22.04
0.143
0.194
0.176
0.310
Data are presented as the mean ± standard deviation or n (%).
ACEI/ARB=angiotensin-converting enzyme inhibitor/angiotensin II receptor
blocker; BMI=body mass index; BNP=B-type natriuretic peptide; BUN=blood urea
nitrogen; CCB=calcium channel blocker; CK-MB=creatine kinase-MB fraction;
e’=pulsed-wave tissue Doppler imaging-derived septal mitral annular early peak
velocity; E/A ratio=ratio of the peak early (E) to late (A) diastolic flow velocities;
E/e' ratio=ratio of the peak early (E) diastolic flow velocities to septal mitral
annular early peak velocity (e’); eGFR=estimated glomerular filtration rate;
HbA1c=Glycated hemoglobin; HDL=high-density lipoprotein;
Hs-CRP=high-sensitivity C-reactive protein; LAVI=left atrium volume index;
LDL=low-density lipoprotein; LVEDVI=left ventricular end-diastolic volume
index; LVEF=left ventricular ejection fraction; LVMI=left ventricular mass index;
MI=myocardial infarction; PCI=percutaneous coronary intervention; s’=
pulsed-wave tissue Doppler imaging-derived mitral annular systolic velocity;
ST2=suppression of tumorigenicity 2; TR Vmax=maximal tricuspid regurgitation
velocity.
Int. J. Med. Sci. 2018, Vol. 15
733
Table 2. Level of ST2 according to presence or absence of individual echocardiographic function parameters and diastolic dysfunction
No, n (%)
E/e’ > 14
e’ (m/s) < 7
TR Vmax (m/s) > 2.8
LAVI (ml/m2) > 34
LVMI (g/m2) > 115 (men), 95 (women)
LVEF (%) < 40
Diastolic dysfunction*
117/172 (68)
37/172 (21.5)
140/172 (81.4)
16/150 (10.7)
35/150 (23.3)
161/172 (93.6)
35/150 (23.3)
ST2
Median (interquartile)
52.0(38,84)
53(38,118.5)
54.5(38.3,83.5)
42(30.5,73)
49(40,86)
58(39.5,88.5)
44(33,73)
Yes, n (%)
55/172 (32)
135/172 (78.5)
32/172 (18.6)
134/150 (89.3)
115/150 (76.7)
11/172 (6.4)
115/150 (76.7)
ST2
Median (interquartile)
72.0 (54,115)
61 (41,95)
89.5 (57.5,171.5)
59.5 (39.8,96)
59 (39,88)
124 (88,221)
62 (41,107)
p
value†
0.003
0.526
<0.001
0.069
0.522
0.007
0.033
e’=pulsed-wave tissue Doppler imaging-derived septal mitral annular early peak velocity; E/e' ratio=ratio of the peak early (E) diastolic flow velocities to septal mitral
annular early peak velocity (e’); LAVI=left atrium volume index; LVEF=left ventricular ejection fraction; LVMI=left ventricular mass index; ST2=suppression of
tumorigenicity 2; TR Vmax=maximal tricuspid regurgitation velocity.
*normal diastolic function versus intermediate or abnormal diastolic function.
The cutoff of each parameter followed the guidelines of echocardiography (9,10).
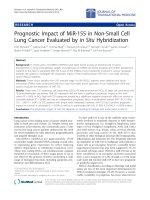
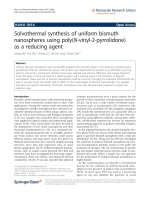
Figure 2. Receiver-operator characteristic curve of biomarkers for the prediction of MACCE. AUC=area under the curve; BNP=B-type natriuretic
peptide; CI=confidence interval; HD=hemodialysis; IQ=interquartile; SE=standard error; ST2=suppression of tumorigenicity 2
Association of ST2 with echocardiographic
functional parameters
Table 2 showed that there is a difference in
median ST2 level according to presence or absence of
echocardiographic functional abnormality. When the
function of each echocardiography was abnormal, the
median value of ST2 was higher. With the exceptions
of e’, LA volume index (LAVI), and LV mass index
(LVMI), the presence of each abnormality of
echocardiographic
function
was
significantly
associated with higher median ST2 level. A univariate
analysis showed that E/A, DT, TR Vmax, LAVI, and
LVEF were significantly correlated with ST2. In the
stepwise multiple linear regression analysis, we
included variables with p-value of < 0.05 in a
univariate analysis, DT and LAVI were significantly
correlated with ST2 level (table 3).
Table 3. Linear regression analysis of echocardiographic
predictors for sST2 level
Univariate analysis
Multivariate analysis
Echocardiographic
parameters
r
p
Beta coefficient p
Diastolic function parameters
E/A
0.159
0.040
E/e’
0.117
0.125
e’
0.036
0.642
DT(msec)
-0.210
0.006
-0.197
0.014
TR Vmax (m/s)
0.257
0.001
LAVI
0.260
0.001
0.232
0.004
Systolic function parameters
LVMI
0.015
0.853
LVEF
0.220
0.004
s’
-0.127
0.098
LVEDVI
0.110
0.174
Overall model statistics: adjusted R2=0.083; F=7.556, p=0.001
DT=deceleration time; e’=pulsed-wave tissue Doppler imaging-derived septal
mitral annular early peak velocity; E/A ratio=ratio of the peak early (E) to late (A)
diastolic flow velocities; E/e' ratio=ratio of the peak early (E) diastolic flow
velocities to septal mitral annular early peak velocity (e’); LAVI=left atrium volume
index; LVEDVI=left ventricular end-diastolic volume index; LVEF=left ventricular
ejection fraction; LVMI=left ventricular mass index; s’= pulsed-wave tissue
Doppler imaging-derived mitral annular systolic velocity; ST2=suppression of
tumorigenicity 2; TR Vmax=maximal tricuspid regurgitation velocity.
Int. J. Med. Sci. 2018, Vol. 15
734
Clinical outcomes for the study populations
The median duration of follow-up period was
628 days (IQR, 382-1052). Complete follow-up data for
MACCE were obtained in 100% of the overall cohort
for the duration of this study.
ROC curve analysis showed that the serum ST2
level with the highest sensitivity and specificity for
MACCE was 58 ng/ml (area under curve (AUC),
0.649; 95% CI 0.575~0.718; p=0.002). The AUC for
galectin-3 and BNP levels were lower than that for
ST2 (figure 2).
Table 4 shows the univariate Cox regression for
MACCE of various variables. ST2 level were all
meaningful even with continuous, binary, and
logarithmic transformational variables. In addition,
age, creatinine, hs-CRP, CK-MB, BNP, median E/e',
TR Vmax, LAVI and LVEF have significant
correlations.
admission were significantly higher in patients with
high ST2 than in those with low ST2 (Table 5). Based
on analysis of the study population, the high ST2
showed significant association with the MACCE
(unadjusted HR 2.38, 95% CI 1.23 to 4.59, p=0.01), and
multivariate analysis showed the high ST2 was
associated with MACCE (adjusted HR 2.33, 95% CI
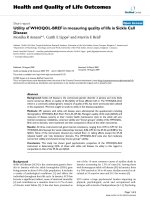
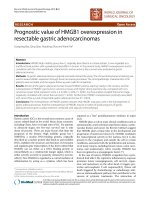
1.12 to 4.87, p=0.024) (Table 5). Restricted cubic spline
regression showed the ST2 has a positive increase in
hazard of the MACCE (figure 3).
Table 4. Predictors of the MACCE as determined by univariate
Cox regression analysis
ST2 (binary)*
ST2 (continuous)†
ST2 (log)‡
Age
Male gander
Hypertension
Diabetes
Current smoking
Hemoglobin
Creatinine
Albumin
High-sensitivity C-reactive protein
Creatine kinase-MB fraction
Troponin-T
B-type natriuretic peptide
Galectin-3
Median E/e’
Deceleration time
TR Vmax
LAVI
LVMI
LVEF
LVEDVI
Unadjusted HR
(95% CI)
2.378(1.231~4.593)
1.008(1.004~1.013)
2.356(1.468~3.783)
1.046(1.021~1.072)
0.591(0.320~1.093)
0.899(0.429~1.885)
1.172(0.625~2.195)
0.593(0.263~1.342)
1.161(0.975~1.384)
0.871(0.773~0.982)
0.757(0.481~1.192)
1.005(1.001-1.010)
1.078(1.001~1.161)
1.000(0.999~1.001)
1.000(1.000~1.001)
1.015(0.991~1.039)
1.085(1.025~1.148)
1.000(0.995-~1.005)
2.555(1.385~4.716)
1.022(1.006~1.039)
1.003(0.993~1.013)
0.961(0.938~0.983)
1.004(0.986~1.022)
p value
0.010
<0.001
<0.001
<0.001
0.094
0.778
0.621
0.210
0.094
0.025
0.230
0.017
0.047
0.968
0.002
0.223
0.005
0.954
0.003
0.007
0.580
0.001
0.653
E/e' ratio=ratio of the peak early (E) diastolic flow velocities to septal mitral
annular early peak velocity (e’); LAVI=left atrium volume index; LVEDVI=left
ventricular end-diastolic volume index; LVEF=left ventricular ejection fraction;
LVMI=left ventricular mass index; MI=myocardial infarction; PCI=percutaneous
coronary intervention; s’= pulsed-wave tissue Doppler imaging-derived mitral
annular systolic velocity; ST2=suppression of tumorigenicity 2; TR Vmax=maximal
tricuspid regurgitation velocity.
*ST2 as a categorical variable (low galectin-3 versus high galectin-3)
†ST-2 as a continuous variable.
‡ST2 as a logarithmic transformed variable.
In the high ST2 group, the MACCE occurred in a
total of 28 patients (30.8%), while in the low ST2
group, only 13 patients (14.3%) during long-term
follow-up. The incidence of all-cause mortality and
composite of all-cause mortality and heart failure
Figure 3. Restricted cubic spline regression model of the hazard of
the MACCE by serum ST2 level. MACCE=major adverse
cerebro-cardiovascular events; ST2=suppression of tumorigenicity 2
Because of the small study population,
multivariate Cox regression was performed in several
models (table 6). The continuous variable of ST2 level
had a significant association with MACCE in all 6
models. The binary variable divided by low and high
group had a significant association with models 1
through 5, but not model 6 with echocardiographic
parameters added.
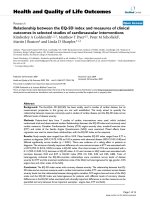
The Kaplan-Meier survival curves (figure 4)
showed that high ST2 showed significantly worse
hard outcomes than the low ST2 as determined by the
log-rank test; all-cause mortality and MACCE
(p=0.023 and p=0.008, respectively).
Discussion
This study provides evidence that initial serum
ST2 levels is significantly associated with LV diastolic
dysfunction and can be used to predict clinical
outcomes, especially all-cause mortality, in incident
hemodialysis patients. The serum ST2 levels is a
significant predictor even after major risk factors,
including baseline conventional risk factors, major
biomarkers of heart failure, and echocardiographic
parameters, have been taken into account. To our
knowledge, this study is the first data which show the
clinical impact of ST2 in incident hemodialysis
patients.
Int. J. Med. Sci. 2018, Vol. 15
735
Table 5. Comparison of clinical outcome rates in patients with low and high ST2 levels
All-cause mortality
Cardiac mortality
HF admission
Acute coronary syndrome
Nonfatal stroke
All-cause mortality + HF admission
MACCE
Low ST2 (n=91)
9 (9.9)
5 (5.5)
5 (5.5)
2 (2.2)
1 (1.1)
12 (13.2)
13 (14.3)
High ST2 (n=91)
21 (23.1)
13 (14.3)
9 (9.9)
3 (3.3)
3 (3.3)
26 (28.6)
28 (30.8)
Unadjusted HR (95% CI)
2.41 (1.10-5.26)
2.68 (0.96-7.53)
1.98 (0.66-5.91)
1.67 (0.28-10.0)
3.09 (0.32-29.7)
2.32(1.17-4.60)
2.38 (1.23-4.59)
p value
0.021
0.061
0.221
0.573
0.329
0.016
0.010
Adjusted* HR (95% CI)
2.62 (1.11-6.24)
1.05 (1.01-9.90)
p value
0.029
0.057
2.11(0.98~4.54)
2.33 (1.12-4.87)
0.055
0.024
CI=confidence interval; ST2=suppression of tumorigenicity 2; HR=hazard ratio; HF=heart failure; MACCE=major adverse cerebro-cardiovascular events.
*Adjusted covariates included age, sex, hypertension, diabetes mellitus, current smoker, hemoglobin, albumin, high-sensitivity C-reactive protein, galectin-3, and B type
natriuretic peptide
Table 6. Multivariate Cox proportional hazard models of ST2 for MACCE
Model 1 - age, gender
Model 2 – Model 1 + DM, HTN, smoking
Model 3 – Model 2 + Hb, albumin, Hs-CRP
Model 4 – Model 3 + galectin-3, BNP
Model 5 – Model 1 + DT, LAVI, LVEF
Model 6 – Model 4 + DT, LAVI, LVEF
ST2 (continuous)
Hazard ratio (95% CI)
1.008(1.004~1.013)
1.008(1.004~1.013)
1.008(1.003~1.013)
1.008(1.002~1.013)
1.007(1.002~1.012)
1.007(1.000~1.013)
p value
<0.001
<0.001
0.001
0.004
0.010
0.038
ST2 (low versus high)
Hazard ratio (95% CI)
2.663(1.375~5.156)
2.675(1.365~5.240)
2.595(1.314~5.127)
2.334(1.119~4.867)
2.347(1.034~5.331)
1.975(0.799~4.883)
p value
0.004
0.004
0.006
0.024
0.041
0.141
BNP=B-type natriuretic peptide; CI=confidence interval; DM=diabetes; DT=deceleration time; Hb=hemoglobin; HTN=hypertension; Hs-CRP=high-sensitivity C-reactive
protein; LAVI=left atrium volume index; LVEF=left ventricular ejection fraction; MACCE=major adverse cardiac and cerebral events; ST2=suppression of tumorigenicity 2
Figure 4. Kaplan-Meier Curves for (A) all-cause mortality and (B) MACCE. MACCE=major adverse cerebro-cardiovascular events.
Several studies have shown that ST2 level is a
prognostic factor in patients with acute or chronic HF
and has additional prognostic features when used
with BNP (12-15). In addition, it was confirmed that
ST2 level associated with new heart failure and
cardiovascular mortality in patients with acute
myocardial infarction (16) and cardiac reverse
remodeling in patients with heart failure (17).
Another study showed that ST2 was an independent
prognostic factor and had a better prognostic ability
than BNP in chronic hemodialysis patients (18). In
other study showing that ST2 is a predictor of
all-cause and cardiovascular mortality in maintenance
dialysis patients, ST2 showed no greater predictive
power than BNP but showed greater predictive power
when used with BNP (19).
ST2 is a member of the interleukin-1 receptor
family and is formally known as interleukin 1
receptor like 1. In rat model, ST2 was rapidly
expressed by mechanical overload to cardiac
myocytes (20). The ligand of ST2 is interleukin-33, and
interleukin-33 is involved in reducing the fibrosis or
hypertrophy of mechanically stressed tissues. Thus,
ST2 plays a role in suppressing the effects of IL-33, so
that excessive or abnormal signing of ST2 results in
myocardial hypertrophy, fibrosis, and ventricular
dysfunction (21).
Unlike BNP or galectin-3, ST2 is unique in that
it’s serum concentration has minimal effect on
impaired renal function (22,23). Galectin-3 and BNP
Int. J. Med. Sci. 2018, Vol. 15
are also major prognostic factors in patients with renal
impairment, but increased concentration of these
marker as it is partially handled and cleared by the
kidney may complicate the interpretation of the
prognosis in patients with renal dysfunction (24). In
fact, one study showed that the actual prognostic
ability decreased by adjusted with impaired renal
function (25). Thus, in patients with renal impairment,
ST2 may be more helpful in predicting prognosis, and
in this study, galectin-3 did not predict outcome
events unlike ST2.
Left ventricular hypertrophy and systolic
dysfunction, represented by LVMI and LVEF, have
been established as predictors of all-cause mortality or
cardiovascular mortality in end-stage renal disease
patients (26). Early detection of diastolic dysfunction
on echocardiography is crucial in maintenance
hemodialysis patients. This is because patients with
diastolic dysfunction have a poor prognosis than
patients with systolic dysfunction. Also, as previously
established, loss of diastolic function usually precedes
systolic dysfunction (27). In the present study, LVEF
was associated with ST2 in association with several
diastolic parameters, but it was remarkable that LAVI
and DT correlated with ST2 in multivariable analysis.
LAVI is a strong indicator of LA and LV filling
pressure (28). In general population and hemodialysis
patients, LAVI is associated with a severity of
diastolic dysfunction. LAVI is also a predictor of
mortality independent of LV geometry (29,30). The
elevation of LAVI is an independent predictor
associated with the risk of stroke (31).
Echocardiography allows accurate assessment of
cardiac function and provides prognostic information
in hemodialysis patients, but it is not readily available
in all dialysis units. Although this study was
performed with small number of patients, ST2 is
associated with echocardiographic parameters and
all-cause mortality, it is likely that ST2 can be used as
a tool for early risk stratification in patients who
initiate hemodialysis treatment.
There are some limitations to this study. First,
because this present study was nonrandomized and
observational design, it may have been influenced by
selection bias and confounding factors. Second, we
measured the serum ST2 level only once at the initial
hemodialysis time point. Therefore, it is not known
whether plasma ST2 levels fluctuate during the
follow-up period of maintenance hemodialysis. Third,
only the medications prescribed at discharge were
recorded, and any changes in medication and
non-adherence or adverse drug effect of medicine
during the follow-up period which may potentially
influence clinical outcomes were not documented.
Finally, our study is also limited as patients of single
736
center and little sample size. More researches are
needed in the large population setting.
Conclusion
The serum ST2 level is significantly associated
with diastolic function and can predict all-cause
mortality and clinical outcomes in incident
hemodialysis patients.
Competing Interests
The authors have declared that no competing
interest exists.
References
1.
2.
3.
4.
5.
6.
7.
8.
9.
10.
11.
12.
13.
14.
15.
16.
17.
18.
19.
20.
21.
22.
Pecoits-Filho R, Barberato SH. Echocardiography in chronic kidney disease:
diagnostic and prognostic implications. Nephron Clin Pract. 2010; 114: c242-7.
Ahmed A, Rich MW, Sanders PW, et al. Chronic kidney disease associated
mortality in diastolic versus systolic heart failure: a propensity matched study.
Am J Cardiol. 2007; 99: 393-8.
Avorn J, Bohn RL, Levy E, et al. Nephrologist care and mortality in patients
with chronic renal insufficiency. Arch Intern Med. 2002; 162: 2002-6.
Collins AJ, Foley RN, Herzog C, et al. Excerpts from the US Renal Data System
2009 Annual Data Report. Am J Kidney Dis. 2010; 55 (Suppl 1): S1-420.
Weinberg EO, Shimpo M, De Keulenaer GW, et al. Expression and regulation
of ST2, an interleukin-1 receptor family member, in cardiomyocytes and
myocardial infarction. Circulation. 2002; 106: 2961-6.
Rehman SU, Mueller T, Januzzi JL Jr. Characteristics of the novel interleukin
family biomarker ST2 in patients with acute heart failure. J Am Coll Cardiol.
2008; 52: 1458-65.
Manzano-Fernández S, Mueller T, Pascual-Figal D, et al. Usefulness of soluble
concentrations of interleukin family member ST2 as predictor of mortality in
patients with acutely decompensated heart failure relative to left ventricular
ejection fraction. Am J Cardiol. 2011; 107: 259-67.
Felker GM, Fiuzat M, Thompson V, et al. Soluble ST2 in ambulatory patients
with heart failure: Association with functional capacity and long-term
outcomes. Circ Heart Fail. 2013; 6: 1172-9.
Lang RM, Badano LP, Mor-Avi V, et al. Recommendations for cardiac
chamber quantification by echocardiography in adults: an update from the
American Society of Echocardiography and the European Association of
Cardiovascular Imaging. J Am Soc Echocardiogr. 2015; 28: 1-39.
Nagueh SF, Smiseth OA, Appleton CP, et al. Recommendations for the
Evaluation of Left Ventricular Diastolic Function by Echocardiography: An
Update from the American Society of Echocardiography and the European
Association of Cardiovascular Imaging. J Am Soc Echocardiogr. 2016; 29:
277-314.
Jiamsripong P, Honda T, Reuss CS, et al. Three methods for evaluation of left
atrial volume. Eur J Echocardiogr. 2008; 9: 351-5.
Rehman SU1, Mueller T, Januzzi JL Jr. Characteristics of the novel interleukin
family biomarker ST2 in patients with acute heart failure. J Am Coll Cardiol.
2008; 52: 1458-65.
Bayes-Genis A, de Antonio M, Galán A, et al. Combined use of high-sensitivity
ST2 and NTproBNP to improve the prediction of death in heart failure. Eur J
Heart Fail. 2012; 14: 32-8.
Ky B1, French B, McCloskey K, et al. High-sensitivity ST2 for prediction of
adverse outcomes in chronic heart failure. Circ Heart Fail. 2011; 4: 180-7.
Felker GM, Fiuzat M, Thompson V, et al. Soluble ST2 in ambulatory patients
with heart failure: Association with functional capacity and long-term
outcomes. Circ Heart Fail. 2013; 6: 1172-9.
Kohli P, Bonaca MP, Kakkar R, et al. Role of ST2 in non-ST-elevation acute
coronary syndrome in the MERLIN-TIMI 36 trial. Clin Chem. 2012; 58: 257-66.
Lupón J, Gaggin HK, de Antonio M, et al. Biomarker-assist score for reverse
remodeling prediction in heart failure: The ST2-R2 score. Int J Cardiol. 2015;
184: 337-43.
Obokata M, Sunaga H, Ishida H, et al. Independent and incremental
prognostic value of novel cardiac biomarkers in chronic hemodialysis patients.
Am Heart J. 2016; 179: 29-41.
Zhang Z, Shen B, Cao X, et al. Increased soluble suppression of tumorigenicity
2 level predicts all-cause and cardiovascular mortality in maintenance
hemodialysis patients: A prospective cohort study. Blood Purif. 2017;43:37-45.
Weinberg EO1, Shimpo M, De Keulenaer GW, et al. Expression and regulation
of ST2, an interleukin-1 receptor family member, in cardiomyocytes and
myocardial infarction. Circulation. 2002; 106: 2961-6.
Kakkar R1, Lee RT. The IL-33/ST2 pathway: therapeutic target and novel
biomarker. Nat Rev Drug Discov. 2008; 7: 827-40.
Lok DJA, van Der Meer P, de la Porte PWB-A, et al. Prognostic value of
galectin-3, a novel biomarker of fibrosis, in patients with chronic heart failure:
data from the DEAL-HF study. Clin Res Cardiol. 2010; 99: 323-8.
Int. J. Med. Sci. 2018, Vol. 15
737
23. Barnes ME, Miyasaka Y, Seward JB, et al. Left atrial volume in the prediction
of first ischemic stroke in an elderly cohort without atrial fibrillation. Mayo
Clin Proc. 2004; 79: 1008-14.
24. Meijers WC, van der Velde AR, Ruifrok WP, et al. Renal handling of galectin-3
in the general population, chronic heart failure, and hemodialysis. J Am Heart
Assoc. 2014; 3: e000962.
25. de Boer RA, Lok DJ, Jaarsma T, et al. Predictive value of plasma galectin-3
levels in heart failure with reduced and preserved ejection fraction. Ann Med.
2011; 43: 60-8.
26. Foley RN, Parfrey PS, Harnett JD, et al. The prognostic importance of left
ventricular geometry in uremic cardiomyopathy. J Am Soc Nephrol. 1995; 5:
2024-31.
27. Fathi R, Isbel N, Haluska B, et al. Correlates of subclinical left ventricular
dysfunction in ESRD. Am J Kidney Dis. 2003; 41: 1016-25.
28. Moya-Mur JL, Garcia-Martin A, Garcia-LIedo A, et al. Indexed left atrial
volume is a more sensitive indicator of filling pressures and left heart function
than is anteroposterior left atrial diameter. Echocardiography. 2010; 27:
1049-55.
29. Patel DA, Lavie CJ, Milani RV, et al. Left atrial volume index predictive of
mortality independent of left ventricular geometry in a large clinical cohort
with preserved ejection fraction. Mayo Clin Proc. 2011; 86: 730-7.
30. Shizuku J, Yamashita T, Ohba T, et al. Left atrial volume is an independent
predictor of all-cause mortality in chronic hemodialysis patients. Intern Med.
2012; 51: 1479-85.
31. Barnes ME1, Miyasaka Y, Seward JB, et al. Left atrial volume in the prediction
of first ischemic stroke in an elderly cohort without atrial fibrillation. Mayo
Clin Proc. 2004; 79: 1008-14.