Systematic review of metabolic syndrome biomarkers: A panel for early detection, management, and risk stratification in the West Virginian population
Bạn đang xem bản rút gọn của tài liệu. Xem và tải ngay bản đầy đủ của tài liệu tại đây (605.51 KB, 14 trang )
Int. J. Med. Sci. 2016, Vol. 13
Ivyspring
International Publisher
25
International Journal of Medical Sciences
2016; 13(1): 25-38. doi: 10.7150/ijms.13800
Review
Systematic Review of Metabolic Syndrome Biomarkers:
A Panel for Early Detection, Management, and Risk
Stratification in the West Virginian Population
Krithika Srikanthan1, Andrew Feyh1, Haresh Visweshwar1, Joseph I. Shapiro1, and Komal Sodhi2
1.
2.
Department of Internal Medicine, Joan C. Edwards School of Medicine, Marshall University, USA
Department of Surgery and Pharmacology, Joan C. Edwards School of Medicine, Marshall University, USA
Corresponding author: Komal Sodhi, M.D., Assistant Professor of Surgery and Pharmacology, Marshall University Joan C Edwards School of Medicine, WV
25701, Tel: 304 691-1704, Fax: 914 347-4956, E-mail:
© Ivyspring International Publisher. Reproduction is permitted for personal, noncommercial use, provided that the article is in whole, unmodified, and properly cited. See
for terms and conditions.
Received: 2015.09.09; Accepted: 2015.11.09; Published: 2016.01.01
Abstract
Introduction: Metabolic syndrome represents a cluster of related metabolic abnormalities, including
central obesity, hypertension, dyslipidemia, hyperglycemia, and insulin resistance, with central obesity
and insulin resistance in particular recognized as causative factors. These metabolic derangements
present significant risk factors for cardiovascular disease, which is commonly recognized as the primary
clinical outcome, although other outcomes are possible. Metabolic syndrome is a progressive condition
that encompasses a wide array of disorders with specific metabolic abnormalities presenting at different
times. These abnormalities can be detected and monitored via serum biomarkers. This review will
compile a list of promising biomarkers that are associated with metabolic syndrome and this panel can
aid in early detection and management of metabolic syndrome in high risk populations, such as in West
Virginia.
Methods: A literature review was conducted using PubMed, Science Direct, and Google Scholar to
search for markers related to metabolic syndrome. Biomarkers searched included adipokines (leptin,
adiponectin), neuropeptides (ghrelin), pro-inflammatory cytokines (IL-6, TNF-α), anti-inflammatory
cytokines (IL-10), markers of antioxidant status (OxLDL, PON-1, uric acid), and prothrombic factors
(PAI-1).
Results: According to the literature, the concentrations of pro-inflammatory cytokines (IL-6, TNF-α),
markers of pro-oxidant status (OxLDL, uric acid), and prothrombic factors (PAI-1) were elevated in
metabolic syndrome. Additionally, leptin concentrations were found to be elevated in metabolic syndrome as well, likely due to leptin resistance. In contrast, concentrations of anti-inflammatory cytokines
(IL-10), ghrelin, adiponectin, and antioxidant factors (PON-1) were decreased in metabolic syndrome,
and these decreases also correlated with specific disorders within the cluster.
Conclusion: Based on the evidence presented within the literature, the aforementioned biomarkers
correlate significantly with metabolic syndrome and could provide a minimally-invasive means for early
detection and specific treatment of these disorders. Further research is encouraged to determine the
efficacy of applying these biomarkers to diagnosis and treatment in a clinical setting.
Key words: Metabolic syndrome, literature review
Introduction
Metabolic syndrome is a cluster of metabolic
abnormalities which confers upon an individual a
substantial increase in cardiovascular disease (CVD)
risk - approximately twice as high as those without
the syndrome. Compared to those without metabolic
syndrome, those with it are at an increased risk of
mortality from CVD, coronary heart disease, stroke,
vascular dysfunction, and all-cause mortality [1].
While the pathogenesis of metabolic syndrome and its
components is not well understood, central obesity
Int. J. Med. Sci. 2016, Vol. 13
26
protein) levels, hypertension,
hyperglycemia, and sometimes
urine albumin or albumin: creatinine ratio (Table 1). Based on
AHA criteria, nearly 35% of US
adults, and 50% of those older
than 60 years old, have metabolic
syndrome [2]. Regardless of
which criteria are used, the primary concern is early detection of
potential CVD complications and
early intervention [3, 4].
Though the NCEP ATP III
report and WHO have both identified CVD as the primary clinical
outcome of metabolic syndrome,
most people with metabolic syndrome will have insulin resistance, which results in increased risk for type 2 diabetes
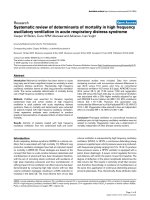
(Figure 1). Once diabetes becomes
clinically apparent, CVD risk rises
Figure 1: Interaction of adipokines, cytokines, and inflammatory markers that contribute
sharply. In addition to CVD and
to the development of metabolic syndrome and its complications. HTN-Hypertension,
type 2 diabetes, individuals with
NAFLD/NASH- Nonalcoholic fatty liver disease/nonalcoholic steatohepatitis
metabolic syndrome are seemingly more susceptible to other
and insulin resistance are recognized as causative
conditions, including polycystic ovary syndrome,
factors. Several different organizations have outlined
fatty liver, cholesterol gallstones, asthma, sleep disdiagnostic criteria for metabolic syndrome, which
turbances, and some forms of cancer, such as breast,
designates values for obesity (waist circumference or
pancreatic, colorectal, and prostate [5, 6].
BMI), triglyceride levels, HDL (High Density LipoTable 1: Diagnostic Criteria for Metabolic Syndrome
IDF (Obesity + >2)
AHA(>3)
NCEP ATP III (>3)
WHO( Insulin resistance/Diabetes + >2)
EGIR(hyperinsulinemia
+ >2)
Obesity
BMI >30kg/m2 or specific
gender and ethnicity waist
circumference cutoffs
Waist circumference for
males >40in, females>35in
Waist circumference for males Waist/hip ratio>0.9 in males
>40in, females>35in
and >0.85 in females or
BMI>30kg/m2
Waist circumference for
males >94cm, females>80cm
Elevated Triglycerides
TG>150mg/dL or treatment of Fasting TG>150mg/dL or
this lipid abnormality
treatment of this lipid abnormality
TG>150mg/dL or treatment
of this lipid abnormality
TG>150mg/dL
TG >177mg/dL
Decreased HDL HDL <40mg/dL in males and
<50mg/dL in females or
specific treatment for this lipid
abnormality
HDL<40mg/dL in males and
<50mg/dL in females or
treatment for this lipid abnormality
HDL<40mg/dL in males and
<50mg/dL in females or
treatment for this lipid abnormality
HDL<35mg/dL in males and
<39mg/dL in females
HDL< 39 mg/dL
Hypertension
SBP >130 or DBP >85 mm Hg
or treatment of previously
diagnosed hypertension
BP>130/85mm Hg or taking
medication for hypertension
SBP >130 or DBP >85 mm Hg
or taking medication for
hypertension
>140/90mm Hg
>140/90mm Hg or
taking medication for
hypertension
Hyperglycemia
Fasting plasma glucose
>100mg/dL or previously
diagnosed type 2 diabetes
Fasting glucose >100mg/dL
or taking medicine for high
glucose
Fasting glucose >100mg/dL
or taking medicine for high
glucose
Insulin resistance required
Insulin resistance required(plasma insulin
>75th percentile)
Other
Urine albumin > 20µg/min or
Albumin: creatinine ratio >
30mg/g
IDF- International Diabetes Federation, AHA- American Heart Association, NCEP ATP III- National Cholesterol Education Program-Adult Treatment Panel III, WHOWorld Health Organization, EGIR- European Group for the Study of Insulin Resistance, BMI- Body Mass Index, SBP – Systolic Blood pressure, DBP- Diastolic Blood Pressure, BP – Blood Pressure, TG- Triglycerides, HDL-High Density Lipoprotein
Int. J. Med. Sci. 2016, Vol. 13
Based on “The state of obesity: 2014 report”,
West Virginia ranks highest in the country for obesity
prevalence (35.1%) in the adult population. WV is also
highest-ranked for prevalence of hypertension (41%),
and ranked second for prevalence of diabetes (13%) in
the adult population. Given the extent of disease
burden in our state, it can be inferred that West Virginia also has one of the highest prevalences, if not the
highest, of metabolic syndrome and subsequent complications, though no epidemiological data is available through a literature search on PubMed. It is imperative to find a way to decrease these complications, and early detection is paramount to this process, yet frequently diagnosis is only possible once
complications have already begun.
Research shows that adipocytes produce bioactive substances, known as adipocytokines or adipokines. Accumulation of adipocytes leads to the
dysregulated production of adipokines, which contributes to the development of metabolic syndrome
[7]. The list of these dysregulated adipokines and cytokines is constantly growing and is a reflection of the
heterogeneity of adipose tissue due to the number of
resident cell types [8].
The mechanism by which adipose accumulation
elucidates dysregulation is not entirely clear at this
time, but some suggest that it is at least partly due to
systemic oxidative stress brought on by obesity [9].
One proposed mechanism by which obesity produces
oxidative stress is mitochondrial and peroxisomal
oxidation of fatty acids, which can generate reactive
oxygen species (ROS) in oxidation reactions.
Malondialdehyde (MDA), a lipid peroxidation end
product, is increased in conditions marked by obesity
and insulin resistance. It is able to enhance expression
of pro-inflammatory cytokines, resulting in systemic
stress [10]. In addition to MDA, F-2 isoprostanes
(F2-IsoPs) are also a product of polyunsaturated fatty
acid peroxidation. A study has shown that BMI is
significantly correlated with the F2-IsoP concentration. Another marker of oxidative stress is urinary
8-iso prostaglandin F2α (8-iso PGFα). It has been
shown to be positively correlated with obesity and
insulin resistance [11].
For many pathological states, medicine relies on
biomarkers to aid in diagnosis and management
when overt clinical signs or gross anatomic abnormalities are absent or are not obvious. In addition to
this, biomarkers can identify individuals within a
population susceptible to disease on the basis of a
“genotype” rather than on a reported history. Biomarkers also afford the ability to quantify this susceptibility, allowing for an estimation of disease risk
for a population [12].
A panel of metabolic syndrome biomarkers
27
could provide a relatively easy, minimally-invasive
means of identifying those who are at risk for developing metabolic syndrome and subsequent complications. A panel, rather than just individual biomarkers,
would be useful since biomarkers can have multiple
roles and pathways in which they are involved, so it
would be difficult to say that one biomarker alone is
sensitive and specific for the diagnosis of metabolic
syndrome. Furthermore, many of these biomarkers
are interrelated in how they play a role in metabolic
syndrome, so correlations between biomarkers would
be helpful to assess patients. With this early detection,
early intervention is also possible and could be an
effective means to diminish the widespread effects
this syndrome has on the West Virginian population,
as well as on others. A panel could also provide a
mechanism to personalize treatment given the etiology differences amongst individuals. While there are
numerous articles listing the biomarkers, both established and emerging, this review will compile a panel
of the most researched biomarkers and provide evidence of their relation to metabolic syndrome. This
panel could provide a way to diagnose, risk stratify,
monitor and potentially treat individuals at the molecular level.
Methods
A literature review was performed using PubMed, Science Direct, and Google Scholar from commencement to present and last search was done August 25, 2015. All databases were searched for the
following keywords in varying combinations: “biomarkers”, “metabolic syndrome”, “leptin”, “adiponectin”, “uric acid”, “leptin/adiponectin ratio”,
“plasminogen activator one”, “Interleukin 6 (IL-6)”,
“Interleukin 10 (IL-10)”, “ghrelin”, “tumor necrosis
factor(TNFα)”, “paraoxonase”, “oxidized LDL”,
“weight loss”, and “medications”.
Results
Leptin
Leptin is an adipokine, which under normal
physiological conditions functions to reduce appetite,
increase energy expenditure, increase sympathetic
activity, facilitate glucose utilization, and improve
insulin sensitivity [13]. It is expressed in levels proportionate to adipose mass, and though it is produced
mostly by adipocytes, it is also produced by vascular
smooth muscle cells, cardiomyocytes, and placenta in
pregnant women. The functional leptin receptor is in
the hypothalamus where it functions to increase energy expenditure and reduce appetite. The receptor is
also found in other organs such as the heart, liver,
kidneys, and pancreas; it is also present in the smooth
Int. J. Med. Sci. 2016, Vol. 13
muscle and endothelium of heart, brain vasculature,
and myometrium [14]. Given the wide range of targets for leptin based on receptor locations, the effects
of it are also widespread. Leptin has a functional receptor, Ob-Rb, in the myocardium, and studies have
shown a direct link between leptin and myocardial
structural remodeling [15]. There is controversy as to
whether leptin causes or protects from left ventricular
hypertrophy (LVH) as research has shown mixed results, though more suggest it contributes to LVH [14,
16]. Independent of conventional risk factors, studies
have shown that leptin can predict myocardial infarction [17]. Leptin also affects vascular structure by
promoting hypertension, angiogenesis, and atherosclerosis [14].
Leptin’s role as a biomarker for metabolic syndrome has been researched in different populations.
Regardless of which demographic studied, elevated
leptin levels are associated with metabolic syndrome.
This is not surprising given that elevated leptin is
associated with obesity, insulin resistance, myocardial
infarction, and congestive heart failure [14]. Yoshinaga et al found that leptin was the most sensitive
marker for predicting metabolic syndrome (and cardiovascular risk) in elementary school children [18].
Lee et al found that leptin was elevated in postmenopausal women with metabolic syndrome. They
found a positive correlation with leptin and abdominal obesity (one of the components of metabolic
syndrome), and with the number of components of
metabolic syndrome present [19]. A study of a Lebanese population, which focused on nondiabetic males
over fifty years old, also found elevated leptin levels
associated with metabolic syndrome. This study
found that leptin was strongly correlated with waist
size, but was only weakly correlated with lipid profile, which disappeared with BMI adjustment [20].
Similar findings of elevated leptin associated with
metabolic syndrome, independent of BMI, were found
in a Korean population. In this study by Yun et al,
serum leptin levels increased as the components of
metabolic syndrome increased, regardless of obese
and nonobese weight status, implying that reduction
of leptin levels may be protective, regardless of
weight loss [21]. Contrary to this, Martins et al, found
a direct positive association between leptin and obesity, hyperinsulinemia and insulin resistance, but was
only weakly related to other components of metabolic
syndrome [22]. Though there is some dissension in the
literature about whether leptin is associated with
metabolic syndrome independent of BMI, the general
consensus is that it is elevated in metabolic syndrome
in children, the elderly, females, and males, and
therefore can serve as an effective biomarker on a
screening panel.
28
Adiponectin
Adiponectin, like leptin, is an adipose-derived
plasma protein with widespread effects. However,
unlike leptin, it is secreted exclusively from adipocytes [23]. The different forms of adiponectin include
low molecular weight trimer, middle molecular
weight hexamer, and high molecular weight (HMW).
The HMW form is believed by many to be the more
active form and has the most favorable metabolic effects on insulin sensitization and protection against
diabetes [14, 23, 24]. Adiponectin has many functions,
including anti-atherogenesis, insulin sensitization,
lipid oxidation enhancement, and vasodilatation.
Therefore, it stands to reason that it is related to metabolic syndrome given its impact on all of these
components. It suppresses almost all processes involved in atherosclerotic vascular change: the expression of adhesion molecules in vascular endothelial
cells, adhesion of monocytes to endothelial cells (via
TNF-α inhibition), vascular smooth muscle cell proliferation and migration, and foam cell formation (via
oxidized LDL (OxLDL) inhibition) [25]. It has insulin-sensitizing activities, with high levels exerting a
protective effect against type 2 diabetes in diabetes-prone individuals [7] and low levels being an independent risk factor for future development of type
2 diabetes [26]. Levels of adiponectin are low in subjects with essential hypertension and in the obese, but
adiponectin levels can be increased with weight loss
[7, 27].
A study of Japanese adults by Ryo et al showed
that adiponectin levels were negatively correlated
with waist circumference, visceral fat, serum triglycerides, fasting plasma glucose, fasting plasma insulin,
and systolic and diastolic blood pressure in males and
females, and positively correlated with HDL. As the
mean number of metabolic syndrome components
increased, plasma adiponectin levels decreased. They
found that men had lower levels of adiponectin than
women, which is interesting since it may be part of the
reason why women have a lower risk of coronary
artery disease [7]. Gannage et al found adiponectin to
be inversely correlated with metabolic syndrome,
independent of BMI as other studies have also shown
in the past [20, 28]. Santaneimi et al studied a Finnish
population and found decreasing adiponectin levels
correlated with an increasing number of components
of metabolic syndrome in both sexes, and this was
once again independent of BMI [27]. Overall, the literature shows that adiponectin is inversely related to
metabolic syndrome and the number of components
present. However, many believe HMW adiponectin to
be the more active form and Falahi et al suggest that
HMW adiponectin may even be the most reliable
biomarker for metabolic syndrome diagnosis [29].
Int. J. Med. Sci. 2016, Vol. 13
Hara et al found that the ratio of HMW adiponectin to
plasma adiponectin was an even better predictor of
insulin resistance and metabolic syndrome [30].
Therefore, adiponectin, and preferably HMW adiponectin, should be considered on a panel of biomarkers for metabolic syndrome diagnosis.
Leptin: Adiponectin Ratio
Other studies have determined that the leptin:
adiponectin ratio (LAR) is more beneficial than either
alone. Falahi et al showed that a high LAR is a better
biomarker than leptin or adiponectin alone for the
diagnosis of metabolic syndrome [29]. A study of
Japanese patients found that LAR was significantly
and positively associated with the number of components of metabolic syndrome present, and the ratio
was independently associated with each component
of metabolic syndrome [31]. However there may be
differences to this between males and females. Cicero
et al found the LAR to be strongly associated with
metabolic syndrome, especially in males. The association was weaker in females since they had more elevated adiponectin levels, which is thought to be protective against metabolic syndrome [32]. Others postulate that the ratio difference between males and
females is due to the difference in glucose and lipid
metabolism [31]. One limiting factor with using just
adiponectin or leptin is that the difference between
adiponectin and leptin tends to be small in the fasting
vs postprandial state. Therefore, one of the benefits of
using the LAR is that it has the potential to assess insulin sensitivity and metabolic syndrome in the nonfasting state [33].
Ghrelin
Ghrelin is a neuroendocrine hormone secreted
primarily by the stomach that stimulates appetite directly via activation of the GH secretagogue receptor
1a (GHSR-1a) in the hypothalamus, and indirectly by
increasing expression of orexigenic peptides, such as
neuropeptide Y (NPY) [34, 35]. It may also be protective of vasculature by antagonizing the effects of vasoconstrictors, such as endothelin 1, and promoting the
effects of vasodilators, such as nitric oxide (NO) [36].
Furthermore, it can help to promote lipolysis via
stimulation of hypothalamic AMP-activated protein
kinase (AMPK) [35]. Research into the vasoprotective
and lipolytic properties of ghrelin is emerging and
presents two pathways by which ghrelin can exert a
protective effect against metabolic syndrome.
Metabolic syndrome is associated with lower
levels of ghrelin, and progressively lower ghrelin levels are associated with increasing metabolic syndrome
severity. Ghrelin levels decrease with increasing
number of metabolic syndrome derangements [37-40].
29
This trend is significant even after adjusting for age
and sex, though ghrelin levels have been shown to be
higher in females than males [37, 38]. Low ghrelin
levels have been associated with the components of
metabolic syndrome including obesity, insulin resistance, and hypertension [41-43]. However the association between low ghrelin and metabolic syndrome is likely primarily explained by the relationship to obesity as obese patients with metabolic syndrome have lower ghrelin levels than nonobese
counterparts [44]. Furthermore, amongst obese patients, ghrelin levels are lower in insulin resistant patients compared to insulin sensitive obese patients
[45]. Plasma ghrelin levels are also decreased in the
healthy offspring of type 2 diabetes patients suggesting a genetic component to ghrelin regulation [37].
Ghrelin is implicated in endothelial function by preventing proatherogenic changes and improving vasodilation [37]. Tesauro et al assessed vascular function
by measuring forearm blood flow in metabolic syndrome and control patients. They showed that exogenous ghrelin significantly reduced the vasoconstrictor effects of endothelin 1 and enhanced the vasodilator effects of NO in metabolic syndrome patients,
but did not have a significant effect on vascular tone
in control patients [36]. Given ghrelin’s relation to
each of the components of metabolic syndrome, to
metabolic syndrome itself, and the potential to note
abnormal levels in healthy individuals with genetic
predispositions, it would be an effective biomarker for
metabolic syndrome.
Plasminogen Activator Inhibitor – 1
Plasminogen Activator Inhibitor-1 (PAI-1) is the
primary of four serine peptidase inhibitors that functions to modulate extracellular matrix remodeling and
fibrinolysis. It binds to and deactivates tissue plasminogens (tissue type plasminogen activator (tPA),
urokinase plasminogen activator (uPA)). tPA is
thought to be responsible for intravascular plasminogen activation, with fibrin regulating its activity, and
uPA is responsible for plasminogen activation on migrating cells, with the uPA receptor regulating its activity on different cells. Thus, PAI-1 can inhibit intravascular fibrinolysis and cell-associated proteolysis
[46].
Under physiologic conditions, PAI-1 is secreted
into the circulation or extracellular space by endothelial cells, adipocytes, vascular smooth muscle cells,
platelets, or hepatocytes. Under pathologic conditions
however, PAI1 is induced by many pro-inflammatory
and pro-oxidant factors. For example, when TNF-α,
transforming growth factor beta (TGF-β), angiotensin
II, glucocorticoids, and insulin are elevated, adipocytes are stimulated to increase PAI-1 levels. Hypoxia
Int. J. Med. Sci. 2016, Vol. 13
and ROS also increase PAI-1 levels. Elevated levels of
PAI-1 consequently effect vasculature, inflammatory
signaling, adiposity, and insulin resistance [47].
Aberrant PAI-1 levels are associated with several
pathological diseases. For example, high levels are
positively correlated with thrombotic vascular conditions such as myocardial infarction and deep vein
thrombosis. This is thought to be related to the inhibition of fibrin degradation and vessel wall remodeling. It is thought to be a strong risk factor for coronary
artery disease and some suggest it can be used as an
independent risk factor for cardiovascular risk [48,
49]. It has also been implicated in cancer angiogenesis
and metastasis, wound healing, bacterial infections,
rheumatoid arthritis, and chronic kidney disease [50].
The link between PAI-1 and metabolic syndrome has been long established with elevated levels
being strongly correlated such that the more severe
the metabolic syndrome, the higher the PAI-1 [51-53].
Kraja et al showed that PAI-1 was strongly associated
with the components of metabolic syndrome, including BMI, triglycerides and insulin resistance [47]. Interestingly, several groups have found that PAI-1
levels are not associated with dyslipidemia but rather
with the distribution phenotype of adipocytes: visceral adipose tissue primarily and ectopic fat in the
liver [54, 55]. Given this, some suggest PAI-1 can serve
as a biomarker for ectopic fat storage. Like several of
the other metabolic syndrome biomarkers, differences
between the sexes have been noted, with the relationship being stronger in males than females [55].
PAI-1 levels decrease with calorie restriction, weight
loss, decrease in body fat, and when insulin resistance
improves [46, 56]. Treatment with insulin-sensitizing
drugs decreases PAI-1 in patients with diabetes and to
some extent in otherwise healthy obese individuals
[57].
Uric Acid
Uric acid is an endogenously produced terminal
degradation product of purine catabolism, formed by
the liver and excreted by the kidneys primarily and
intestines secondarily. Uric acid has antioxidant capacities extracellularly and can be responsible for 2/3
of the total plasma antioxidant capacity, where it
chelates metals and scavenges oxygen radicals.
However, intracellularly, it has pro-inflammatory and
pro-oxidant activity. It has been shown that uric acid
is a circulating marker for oxidative damage in conditions like ischemic liver, atherosclerosis, diabetes, and
chronic heart failure [58]. As a pro-oxidant, under
ischemic conditions or as a result of tissue damage,
uric acid oxidizes lipids, which results in inflammation that disrupts reverse cholesterol transport [59]. It
also decreases the availability of nitric oxide, which
30
results in less vasodilation and more reactive oxygen
species (ROS). This, coupled with its ability to stimulate monocytes to produce TNF-α, creates a
pro-inflammatory state found in metabolic syndrome.
Though its role in pathological diseases is not completely understood, uric acid likely causes systemic
inflammation [58].
Hyperuricemia is a well-known risk factor for
atherosclerotic events like myocardial infarction and
stroke, and is associated with other cardiovascular
risk factors like hypertension and dyslipidemia. Ishizaka et al also found a positive correlation between
uric acid and BMI, blood pressure, and triglycerides,
and a negative correlation with HDL-C [60]. Silva et al
shows that uric acid levels are significantly elevated in
males with abdominal obesity and females with abdominal obesity, low HDL-C, and hypertension [61].
It is also suggested that hyperuricemia is a marker of
insulin resistance, as some studies have shown that
decreasing insulin resistance by diet or medications
decreases uric acid levels [62-64]. Among dietary
causes of hyperuricemia, excess consumption of
fructose via added sucrose or high-fructose corn syrup is of particular interest, as this dietary component
has also been implicated in metabolic syndrome. According to Khitan and Kim, fructose metabolism is
initiated by an enzyme called ketohexokinase (KHK),
also known as fructokinase. This ATP-dependent step
in fructose metabolism lacks a negative feedback
mechanism, so in the event of excessive fructose
consumption, ATP is rapidly depleted and many of
the dephosphorylated adenosine compounds are
catabolized, resulting in increased uric acid [65].
Johnson et al demonstrated a link between fructose-induced hyperuricemia and an increased incidence of metabolic syndrome and some of its features,
including obesity, hypertension, and insulin resistance [66].
Given the relation of uric acid and all the components of metabolic syndrome, it is expected that
uric acid would be elevated for metabolic syndrome
as a whole as well. Ishizaka et al investigated the relationship between uric acid and metabolic syndrome
and found there to be a graded increase in the prevalence of metabolic syndrome with increasing uric acid
in both sexes, though there are differences in the levels between males and females [60]. Levels of uric acid
increase with age: in women of childbearing age, levels are lower, but increase to similar levels as males
when postmenopausal [67]. Several studies have
shown that uric acid levels are significantly elevated
in individuals with metabolic syndrome, increases
with the number of components of the condition, and
is an indicator of worse cardiovascular risk profile [61,
68, 69]. It is estimated that individuals with a high uric
Int. J. Med. Sci. 2016, Vol. 13
acid have an odds ratio of 1.6-fold higher for developing metabolic syndrome [70]. The close relationship
between uric acid and the presence of metabolic syndrome has been demonstrated in children, adolescents, and adults [71].
Through a search of the published literature to
date, uric acid appears to be the only metabolic syndrome biomarker studied in the West Virginian population. Soukup et al studied salivary uric acid as a
biomarker for metabolic syndrome and found the
relationship to metabolic syndrome and each of its
components similar to that of serum uric acid [72].
Similar to other studies, Soukup et al noted a stronger
association between uric acid levels and metabolic
syndrome in females than in males [72-74]. This is a
noninvasive and cost-effective method to diagnose
and monitor metabolic syndrome and its components
in rural locations, like West Virginia, where health
care capabilities are limited.
Interleukin-6
Interleukin-6 (IL-6) is a pro-inflammatory cytokine that plays a role in the natural inflammatory response. It is often secreted by M1 macrophages as part
of the normal inflammatory response against infection
and injury [75]. In metabolic syndrome, adipocyte
dysfunction is frequently present and is associated
with an increase in M1 macrophage population within
adipose tissue. This can result in increased secretion
of IL-6 and other pro-inflammatory cytokines from
adipose tissue. These pro-inflammatory cytokines can
then act through a number of cell signaling pathways,
including mTOR and Protein Kinase C (PKC) to induce insulin resistance. Through its inflammatory
properties it has been implicated in the endothelial
cell damage within blood vessels that leads to vascular dysfunction and atherosclerosis. Furthermore, IL-6
can cause aberrant insulin receptor activation, resulting in abnormal insulin signaling cascades, abnormal
insulin action, and abnormal glucose metabolism [75].
Studies have shown that elevated levels of IL-6
are associated with metabolic syndrome and increasing levels are associated with more severe metabolic
syndrome (assessed by hypertriglyceridemia, hypertension, and fasting glucose levels) [76-78]. Similar to
other biomarkers, IL-6 is also associated with each of
the components of metabolic syndrome. In a study on
postmenopausal women, elevated IL-6 was also associated with abdominal obesity, low HDL, and high
triglycerides [77]. Indulekha et al found elevated IL-6
was associated with insulin resistance [78]. In vivo
animal studies have shown the effect of IL-6 on insulin signaling: the administration of IL-6 to mice resulted in impaired insulin signaling in muscle and
liver tissue, leading to hyperglycemia and insulin
31
resistance [79].
IL-6’s close association with metabolic syndrome
and each of its components suggests that it is an important factor in the progression of metabolic syndrome and would be a good addition to a biomarker
panel.
Tumor Necrosis Factor-Alpha
Tumor Necrosis Factor-Alpha (TNF-α) is a
pro-inflammatory cytokine that is secreted by visceral
adipose tissue, a common characteristic of metabolic
syndrome [80]. Because metabolic syndrome is often
characterized by adipocyte dysregulation, and these
dysregulated adipocytes tend to secrete TNF-α, IL-6,
and other pro-inflammatory adipokines at higher
levels, the central obesity often encountered in metabolic syndrome could be a risk factor for elevated
TNF-α levels [75]. Furthermore, elevated TNF-α levels
are associated with insulin resistance via its aberrant
activation of the mTOR and PKC signaling pathways
[75]. Its contribution to the various characteristics of
metabolic syndrome suggest that TNF-α may be a
significant contributor to the development and progression of its associated disease processes.
In a study of middle-aged adults with metabolic
syndrome, elevated levels of TNF-α and other
pro-inflammatory cytokines were associated with
insulin resistance and hypertriglyceridemia. The
TNF-α, IL-6, and leptin levels in these patients were
higher than those levels in the control group, indicating that these cytokines directly correlated with metabolic syndrome [81]. It was hypothesized by Balasoiu
et al that early detection of a patient’s inflammatory
status, including TNF-α and IL-6, could be useful in
monitoring and early intervention for metabolic syndrome and its comorbidities [81]. In another study of
metabolic syndrome patients with coronary artery
disease (CAD), TNF-α levels were found to be significantly higher than the controls [82]. Indulekha et al
also found elevated TNF-α levels to be significantly
correlated with the presence of metabolic syndrome,
and more so in those with insulin resistance [78]. Musialik et al demonstrated elevated levels of soluble
TNF-α receptor (sTNFα-R), which is associated with
increased TNF-α activity, in patients with metabolic
syndrome with hypertension [80]. Because it exerts
such widespread systemic effects, TNF-α may contribute to the various disease processes associated
with metabolic syndrome.
Interleukin-10
Interleukin-10 (IL-10) is a predominantly anti-inflammatory cytokine that plays a role in modulating systemic inflammation. Secreted by monocytes
or M2 macrophages, one of its functions is to help
Int. J. Med. Sci. 2016, Vol. 13
promote normal tissue remodeling following an inflammatory response [75]. One of the methods by
which IL-10 moderates the inflammatory response is
by inhibiting NADPH oxidase, and therefore the oxidative stress resulting from this enzyme. This has
been associated with aberrant insulin receptor substrate (IRS) activation and impaired insulin signaling.
Furthermore, the insulin signaling pathway can be
dysregulated
by
abnormal
levels
of
the
pro-inflammatory cytokines IL-6 and TNF-α. IL-10
can restore normal insulin signaling by inhibiting
NADPH oxidase-induced oxidative stress or by antagonizing the actions of IL-6 and TNF-α [75, 79].
Regarding the role IL-10 plays in insulin signaling, a cross-sectional population study of elderly
adults demonstrated that low levels of IL-10 are associated with insulin resistance and type 2 diabetes.
Furthermore, the study found that IL-10 levels inversely correlated with levels of total cholesterol,
LDL, triglycerides, blood glucose and hemoglobin
A1c, and positively correlated with HDL levels [83].
Additionally, in a study on mice treated with IL-6 to
induce insulin resistance, in vivo administration of
IL-10 demonstrated protection from the impaired insulin signaling that resulted from IL-6 administration,
thereby restoring insulin sensitivity and normal glucose metabolism in liver and muscle tissue [79]. Because it antagonizes the pro-inflammatory actions of
IL-6 and TNF-α, which are both associated with metabolic syndrome and its comorbidities, IL-10 appears
to exert a protective effect against increases in these
cytokines.
The significance of IL-10 in relation to metabolic
syndrome as a whole, rather than its components,
however, is a little more complicated. A study of
obese children, found IL-10 levels to be elevated in
metabolic syndrome, even after BMI was taken into
account. Calcaterra et al proposed the elevated levels
to be due to the first phase of a complex mechanism in
the development of metabolic syndrome in children
[84]. Esposito et al studied obese and nonobese
women and found IL-10 to be elevated in obese
women compared to nonobese women but IL-10 levels were significantly lower in both obese and
nonobese women with metabolic syndrome [85].
Others have also shown IL-10 levels to be significantly
decreased in those with metabolic syndrome in both
males and females [86, 87]. Some have shown that
IL-10 levels are significantly correlated with other
cytokines like IL-6 and TNF-α. Adiponectin is correlated with IL-10 in patients with metabolic syndrome
and not the general population [88]. This suggests that
if both IL-10 and adiponectin are low, the risk of
metabolic syndrome is likely greater. The use of multiple biomarkers in a panel would likely increase the
32
sensitivity and specificity.
Oxidized LDL
Oxidized LDL (OxLDL) is a product of lipid oxidation and can serve as a marker of oxidative stress.
Lipid oxidation contributes to the generation of reactive oxygen species (ROS). These products form
components of OxLDL. Lipid oxidation products,
ROS, and OxLDL in low concentrations can serve as
signaling compounds for pathways of cellular antioxidants, including Heme Oxygenase (HO-1) and
glutathione. However, if the antioxidant capacity of
the cell is dysfunctional, as is often seen in metabolic
syndrome, then these compounds contribute to an
oxidative cascade that eventually leads to cell damage
and apoptosis [89]. This widespread cell damage and
death can contribute to the vascular dysfunction
commonly seen in metabolic syndrome, while the
dysfunctional OxLDL can further contribute to
dyslipidemia, presenting a risk factor for cardiovascular diseases, which are common comorbidities associated with metabolic syndrome. OxLDL contributes to atherosclerosis by invading and damaging the
blood vessel endothelium [90]. In addition to cardiovascular disease, elevated levels of OxLDL in adults
are associated with obesity and insulin resistance, two
common components of metabolic syndrome [91].
Studies have shown that levels of OxLDL are
significantly elevated in metabolic syndrome patients
and these elevated levels are further associated with
reduced arterial elasticity, a risk factor for the development of CAD [90, 92]. Other studies on children
associated elevated levels of OxLDL with increased
adiposity and insulin resistance. This study suggested
that oxidative stress, measured by OxLDL levels,
could be a contributing factor to insulin resistance,
and that these changes can present early in life [91].
Additionally, a longitudinal study of young adults
measured at baseline, 15 years later, and 20 years later
demonstrated a significant positive correlation between OxLDL levels and the incidence of metabolic
syndrome that arose between the 15-year and 20-year
follow-ups. The study also associated elevated OxLDL levels with central obesity, hyperglycemia, and
hypertriglyceridemia, all of which are components of
metabolic syndrome [93]. The literature suggests that
OxLDL serves not only as a promising biomarker for
metabolic syndrome detection, but a plausible mechanism by which the components of metabolic syndrome develop and progress.
Paraoxonase
Paraoxonase-1 (PON-1) is a multipurpose antitoxic and antioxidant enzyme and is believed to contribute to the antioxidant and anti-inflammatory
Int. J. Med. Sci. 2016, Vol. 13
properties of HDL [94, 95]. In particular, it can reduce
lipid peroxidation and protect LDL and tissue from
oxidative stress [96]. Levels of PON-1 activity correlate with systemic antitoxic and antioxidant capacity,
whereas oxidative stress and lipid peroxidation are
associated with the onset and progression of metabolic syndrome and some of its comorbidities, particularly vascular dysfunction (resulting from OxLDL)
[90]. In low concentrations, OxLDL and ROS serve as
signaling compounds in cellular antioxidant pathways, which serve to improve cellular protection
mechanisms in the face of oxidative stress. However,
if these antioxidant pathways are overwhelmed from
excessive oxidative stress, the oxidative cascade can
progress to cell damage and death, resulting in tissue
damage, particularly in vascular endothelial tissue
[89]. Because of its antioxidant properties, PON-1 may
play a role in managing the normal oxidative signaling pathway, and it could serve as a useful biomarker
in assessing antioxidant capacity, and by extension,
the propensity for systemic inflammation and vascular dysfunction.
In a study of lean, overweight and obese adolescents, decreased levels of PON-1 were associated
with central obesity and metabolic syndrome. Additionally, lower levels of PON-1 were associated with
hypertension, hypertriglyceridemia, insulin resistance, impaired glucose tolerance, and increased
oxidative stress [94]. Another study of women with
and without metabolic syndrome showed a negative
correlation between PON-1 levels and the presence of
CAD in metabolic syndrome patients [96]. CAD is a
significant comorbidity in metabolic syndrome, and
lower levels of PON-1 could be suggestive of a diminished effectiveness of HDL to attenuate CAD development and progression. Martinelli et al also
found that decreased PON-1 levels were associated
with metabolic syndrome, with an inverse correlation
between PON-1 levels and the severity of metabolic
syndrome and its comorbidities [95]. The literature
suggests that PON-1, via its antioxidant properties,
could play an important role in attenuating the components of metabolic syndrome that arise and progress as a result of oxidative stress.
Discussion
This paper is an attempt to compile the existing
literature of biomarkers with the most substantial
evidence of their relationships to metabolic syndrome.
Obesity has been classified as a disease state, and this
is especially true in the state of West Virginia, where
one of the larger cities, Huntington, was listed in a
recent CDC report as the most obese in the nation, in
the most obese developed country based on average
BMI. Thus, a panel of biomarkers that could be used
33
clinically to help predict and establish metabolic syndrome in individuals would be of immense value, not
only in treating those that already have the syndrome,
but in decreasing the overall prevalence of the disease
in the general population. While there have been a
number of studies looking at various cytokines and
adipokines thought to act as biomarkers for the syndrome, a panel that can be used in clinical practice
does not exist. Some have been shown to have greater
potential than others, but no single biomarker has
been shown to be indicative of metabolic syndrome
alone.
Metabolic syndrome is a multifactorial condition that stems from obesity as the causative factor,
though the exact mechanism is yet to be determined.
Many suggest that oxidative stress, the hallmark of
obesity, is linked to a chronic low-grade inflammation. The induced systemic oxidative stress is thought
to be at least partly responsible for the dysregulated
secretion of adipokines that contributes to metabolic
syndrome [9]. Hypertrophied adipocytes generate
high levels of ROS which impacts signaling and
neighboring perivascular endothelium or resident
immune cells [97]. This is compounded by ROS produced from the resultant metabolic derangements
such as hyperglycemia and dyslipidemia. Overall,
systemic oxidative stress promotes inflammation,
results in endothelial dysfunction and altered lipid
metabolism, and affects insulin sensitivity (Figure 2).
Leptin, LAR, PAI-1, uric acid, IL-6, TNF-α, and
OxLDL have all been shown to be elevated in metabolic syndrome, across different populations and
generally are correlated with the number of components of metabolic syndrome present. On the other
hand, adiponectin, ghrelin, IL-10, and PON-1 have all
been shown to be decreased in metabolic syndrome
(Table 2). Some ratios, such as HMW- adiponectin:
adiponectin and LAR are better predictors than any
alone. To date, there is no established panel to test for
metabolic syndrome, but this review has compiled a
panel of the best candidates.
Furthermore, utilizing the panel as a means of
customizing treatment and follow up may be possible
given that associations have been shown between
each of the biomarkers and lifestyle modifications and
medications. Though it is difficult to say whether
there is a true causal relationship between medications and alterations of the biomarker levels, these
associations can at least guide clinicians (Table 2).
Weight loss, which is already known as a treatment
for metabolic syndrome, has been shown to result in
levels of all the biomarkers normalizing. Metformin,
ACEI, and statins have shown similar effects, although data for every single biomarker is not available
for each of these drugs/drug classes.
Int. J. Med. Sci. 2016, Vol. 13
34
The potential for using multiple biomarkers for
diagnosis and early detection, and subsequent customization of treatment and risk management, is a
blossoming field with much room for research. Despite there being many studies on individual biomarkers, there is a void in research on the implications of multiple biomarkers being abnormal. Creat-
ing such a panel could provide a relatively easy and
minimally-invasive way to detect metabolic syndrome and possibly indicate the severity, depending
on the combination of aberrations. Such a panel
would be highly useful in locations where metabolic
syndrome poses a significant burden, such as West
Virginia.
Figure 2: Schematic representation of panel of biomarkers in metabolic syndrome.
Table 2: Biomarker levels in metabolic syndrome and interventions. ACEI- Angiotensin converting enzyme inhibitor; IFNβ- Interferon-β
Biomarker
Source
Metabolic
Syndrome
Interventions shown to “normalize” levels
Lifestyle Modification
Antihypertensive
Diabetic
Lipid Lowering
Other
Leptin
Adipocytes
Cardiomyocyte
Vascular Smooth
Muscle
Weight loss [98]
1. Hydralazine [99]
2. Valsartan[100]
3. Ramipril [98]
4. Candesartan [98]
5. Amlodipine[98]
6. Efonidipine [101]
7. pindolol [102]
8. Bunazosin [103]
9. Methyldopa [99]
Metformin [104]
Adiponectin
Adipocytes
Weight loss [106]
Valsartan [107]
1. Metformin [108]
2. Sitagliptin [109]
3. Pioglitazone [110]
4. Troglitazone [111]
5. Rosiglitazone [112]
6. Glimeperide [113]
Ghrelin
Stomach
Weight loss [115]
Valsartan [116]
1. Rosiglitazone [117]
2. Metformin [117]
PAI-1
Adipocytes
Hepatocytes
Smooth muscle
cells,
Platelets
Weight loss [56]
1. Imidapril [120]
2. Candesartan (cannot
sustain decreased PAI
>4 weeks) [120]
1. Metformin [121]
2. Troglitazone [57]
Statins [122]
Sibutramine [121]
Uric Acid
Liver
Weight loss [123]
1. Losartan [124]
1. Metformin [125]
1.Atorvastatin [126]
1.Sibutramine [125]
Bromocriptine [105]
Atorvastatin
(increases HMW
adiponectin) [114]
1.Flutamide [118]
2. Estrogen therapy
[119]
Int. J. Med. Sci. 2016, Vol. 13
Biomarker
Source
Metabolic
Syndrome
35
Interventions shown to “normalize” levels
Lifestyle Modification
Antihypertensive
Diabetic
Lipid Lowering
Other
2. Calcium Channel
Blockers [124]
3. ACEI [125]
2.Troglitazone [125]
2.Simvastatin [125]
3.Fenofibrate [125]
2. Orlistat [125]
IL-6
M1 macrophage
Weight loss[127]
1.ACEI [128]
2.Olmesartan [129]
Metformin [130]
1.Atorvastatin [131]
2.Pravastatin [132]
3.Simvastatin [133]
1.Hydrocortisone [134]
2.Celecoxib [135]
TNFα
Visceral Adipocytes, M1 macrophages
Weight loss [127]
Olmesrtan[129]
Metformin [130]
1.Atorvastatin [131]
2.Pravastatin [132]
1.Orlistat [127]
2.Hydrocortisone [134]
IL-10
Monocytes, M2
macrophage
Weight loss[136]
Metformin [130]
Statins [137]
1.Triamcinolone [138]
2.Montelukast [138]
3.IFNβ [139]
4.Beta 1-3 Glucan [140]
OxLDL
Adipocytes
Weight loss [141]
Vegan Diet [142]
Fosinopril [143]
1.Statins [144]
2.Ezetimibe [145]
Celecoxib [146]
PON-1
Liver
Weightloss**(dec
reases pon1)
[141]
Eplerenone [147])
Conclusion
Metabolic syndrome is a condition with genetic
and acquired etiologies that results in CVD complications in populations across the world, but especially
in the West Virginian population given the rates of
obesity, hypertension, and diabetes. Creating a panel
of biomarkers with a known and predictable association with metabolic syndrome can provide a means to
detect those at risk and intervene as needed. This
could significantly decrease the burden complications
impose on patients and the healthcare system.
Acknowledgement
This work was supported by National Institutes
of Health Grants to JIS (HL109015, HL105649 and
HL071556), and by the Brickstreet Foundation (J.I.S.).
Its contents are solely the responsibility of the authors
and do not necessarily represent the official views of
the National Institutes of Health.
Competing Interests
1.Rosiglitazone [148]
2.Sulfonueras[149]
6.
7.
8.
9.
10.
11.
12.
13.
14.
15.
16.
17.
The authors have declared that no competing
interest exists.
References
1.
2.
3.
4.
5.
Ford ES. The metabolic syndrome and mortality from cardiovascular disease
and all-causes: findings from the National Health and Nutrition Examination
Survey II Mortality Study. Atherosclerosis. 2004; 173: 309-14.
Aguilar M, Bhuket T, Torres S, Liu B, Wong RJ. Prevalence of the metabolic
syndrome in the United States, 2003-2012. Jama. 2015; 313: 1973-4.
Grundy SM, Cleeman JI, Daniels SR, Donato KA, Eckel RH, Franklin BA, et al.
Diagnosis and management of the metabolic syndrome: an American Heart
Association/National Heart, Lung, and Blood Institute scientific statement.
Current opinion in cardiology. 2006; 21: 1-6.
Alberti KG, Zimmet P, Shaw J. Metabolic syndrome--a new world-wide
definition. A Consensus Statement from the International Diabetes Federation.
Diabetic medicine : a journal of the British Diabetic Association. 2006; 23:
469-80.
Grundy SM, Brewer HB, Jr., Cleeman JI, Smith SC, Jr., Lenfant C, American
Heart A, et al. Definition of metabolic syndrome: Report of the National Heart,
18.
19.
20.
21.
1.Fibrates [150]
2.Statins ([151])
3. Probucol [152]
4.Ezetimibe [145]
Lung, and Blood Institute/American Heart Association conference on scientific issues related to definition. Circulation. 2004; 109: 433-8.
Bhandari R, Kelley GA, Hartley TA, Rockett IR. Metabolic syndrome is associated with increased breast cancer risk: a systematic review with meta-analysis. International journal of breast cancer. 2014; 2014: 189384.
Ryo M, Nakamura T, Kihara S, Kumada M, Shibazaki S, Takahashi M, et al.
Adiponectin as a biomarker of the metabolic syndrome. Circulation journal :
official journal of the Japanese Circulation Society. 2004; 68: 975-81.
Deng Y, Scherer PE. Adipokines as novel biomarkers and regulators of the
metabolic syndrome. Annals of the New York Academy of Sciences. 2010;
1212: E1-E19.
Furukawa S, Fujita T, Shimabukuro M, Iwaki M, Yamada Y, Nakajima Y, et al.
Increased oxidative stress in obesity and its impact on metabolic syndrome.
The Journal of clinical investigation. 2004; 114: 1752-61.
Raghavan S, Subramaniyam G, Shanmugam N. Proinflammatory effects of
malondialdehyde in lymphocytes. Journal of leukocyte biology. 2012; 92:
1055-67.
Fernandez-Sanchez A, Madrigal-Santillan E, Bautista M, Esquivel-Soto J,
Morales-Gonzalez A, Esquivel-Chirino C, et al. Inflammation, oxidative stress,
and obesity. International journal of molecular sciences. 2011; 12: 3117-32.
Mayeux R. Biomarkers: potential uses and limitations. NeuroRx : the journal
of the American Society for Experimental NeuroTherapeutics. 2004; 1: 182-8.
Dong M, Ren J. What fans the fire: insights into mechanisms of leptin in
metabolic syndrome-associated heart diseases. Current pharmaceutical design. 2014; 20: 652-8.
Ghantous CM, Azrak Z, Hanache S, Abou-Kheir W, Zeidan A. Differential
Role of Leptin and Adiponectin in Cardiovascular System. International
journal of endocrinology. 2015; 2015: 534320.
Yang R, Barouch LA. Leptin signaling and obesity: cardiovascular consequences. Circulation research. 2007; 101: 545-59.
Tardiff JC. Cardiac hypertrophy: stressing out the heart. The Journal of clinical
investigation. 2006; 116: 1467-70.
Thogersen AM, Soderberg S, Jansson JH, Dahlen G, Boman K, Nilsson TK, et
al. Interactions between fibrinolysis, lipoproteins and leptin related to a first
myocardial infarction. European journal of cardiovascular prevention and
rehabilitation : official journal of the European Society of Cardiology, Working
Groups on Epidemiology & Prevention and Cardiac Rehabilitation and Exercise Physiology. 2004; 11: 33-40.
Yoshinaga M, Sameshima K, Tanaka Y, Wada A, Hashiguchi J, Tahara H, et al.
Adipokines and the prediction of the accumulation of cardiovascular risk
factors or the presence of metabolic syndrome in elementary school children.
Circulation journal : official journal of the Japanese Circulation Society. 2008;
72: 1874-8.
Lee SW, Jo HH, Kim MR, You YO, Kim JH. Association between metabolic
syndrome and serum leptin levels in postmenopausal women. Journal of obstetrics and gynaecology : the journal of the Institute of Obstetrics and Gynaecology. 2012; 32: 73-7.
Gannage-Yared MH, Khalife S, Semaan M, Fares F, Jambart S, Halaby G.
Serum adiponectin and leptin levels in relation to the metabolic syndrome,
androgenic profile and somatotropic axis in healthy non-diabetic elderly men.
European journal of endocrinology / European Federation of Endocrine Societies. 2006; 155: 167-76.
Yun JE, Kimm H, Jo J, Jee SH. Serum leptin is associated with metabolic
syndrome in obese and nonobese Korean populations. Metabolism: clinical
and experimental. 2010; 59: 424-9.
Int. J. Med. Sci. 2016, Vol. 13
22. Martins Mdo C, Lima Faleiro L, Fonseca A. [Relationship between leptin and
body mass and metabolic syndrome in an adult population]. Revista portuguesa de cardiologia : orgao oficial da Sociedade Portuguesa de Cardiologia =
Portuguese journal of cardiology : an official journal of the Portuguese Society
of Cardiology. 2012; 31: 711-9.
23. Lara-Castro C, Fu Y, Chung BH, Garvey WT. Adiponectin and the metabolic
syndrome: mechanisms mediating risk for metabolic and cardiovascular disease. Current opinion in lipidology. 2007; 18: 263-70.
24. Kadowaki T, Yamauchi T, Kubota N, Hara K, Ueki K, Tobe K. Adiponectin
and adiponectin receptors in insulin resistance, diabetes, and the metabolic
syndrome. The Journal of clinical investigation. 2006; 116: 1784-92.
25. Matsuzawa Y, Funahashi T, Kihara S, Shimomura I. Adiponectin and metabolic syndrome. Arteriosclerosis, thrombosis, and vascular biology. 2004; 24:
29-33.
26. Spranger J, Kroke A, Mohlig M, Bergmann MM, Ristow M, Boeing H, et al.
Adiponectin and protection against type 2 diabetes mellitus. Lancet. 2003; 361:
226-8.
27. Santaniemi M, Kesaniemi YA, Ukkola O. Low plasma adiponectin concentration is an indicator of the metabolic syndrome. European journal of endocrinology / European Federation of Endocrine Societies. 2006; 155: 745-50.
28. Baratta R, Amato S, Degano C, Farina MG, Patane G, Vigneri R, et al. Adiponectin relationship with lipid metabolism is independent of body fat mass:
evidence from both cross-sectional and intervention studies. The Journal of
clinical endocrinology and metabolism. 2004; 89: 2665-71.
29. Falahi E, Khalkhali Rad AH, Roosta S. What is the best biomarker for metabolic syndrome diagnosis? Diabetes & metabolic syndrome. 2013.
30. Hara K, Horikoshi M, Yamauchi T, Yago H, Miyazaki O, Ebinuma H, et al.
Measurement of the high-molecular weight form of adiponectin in plasma is
useful for the prediction of insulin resistance and metabolic syndrome. Diabetes care. 2006; 29: 1357-62.
31. Kotani K, Sakane N. Leptin:adiponectin ratio and metabolic syndrome in the
general Japanese population. The Korean journal of laboratory medicine. 2011;
31: 162-6.
32. Cicero AF, Magni P, More M, Ruscica M, Borghi C, Strollo F, et al. Metabolic
syndrome, adipokines and hormonal factors in pharmacologically untreated
adult elderly subjects from the Brisighella Heart Study historical cohort. Obesity facts. 2012; 5: 319-26.
33. Finucane FM, Luan J, Wareham NJ, Sharp SJ, O'Rahilly S, Balkau B, et al.
Correlation of the leptin:adiponectin ratio with measures of insulin resistance
in non-diabetic individuals. Diabetologia. 2009; 52: 2345-9.
34. Cong WN, Golden E, Pantaleo N, White CM, Maudsley S, Martin B. Ghrelin
receptor signaling: a promising therapeutic target for metabolic syndrome and
cognitive dysfunction. CNS & neurological disorders drug targets. 2010; 9:
557-63.
35. Varela L, Vazquez MJ, Cordido F, Nogueiras R, Vidal-Puig A, Dieguez C, et al.
Ghrelin and lipid metabolism: key partners in energy balance. Journal of molecular endocrinology. 2011; 46: R43-63.
36. Tesauro M, Schinzari F, Rovella V, Di Daniele N, Lauro D, Mores N, et al.
Ghrelin restores the endothelin 1/nitric oxide balance in patients with obesity-related metabolic syndrome. Hypertension. 2009; 54: 995-1000.
37. Pulkkinen L, Ukkola O, Kolehmainen M, Uusitupa M. Ghrelin in diabetes and
metabolic syndrome. International journal of peptides. 2010; 2010.
38. Ukkola O, Poykko SM, Antero Kesaniemi Y. Low plasma ghrelin concentration is an indicator of the metabolic syndrome. Annals of medicine. 2006; 38:
274-9.
39. Ukkola O. Ghrelin and metabolic disorders. Current protein & peptide science. 2009; 10: 2-7.
40. Ukkola O. Ghrelin and the metabolic balance. Journal of endocrinological
investigation. 2005; 28: 849-52.
41. Tschop M, Weyer C, Tataranni PA, Devanarayan V, Ravussin E, Heiman ML.
Circulating ghrelin levels are decreased in human obesity. Diabetes. 2001; 50:
707-9.
42. Bacha F, Arslanian SA. Ghrelin suppression in overweight children: a manifestation of insulin resistance? The Journal of clinical endocrinology and metabolism. 2005; 90: 2725-30.
43. Fagerberg B, Hulten LM, Hulthe J. Plasma ghrelin, body fat, insulin resistance,
and smoking in clinically healthy men: the atherosclerosis and insulin resistance study. Metabolism: clinical and experimental. 2003; 52: 1460-3.
44. McLaughlin T, Abbasi F, Lamendola C, Frayo RS, Cummings DE. Plasma
ghrelin concentrations are decreased in insulin-resistant obese adults relative
to equally obese insulin-sensitive controls. The Journal of clinical endocrinology and metabolism. 2004; 89: 1630-5.
45. St-Pierre DH, Karelis AD, Coderre L, Malita F, Fontaine J, Mignault D, et al.
Association of acylated and nonacylated ghrelin with insulin sensitivity in
overweight and obese postmenopausal women. The Journal of clinical endocrinology and metabolism. 2007; 92: 264-9.
46. Binder BR, Christ G, Gruber F, Grubic N, Hufnagl P, Krebs M, et al. Plasminogen activator inhibitor 1: physiological and pathophysiological roles. News
in physiological sciences : an international journal of physiology produced
jointly by the International Union of Physiological Sciences and the American
Physiological Society. 2002; 17: 56-61.
47. Kraja AT, Province MA, Arnett D, Wagenknecht L, Tang W, Hopkins PN, et al.
Do inflammation and procoagulation biomarkers contribute to the metabolic
syndrome cluster? Nutrition & metabolism. 2007; 4: 28.
36
48. Paganelli F, Alessi MC, Morange P, Maixent JM, Levy S, Vague IJ. Relationship
of plasminogen activator inhibitor-1 levels following thrombolytic therapy
with rt-PA as compared to streptokinase and patency of infarct related coronary artery. Thrombosis and haemostasis. 1999; 82: 104-8.
49. Kruithof EK, Gudinchet A, Bachmann F. Plasminogen activator inhibitor 1 and
plasminogen activator inhibitor 2 in various disease states. Thrombosis and
haemostasis. 1988; 59: 7-12.
50. Malgorzewicz S, Skrzypczak-Jankun E, Jankun J. Plasminogen activator
inhibitor-1 in kidney pathology (Review). International journal of molecular
medicine. 2013; 31: 503-10.
51. Juhan-Vague I, Alessi MC, Mavri A, Morange PE. Plasminogen activator
inhibitor-1, inflammation, obesity, insulin resistance and vascular risk. Journal
of thrombosis and haemostasis : JTH. 2003; 1: 1575-9.
52. Bilgili S, Celebiler AC, Dogan A, Karaca B. Inverse relationship between
adiponectin and plasminogen activator inhibitor-1 in metabolic syndrome patients. Endocrine regulations. 2008; 42: 63-8.
53. Vague P, Juhan-Vague I, Aillaud MF, Badier C, Viard R, Alessi MC, et al.
Correlation between blood fibrinolytic activity, plasminogen activator inhibitor level, plasma insulin level, and relative body weight in normal and obese
subjects. Metabolism: clinical and experimental. 1986; 35: 250-3.
54. Sakkinen PA, Wahl P, Cushman M, Lewis MR, Tracy RP. Clustering of procoagulation, inflammation, and fibrinolysis variables with metabolic factors in
insulin resistance syndrome. American journal of epidemiology. 2000; 152:
897-907.
55. Alessi MC, Juhan-Vague I. PAI-1 and the metabolic syndrome: links, causes,
and consequences. Arteriosclerosis, thrombosis, and vascular biology. 2006;
26: 2200-7.
56. Folsom AR, Qamhieh HT, Wing RR, Jeffery RW, Stinson VL, Kuller LH, et al.
Impact of weight loss on plasminogen activator inhibitor (PAI-1), factor VII,
and other hemostatic factors in moderately overweight adults. Arteriosclerosis
and thrombosis : a journal of vascular biology / American Heart Association.
1993; 13: 162-9.
57. Kruszynska YT, Yu JG, Olefsky JM, Sobel BE. Effects of troglitazone on blood
concentrations of plasminogen activator inhibitor 1 in patients with type 2
diabetes and in lean and obese normal subjects. Diabetes. 2000; 49: 633-9.
58. Billiet L, Doaty S, Katz JD, Velasquez MT. Review of hyperuricemia as new
marker for metabolic syndrome. ISRN rheumatology. 2014; 2014: 852954.
59. McGillicuddy FC, de la Llera Moya M, Hinkle CC, Joshi MR, Chiquoine EH,
Billheimer JT, et al. Inflammation impairs reverse cholesterol transport in vivo.
Circulation. 2009; 119: 1135-45.
60. Ishizaka N, Ishizaka Y, Toda E, Nagai R, Yamakado M. Association between
serum uric acid, metabolic syndrome, and carotid atherosclerosis in Japanese
individuals. Arteriosclerosis, thrombosis, and vascular biology. 2005; 25:
1038-44.
61. Silva HA, Carraro JC, Bressan J, Hermsdorff HH. Relation between uric acid
and metabolic syndrome in subjects with cardiometabolic risk. Einstein. 2015;
13: 202-8.
62. Clausen JO, Borch-Johnsen K, Ibsen H, Pedersen O. Analysis of the relationship between fasting serum uric acid and the insulin sensitivity index in a
population-based sample of 380 young healthy Caucasians. European journal
of endocrinology / European Federation of Endocrine Societies. 1998; 138:
63-9.
63. Rathmann W, Funkhouser E, Dyer AR, Roseman JM. Relations of hyperuricemia with the various components of the insulin resistance syndrome in
young black and white adults: the CARDIA study. Coronary Artery Risk Development in Young Adults. Annals of epidemiology. 1998; 8: 250-61.
64. Tsunoda S, Kamide K, Minami J, Kawano Y. Decreases in serum uric acid by
amelioration of insulin resistance in overweight hypertensive patients: effect
of a low-energy diet and an insulin-sensitizing agent. American journal of
hypertension. 2002; 15: 697-701.
65. Khitan Z, Kim DH. Fructose: a key factor in the development of metabolic
syndrome and hypertension. Journal of nutrition and metabolism. 2013; 2013:
682673.
66. Johnson RJ, Segal MS, Sautin Y, Nakagawa T, Feig DI, Kang DH, et al. Potential role of sugar (fructose) in the epidemic of hypertension, obesity and the
metabolic syndrome, diabetes, kidney disease, and cardiovascular disease.
The American journal of clinical nutrition. 2007; 86: 899-906.
67. de Oliveira EP, Burini RC. High plasma uric acid concentration: causes and
consequences. Diabetology & metabolic syndrome. 2012; 4: 12.
68. Viazzi F, Garneri D, Leoncini G, Gonnella A, Muiesan ML, Ambrosioni E, et al.
Serum uric acid and its relationship with metabolic syndrome and cardiovascular risk profile in patients with hypertension: insights from the
I-DEMAND study. Nutrition, metabolism, and cardiovascular diseases :
NMCD. 2014; 24: 921-7.
69. Puig JG, Martinez MA. Hyperuricemia, gout and the metabolic syndrome.
Current opinion in rheumatology. 2008; 20: 187-91.
70. Chen LY, Zhu WH, Chen ZW, Dai HL, Ren JJ, Chen JH, et al. Relationship
between hyperuricemia and metabolic syndrome. Journal of Zhejiang University Science B. 2007; 8: 593-8.
71. Ford ES, Li C, Cook S, Choi HK. Serum concentrations of uric acid and the
metabolic syndrome among US children and adolescents. Circulation. 2007;
115: 2526-32.
72. Soukup M, Biesiada I, Henderson A, Idowu B, Rodeback D, Ridpath L, et al.
Salivary uric acid as a noninvasive biomarker of metabolic syndrome. Diabetology & metabolic syndrome. 2012; 4: 14.
Int. J. Med. Sci. 2016, Vol. 13
73. Chiou WK, Wang MH, Huang DH, Chiu HT, Lee YJ, Lin JD. The relationship
between serum uric acid level and metabolic syndrome: differences by sex and
age in Taiwanese. Journal of epidemiology / Japan Epidemiological Association. 2010; 20: 219-24.
74. Rodrigues SL, Baldo MP, Capingana P, Magalhaes P, Dantas EM, Molina Mdel
C, et al. Gender distribution of serum uric acid and cardiovascular risk factors:
population based study. Arquivos brasileiros de cardiologia. 2012; 98: 13-21.
75. Aroor AR, McKarns S, Demarco VG, Jia G, Sowers JR. Maladaptive immune
and inflammatory pathways lead to cardiovascular insulin resistance. Metabolism: clinical and experimental. 2013; 62: 1543-52.
76. Weiss TW, Arnesen H, Seljeflot I. Components of the interleukin-6 transsignalling system are associated with the metabolic syndrome, endothelial dysfunction and arterial stiffness. Metabolism: clinical and experimental. 2013; 62:
1008-13.
77. Chedraui P, Escobar GS, Perez-Lopez FR, Palla G, Montt-Guevara M, Cecchi E,
et al. Angiogenesis, inflammation and endothelial function in postmenopausal
women screened for the metabolic syndrome. Maturitas. 2014; 77: 370-4.
78. Indulekha K, Surendar J, Mohan V. High sensitivity C-reactive protein, tumor
necrosis factor-alpha, interleukin-6, and vascular cell adhesion molecule-1
levels in Asian Indians with metabolic syndrome and insulin resistance
(CURES-105). Journal of diabetes science and technology. 2011; 5: 982-8.
79. Kim HJ, Higashimori T, Park SY, Choi H, Dong J, Kim YJ, et al. Differential
effects of interleukin-6 and -10 on skeletal muscle and liver insulin action in
vivo. Diabetes. 2004; 53: 1060-7.
80. Musialik K. The influence of chosen adipocytokines on blood pressure values
in patients with metabolic syndrome. Kardiologia polska. 2012; 70: 1237-42.
81. Balasoiu M, Balasoiu AT, Stepan AE, Dinescu SN, Avramescu CS, Dumitrescu
D, et al. Proatherogenic adipocytokines levels in metabolic syndrome. Romanian journal of morphology and embryology = Revue roumaine de morphologie et embryologie. 2014; 55: 29-33.
82. Gormez S, Demirkan A, Atalar F, Caynak B, Erdim R, Sozer V, et al. Adipose
tissue gene expression of adiponectin, tumor necrosis factor-alpha and leptin
in metabolic syndrome patients with coronary artery disease. Internal medicine. 2011; 50: 805-10.
83. van Exel E, Gussekloo J, de Craen AJ, Frolich M, Bootsma-Van Der Wiel A,
Westendorp RG, et al. Low production capacity of interleukin-10 associates
with the metabolic syndrome and type 2 diabetes : the Leiden 85-Plus Study.
Diabetes. 2002; 51: 1088-92.
84. Calcaterra V, De Amici M, Klersy C, Torre C, Brizzi V, Scaglia F, et al. Adiponectin, IL-10 and metabolic syndrome in obese children and adolescents.
Acta bio-medica : Atenei Parmensis. 2009; 80: 117-23.
85. Esposito K, Pontillo A, Giugliano F, Giugliano G, Marfella R, Nicoletti G, et al.
Association of low interleukin-10 levels with the metabolic syndrome in obese
women. The Journal of clinical endocrinology and metabolism. 2003; 88:
1055-8.
86. Chen LX, Zhang SD, Zhu LL, Sun M. [Association of metabolic syndrome with
serum interleukin-10 and high sensitive C reactive protein(hs-CRP) in old
men]. Zhong nan da xue xue bao Yi xue ban = Journal of Central South University Medical sciences. 2008; 33: 970-4.
87. Choi KM, Ryu OH, Lee KW, Kim HY, Seo JA, Kim SG, et al. Serum adiponectin, interleukin-10 levels and inflammatory markers in the metabolic syndrome. Diabetes research and clinical practice. 2007; 75: 235-40.
88. Nishida M, Moriyama T, Sugita Y, Yamauchi-Takihara K. Interleukin-10
associates with adiponectin predominantly in subjects with metabolic syndrome. Circulation journal : official journal of the Japanese Circulation Society.
2007; 71: 1234-8.
89. Landar A, Zmijewski JW, Dickinson DA, Le Goffe C, Johnson MS, Milne GL, et
al. Interaction of electrophilic lipid oxidation products with mitochondria in
endothelial cells and formation of reactive oxygen species. American journal
of physiology Heart and circulatory physiology. 2006; 290: H1777-87.
90. Pohjantahti-Maaroos H, Palomaki A, Kankkunen P, Laitinen R, Husgafvel S,
Oksanen K. Circulating oxidized low-density lipoproteins and arterial elasticity: comparison between men with metabolic syndrome and physically active
counterparts. Cardiovascular diabetology. 2010; 9: 41.
91. Kelly AS, Jacobs DR, Jr., Sinaiko AR, Moran A, Steffen LM, Steinberger J.
Relation of circulating oxidized LDL to obesity and insulin resistance in children. Pediatric diabetes. 2010; 11: 552-5.
92. Sigurdardottir V, Fagerberg B, Hulthe J. Circulating oxidized low-density
lipoprotein (LDL) is associated with risk factors of the metabolic syndrome
and LDL size in clinically healthy 58-year-old men (AIR study). Journal of internal medicine. 2002; 252: 440-7.
93. Holvoet P, Lee DH, Steffes M, Gross M, Jacobs DR, Jr. Association between
circulating oxidized low-density lipoprotein and incidence of the metabolic
syndrome. Jama. 2008; 299: 2287-93.
94. Krzystek-Korpacka M, Patryn E, Hotowy K, Czapinska E, Majda J, Kustrzeba-Wojcicka I, et al. Paraoxonase (PON)-1 activity in overweight and obese
children and adolescents: association with obesity-related inflammation and
oxidative stress. Advances in clinical and experimental medicine : official organ Wroclaw Medical University. 2013; 22: 229-36.
95. Martinelli N, Micaglio R, Consoli L, Guarini P, Grison E, Pizzolo F, et al. Low
levels of serum paraoxonase activities are characteristic of metabolic syndrome and may influence the metabolic-syndrome-related risk of coronary
artery disease. Experimental diabetes research. 2012; 2012: 231502.
37
96. Yilmaz H, Sayar N, Yilmaz M, Gurkan U, Sesal C, Tosu R, et al. Serum
paraoxonase 1 activity in women with metabolic syndrome. Kardiologia polska. 2010; 68: 1219-24.
97. Le Lay S, Simard G, Martinez MC, Andriantsitohaina R. Oxidative stress and
metabolic pathologies: from an adipocentric point of view. Oxidative medicine
and cellular longevity. 2014; 2014: 908539.
98. Koh KK, Park SM, Quon MJ. Leptin and cardiovascular disease: response to
therapeutic interventions. Circulation. 2008; 117: 3238-49.
99. Anato V, Garmendia JV, Bianco NE, De Sanctis JB. Antihypertensive treatment
decreased serum leptin levels in severe preeclampsia during pregnancy. Annals of nutrition & metabolism. 2001; 45: 190-2.
100. Fogari R, Derosa G, Zoppi A, Rinaldi A, Lazzari P, Fogari E, et al. Comparison
of the effects of valsartan and felodipine on plasma leptin and insulin sensitivity in hypertensive obese patients. Hypertension research : official journal
of the Japanese Society of Hypertension. 2005; 28: 209-14.
101. Koh KK, Quon MJ, Lee SJ, Han SH, Ahn JY, Kim JA, et al. Efonidipine simultaneously improves blood pressure, endothelial function, and metabolic parameters in nondiabetic patients with hypertension. Diabetes care. 2007; 30:
1605-7.
102. Ficek J, Kokot F, Chudek J, Adamczak M, Ficek R, Wiecek A. Influence of
antihypertensive treatment with perindopril, pindolol or felodipinon plasma
leptin concentration in patients with essential hypertension. Hormone and
metabolic research = Hormon- und Stoffwechselforschung = Hormones et
metabolisme. 2002; 34: 703-8.
103. Ihara S, Shimamoto K, Watanabe H, Sakai R, Kawana M. An alpha1-receptor
blocker reduces plasma leptin levels in hypertensive patients with obesity and
hyperleptinemia. Hypertension research : official journal of the Japanese Society of Hypertension. 2006; 29: 805-11.
104. Glueck CJ, Fontaine RN, Wang P, Subbiah MT, Weber K, Illig E, et al. Metformin reduces weight, centripetal obesity, insulin, leptin, and low-density
lipoprotein cholesterol in nondiabetic, morbidly obese subjects with body
mass index greater than 30. Metabolism: clinical and experimental. 2001; 50:
856-61.
105. Kok P, Roelfsema F, Frolich M, van Pelt J, Meinders AE, Pijl H. Activation of
dopamine D2 receptors lowers circadian leptin concentrations in obese
women. The Journal of clinical endocrinology and metabolism. 2006; 91:
3236-40.
106. Huang F, Del-Rio-Navarro BE, Perez-Ontiveros JA, Ruiz-Bedolla E,
Saucedo-Ramirez OJ, Villafana S, et al. Effect of six-month lifestyle intervention on adiponectin, resistin and soluble tumor necrosis factor-alpha receptors
in obese adolescents. Endocrine journal. 2014; 61: 921-31.
107. Lee JM, Kim JH, Son HS, Hong EG, Yu JM, Han KA, et al. Valsartan increases
circulating adiponectin levels without changing HOMA-IR in patients with
type 2 diabetes mellitus and hypertension. The Journal of international medical research. 2010; 38: 234-41.
108. Miazgowski T, Dziwura-Ogonowska J, Safranow K, Iskierska K, Widecka K.
Changes in adiponectin level and fat distribution in patients with type 2 diabetes. European journal of clinical investigation. 2014; 44: 192-9.
109. Hibuse T, Maeda N, Kishida K, Kimura T, Minami T, Takeshita E, et al. A pilot
three-month sitagliptin treatment increases serum adiponectin level in Japanese patients with type 2 diabetes mellitus--a randomized controlled trial
START-J study. Cardiovascular diabetology. 2014; 13: 96.
110. Sam S, Haffner S, Davidson MH, D'Agostino R, Sr., Perez A, Mazzone T.
Pioglitazone-mediated changes in lipoprotein particle composition are predicted by changes in adiponectin level in type 2 diabetes. The Journal of clinical endocrinology and metabolism. 2012; 97: E110-4.
111. Phillips SA, Ciaraldi TP, Kong AP, Bandukwala R, Aroda V, Carter L, et al.
Modulation of circulating and adipose tissue adiponectin levels by antidiabetic therapy. Diabetes. 2003; 52: 667-74.
112. Kim SG, Ryu OH, Kim HY, Lee KW, Seo JA, Kim NH, et al. Effect of rosiglitazone on plasma adiponectin levels and arterial stiffness in subjects with
prediabetes or non-diabetic metabolic syndrome. European journal of endocrinology / European Federation of Endocrine Societies. 2006; 154: 433-40.
113. Li CJ, Zhang JY, Yu DM, Zhang QM. Adding glimepiride to current insulin
therapy increases high-molecular weight adiponectin levels to improve glycemic control in poorly controlled type 2 diabetes. Diabetology & metabolic
syndrome. 2014; 6: 41.
114. von Eynatten M, Liu D, Bluemm A, Schuster T, Baumann M, Lutz J, et al.
Changes in adiponectin multimer distribution in response to atorvastatin
treatment in patients with type 2 diabetes. Clinical endocrinology. 2009; 71:
27-32.
115. Stoeckli R, Chanda R, Langer I, Keller U. Changes of body weight and plasma
ghrelin levels after gastric banding and gastric bypass. Obesity research. 2004;
12: 346-50.
116. Meric C, Aydogdu A, Tasci I, Deniz F, Baysan O, Serdar M, et al. Effects of
valsartan treatment on serum ghrelin level and left ventricular mass index in
patients with untreated primary hypertension. Anadolu kardiyoloji dergisi :
AKD = the Anatolian journal of cardiology. 2014; 14: 234-8.
117. Kadoglou NP, Tsanikidis H, Kapelouzou A, Vrabas I, Vitta I, Karayannacos
PE, et al. Effects of rosiglitazone and metformin treatment on apelin, visfatin,
and ghrelin levels in patients with type 2 diabetes mellitus. Metabolism: clinical and experimental. 2010; 59: 373-9.
118. Gambineri A, Pagotto U, Tschop M, Vicennati V, Manicardi E, Carcello A, et
al. Anti-androgen treatment increases circulating ghrelin levels in obese
Int. J. Med. Sci. 2016, Vol. 13
119.
120.
121.
122.
123.
124.
125.
126.
127.
128.
129.
130.
131.
132.
133.
134.
135.
136.
137.
138.
139.
140.
141.
women with polycystic ovary syndrome. Journal of endocrinological investigation. 2003; 26: 629-34.
Kellokoski E, Poykko SM, Karjalainen AH, Ukkola O, Heikkinen J, Kesaniemi
YA, et al. Estrogen replacement therapy increases plasma ghrelin levels. The
Journal of clinical endocrinology and metabolism. 2005; 90: 2954-63.
Fogari R, Zoppi A, Mugellini A, Maffioli P, Lazzari P, Derosa G. Role of
angiotensin II in plasma PAI-1 changes induced by imidapril or candesartan in
hypertensive patients with metabolic syndrome. Hypertension research : official journal of the Japanese Society of Hypertension. 2011; 34: 1321-6.
Koiou E, Tziomalos K, Katsikis I, Delkos D, Tsourdi EA, Panidis D. Disparate
effects of pharmacotherapy on plasma plasminogen activator inhibitor-1 levels
in women with the polycystic ovary syndrome. Hormones. 2013; 12: 559-66.
Laufs U, Wassmann S, Schackmann S, Heeschen C, Bohm M, Nickenig G.
Beneficial effects of statins in patients with non-ischemic heart failure.
Zeitschrift fur Kardiologie. 2004; 93: 103-8.
Nicholls A, Scott JT. Effect of weight-loss on plasma and urinary levels of uric
acid. Lancet. 1972; 2: 1223-4.
Choi HK, Soriano LC, Zhang Y, Rodriguez LA. Antihypertensive drugs and
risk of incident gout among patients with hypertension: population based
case-control study. Bmj. 2012; 344: d8190.
Tsouli SG, Liberopoulos EN, Mikhailidis DP, Athyros VG, Elisaf MS. Elevated
serum uric acid levels in metabolic syndrome: an active component or an innocent bystander? Metabolism: clinical and experimental. 2006; 55: 1293-301.
Athyros VG, Elisaf M, Papageorgiou AA, Symeonidis AN, Pehlivanidis AN,
Bouloukos VI, et al. Effect of statins versus untreated dyslipidemia on serum
uric acid levels in patients with coronary heart disease: a subgroup analysis of
the GREek Atorvastatin and Coronary-heart-disease Evaluation (GREACE)
study. American journal of kidney diseases : the official journal of the National
Kidney Foundation. 2004; 43: 589-99.
Samuelsson L, Gottsater A, Lindgarde F. Decreasing levels of tumour necrosis
factor alpha and interleukin 6 during lowering of body mass index with
orlistat or placebo in obese subjects with cardiovascular risk factors. Diabetes,
obesity & metabolism. 2003; 5: 195-201.
Gullestad L, Aukrust P, Ueland T, Espevik T, Yee G, Vagelos R, et al. Effect of
high- versus low-dose angiotensin converting enzyme inhibition on cytokine
levels in chronic heart failure. Journal of the American College of Cardiology.
1999; 34: 2061-7.
Fliser D, Buchholz K, Haller H, Olmesartan EUTo, Pravastatin in I, Atherosclerosis I. Antiinflammatory effects of angiotensin II subtype 1 receptor
blockade in hypertensive patients with microinflammation. Circulation. 2004;
110: 1103-7.
Hyun B, Shin S, Lee A, Lee S, Song Y, Ha NJ, et al. Metformin Down-regulates
TNF-alpha Secretion via Suppression of Scavenger Receptors in Macrophages.
Immune network. 2013; 13: 123-32.
Sola S, Mir MQ, Lerakis S, Tandon N, Khan BV. Atorvastatin improves left
ventricular systolic function and serum markers of inflammation in nonischemic heart failure. Journal of the American College of Cardiology. 2006; 47:
332-7.
Freeman DJ, Norrie J, Sattar N, Neely RD, Cobbe SM, Ford I, et al. Pravastatin
and the development of diabetes mellitus: evidence for a protective treatment
effect in the West of Scotland Coronary Prevention Study. Circulation. 2001;
103: 357-62.
Rezaie-Majd A, Maca T, Bucek RA, Valent P, Muller MR, Husslein P, et al.
Simvastatin reduces expression of cytokines interleukin-6, interleukin-8, and
monocyte chemoattractant protein-1 in circulating monocytes from hypercholesterolemic patients. Arteriosclerosis, thrombosis, and vascular biology.
2002; 22: 1194-9.
DeRijk RH, Petrides J, Deuster P, Gold PW, Sternberg EM. Changes in corticosteroid sensitivity of peripheral blood lymphocytes after strenuous exercise
in humans. The Journal of clinical endocrinology and metabolism. 1996; 81:
228-35.
Abbasi SH, Hosseini F, Modabbernia A, Ashrafi M, Akhondzadeh S. Effect of
celecoxib add-on treatment on symptoms and serum IL-6 concentrations in
patients with major depressive disorder: randomized double-blind placebo-controlled study. Journal of affective disorders. 2012; 141: 308-14.
Jung SH, Park HS, Kim KS, Choi WH, Ahn CW, Kim BT, et al. Effect of weight
loss on some serum cytokines in human obesity: increase in IL-10 after weight
loss. The Journal of nutritional biochemistry. 2008; 19: 371-5.
Liakopoulos OJ, Dorge H, Schmitto JD, Nagorsnik U, Grabedunkel J,
Schoendube FA. Effects of preoperative statin therapy on cytokines after cardiac surgery. The Thoracic and cardiovascular surgeon. 2006; 54: 250-4.
Stelmach I, Jerzynska J, Kuna P. A randomized, double-blind trial of the effect
of glucocorticoid, antileukotriene and beta-agonist treatment on IL-10 serum
levels in children with asthma. Clinical and experimental allergy : journal of
the British Society for Allergy and Clinical Immunology. 2002; 32: 264-9.
Krakauer M, Sorensen P, Khademi M, Olsson T, Sellebjerg F. Increased IL-10
mRNA and IL-23 mRNA expression in multiple sclerosis: interferon-beta
treatment increases IL-10 mRNA expression while reducing IL-23 mRNA expression. Multiple sclerosis. 2008; 14: 622-30.
Sarinho E, Medeiros D, Schor D, Rego Silva A, Sales V, Motta ME, et al. Production of interleukin-10 in asthmatic children after Beta-1-3-glucan. Allergologia et immunopathologia. 2009; 37: 188-92.
Rector RS, Warner SO, Liu Y, Hinton PS, Sun GY, Cox RH, et al. Exercise and
diet induced weight loss improves measures of oxidative stress and insulin
38
142.
143.
144.
145.
146.
147.
148.
149.
150.
151.
152.
sensitivity in adults with characteristics of the metabolic syndrome. American
journal of physiology Endocrinology and metabolism. 2007; 293: E500-6.
Elkan AC, Sjoberg B, Kolsrud B, Ringertz B, Hafstrom I, Frostegard J. Gluten-free vegan diet induces decreased LDL and oxidized LDL levels and raised
atheroprotective natural antibodies against phosphorylcholine in patients
with rheumatoid arthritis: a randomized study. Arthritis research & therapy.
2008; 10: R34.
Hayek T, Attias J, Coleman R, Brodsky S, Smith J, Breslow JL, et al. The angiotensin-converting enzyme inhibitor, fosinopril, and the angiotensin II receptor antagonist, losartan, inhibit LDL oxidation and attenuate atherosclerosis
independent of lowering blood pressure in apolipoprotein E deficient mice.
Cardiovascular research. 1999; 44: 579-87.
Vasankari T, Ahotupa M, Toikka J, Mikkola J, Irjala K, Pasanen P, et al. Oxidized LDL and thickness of carotid intima-media are associated with coronary
atherosclerosis in middle-aged men: lower levels of oxidized LDL with statin
therapy. Atherosclerosis. 2001; 155: 403-12.
Turfaner N, Uzun H, Balci H, Ercan MA, Karter YH, Caner M, et al. Ezetimibe
therapy and its influence on oxidative stress and fibrinolytic activity. Southern
medical journal. 2010; 103: 428-33.
Chenevard R, Hurlimann D, Bechir M, Enseleit F, Spieker L, Hermann M, et al.
Selective COX-2 inhibition improves endothelial function in coronary artery
disease. Circulation. 2003; 107: 405-9.
Noll C, Messaoudi S, Milliez P, Samuel JL, Delcayre C, Janel N. Eplerenone
administration has beneficial effect on hepatic paraoxonase 1 activity in diabetic mice. Atherosclerosis. 2010; 208: 26-7.
Carreon-Torres E, Rendon-Sauer K, Monter-Garrido M, Toledo-Ibelles P,
Gamboa R, Menjivar M, et al. Rosiglitazone modifies HDL structure and increases HDL-apo AI synthesis and catabolic rates. Clinica chimica acta; international journal of clinical chemistry. 2009; 401: 37-41.
Wojcicka G, Jamroz-Wisniewska A, Marciniak A, Lowicka E, Beltowski J. The
differentiating effect of glimepiride and glibenclamide on paraoxonase 1 and
platelet-activating factor acetylohydrolase activity. Life sciences. 2010; 87:
126-32.
Gouedard C, Koum-Besson N, Barouki R, Morel Y. Opposite regulation of the
human paraoxonase-1 gene PON-1 by fenofibrate and statins. Molecular
pharmacology. 2003; 63: 945-56.
Costa LG, Giordano G, Furlong CE. Pharmacological and dietary modulators
of paraoxonase 1 (PON1) activity and expression: the hunt goes on. Biochemical pharmacology. 2011; 81: 337-44.
Hong SC, Zhao SP, Wu ZH. Probucol up-regulates paraoxonase 1 expression
in hepatocytes of hypercholesterolemic rabbits. Journal of cardiovascular
pharmacology. 2006; 47: 77-81.