Expression of sterol regulatory element-binding proteins in epicardial adipose tissue in patients with coronary artery disease and diabetes mellitus: Preliminary study
Bạn đang xem bản rút gọn của tài liệu. Xem và tải ngay bản đầy đủ của tài liệu tại đây (324.96 KB, 7 trang )
Int. J. Med. Sci. 2017, Vol. 14
Ivyspring
International Publisher
268
International Journal of Medical Sciences
2017; 14(3): 268-274. doi: 10.7150/ijms.17821
Research Paper
Expression of Sterol Regulatory Element-Binding
Proteins in epicardial adipose tissue in patients with
coronary artery disease and diabetes mellitus:
preliminary study
Luis M. Pérez-Belmonte1*, Inmaculada Moreno-Santos1*, Fernando Cabrera-Bueno1, Gemma
Sánchez-Espín1, Daniel Castellano2, Miguel Such1, María G Crespo-Leiro3, Fernando Carrasco-Chinchilla1,
Luis Alonso-Pulpón4, Miguel López-Garrido1, Amalio Ruiz-Salas1, Víctor M. Becerra-Muñoz1, Juan J.
Gómez-Doblas1, Eduardo de Teresa-Galván1, Manuel Jiménez-Navarro1
1.
2.
3.
4.
Unidad de Gestión Clínica del Corazón, Hospital Universitario Virgen de la Victoria, Instituto de Investigación Biomédica de Málaga (IBIMA), Universidad de Málaga
(UMA), CIBERCV Enfermedades Cardiovasculares, Málaga, Spain.
Unidad de Gestión Clínica de Endocrinología y Nutrición, Laboratorio del Instituto de Investigación Biomédica de Málaga (IBIMA), Hospital Universitario de Málaga
(Virgen de la Victoria), Málaga, Spain. CIBER Pathophysiology of obesity and nutrition, Spain.
Servicio de Cardiología, Complejo Hospitalario Universitario A Coruña, Instituto de Investigación Biomédica A Coruña (INIBIC), CIBERCV Enfermedades
Cardiovasculares, A Coruña. Spain.
Servicio de Cardiología, Hospital Universitario Puerta de Hierro-Majadahonda, Universidad Autónoma de Madrid, CIBERCV Enfermedades Cardiovasculares,
Madrid, Spain.
*These authors contributed equally to this work.
Corresponding authors: Luis M. Pérez-Belmonte MD, PhD. Address: Unidad de Gestión Clínica del Corazón, Hospital Clínico Universitario Virgen de la
Victoria. Campus Universitario de Teatinos, s/n. Málaga, Spain. Phone: 0034951032672. E-mail: Manuel Jiménez-Navarro.
Address: Unidad de Gestión Clínica del Corazón, Hospital Clínico Universitario Virgen de la Victoria. Campus Universitario de Teatinos, s/n. Málaga, Spain.
Phone: 0034951032672. E-mail: jimeneznavarro@secardiología.es.
© Ivyspring International Publisher. This is an open access article distributed under the terms of the Creative Commons Attribution (CC BY-NC) license
( See for full terms and conditions.
Received: 2016.10.05; Accepted: 2016.12.20; Published: 2017.02.23
Abstract
Objectives: Sterol regulatory element-binding proteins (SREBP) genes are crucial in lipid biosynthesis
and cardiovascular homeostasis. Their expression in epicardial adipose tissue (EAT) and their influence
in the development of coronary artery disease (CAD) and type-2 diabetes mellitus remain to be
determined. The aim of our study was to evaluate the expression of SREBP genes in EAT in patients with
CAD according to diabetes status and its association with clinical and biochemical data.
Methods: SREBP-1 and SREBP-2 mRNA expression levels were measured in EAT from 49 patients
with CAD (26 with diabetes) and 23 controls without CAD or diabetes.
Results: Both SREBPs mRNA expression were significantly higher in patients with CAD and diabetes
(p<0.001) and were identified as independent cardiovascular risk factor for coronary artery disease in
patients with type-2 diabetes (SREBP-1: OR 1.7, 95%CI 1.1-2.5, p=0.02; SREBP-2: OR 1.6, 95%CI 1.2-3,
p=0.02) and were independently associated with the presence of multivessel CAD, left main and
anterior descending artery stenosis, and higher total and LDL cholesterol levels, and lower HDL
cholesterol levels, in patients with CAD and diabetes.
Conclusions: SREBP genes are expressed in EAT and were higher in CAD patients with diabetes than
those patients without CAD or diabetes. SREBP expression was associated as cardiovascular risk factor
for the severity of CAD and the poor lipid control. In this preliminary study we suggest the importance
of EAT in the lipid metabolism and cardiovascular homeostasis for coronary atherosclerosis of patients
with diabetes and highlight a future novel therapeutic target.
Key words: Sterol regulatory element-binding proteins (SREBP), epicardial adipose tissue, coronary artery
disease, type-2 diabetes mellitus.
Int. J. Med. Sci. 2017, Vol. 14
Introduction
The biosynthesis of cholesterol, fatty acid, and
triglyceride is regulated by a family of major
transcription factors, called Sterol regulatory
element-binding proteins (SREBPs) [1]. They control
the expression of crucial genes involved in lipogenesis
and lipid uptake. Due to SREBPs play a vital role in
synthesizing of lipids, its dysregulation may be
intimately associated with type-2 diabetes mellitus
(DM2), obesity and cardiovascular diseases [2,3].
In humans there are two SREBP genes, SREBP-1
and SREBP-2. SREBP-1 is more associated with the
control of genes involved in fatty acid metabolism and
SREBP-2 is closely associated with cholesterol
biosynthesis and metabolism. SREBP-1 is most
abundant in the liver and adrenal gland, whereas
SREBP-2 is ubiquitously expressed [4].
Epicardial adipose tissue (EAT) represents a
visceral fat depot located between the myocardium
and the inner layer of visceral pericardium [5]. EAT
participates in the energy homeostasis of the heart
and the vessels. In fact, the functional EAT has been
proposed to play a protector role over the
myocardium or coronary arteries. However, EAT
dysfunction has been implicated in the development
and progression of coronary artery disease (CAD),
mainly in patients with DM2, involving a more
aggressive course and greater morbidity and
mortality than in patients without DM2 [6].
EAT has not been fully characterized and has
gained significant attention in recent years [5].
Actually, the expression of SREBP genes in EAT and
the role of this tissue in the lipid biosynthesis and
metabolism, and subsequently, in coronary
atherosclerosis, has not been widely described. The
aim of our study was to evaluate the expression of
SREBP-1 and SREBP-2 in EAT in patients with CAD,
stablishing the difference between patients with and
without DM2. We hypothesized that SREBP genes
would be expressed in EAT and would be altered
according to diabetes status, playing an important
role in the cardiovascular system of CAD patients. We
also assessed the possible association between SREBP
expression and clinical and biochemical data in
patients of our cohort.
Methods
Patients
We included a total of 49 patients who
underwent Coronary Artery Bypass Surgery (CAD
group) and 23 patients who underwent aortic and/or
mitral valve replacement (Control group). The CAD
group was divided into two groups: those with DM2
(n=26) (CAD-DM2 group) and those without DM2
269
(n=23) (CAD-NDM2).
The CAD was defined by the presence of greater
than or equal to 50% luminal diameter stenosis in at
least one major epicardial artery by coronary
angiogram. Multivessel disease was defined as the
presence of this stenosis in two or more major
epicardial arteries. Stenosis of one major epicardial
artery was considered as single vessel disease.
Patients of the Control group had chronic valvular
heart disease, without CAD or DM2.
Exclusion criteria were acute inflammatory
disease, severe infective disease and/or cancer, and
women who were taking hormone replacement.
All patients gave written informed consent, and
the study protocol was approved by the local Clinical
Research Ethics Committee and carried out in
accordance with the Declaration of Helsinki.
Biological material
Human EAT biopsy samples (average 0.2 to 0.5g)
were taken near the proximal right coronary artery,
approximately 1 hour after anesthesia. All the tissues
were frozen immediately in liquid nitrogen and
stored at -80ºC for RNA isolation.
Blood assays
On the morning of surgery, peripheral venous
blood was drawn into pyrogen-free tubes with or
without EDTA as an anticoagulant. For serum, the
tubes were left at room temperature for 20 min and
then centrifuged at 1500 g for 10 min at 4ºC. Fasting
glucose, glycated hemoglobin (HbA1c), total
cholesterol, low-density lipoprotein (LDL), highdensity lipoprotein (HDL), triglycerides, creatinine,
uric acid, glutamic-oxolacetic transaminase (GOT),
glutamate-piruvate transaminase (GPT), gammaglutamyl transferase (GGT), C-reactive protein (CRP),
calcium, sodium and potassium were measured in a
Dimension autoanalyzer (Dade Behring Inc.,
Deerfield, IL) by enzymatic methods (Randox
Laboratories, Ldt., UK) in the hospital laboratory.
RNA Isolation and TaqMan Real-Time Reverse
Transcription–Polymerase Chain Reaction
Adipose tissue samples were minced in TriZol
reagent (Invitrogen) and homogenized completely on
ice. Total RNA was extracted by chloroform and
purified through RNeasy minicolumns. After
on-column DNase treatment, RNA was eluted with
Rnase-free water. Total RNA was quantified with a
spectrophotometer (Nanodrop N-100, Thermo
Scientific), and all samples had a 260/280 nm
absorbance ratio ≥1.8. Reverse transcriptions were
performed using 1 µg of total RNA with Transcriptor
First Strand cDNA Synthesis Kit (Roche) and random
Int. J. Med. Sci. 2017, Vol. 14
270
hexamers in 20 µl reactions. The gene expression
levels in the adipose tissue were determined by real
time quantitative polymerase chain reaction (PCR)
using a predesigned and validated Taqman
primer/probe sets. Real-time PCR amplifications
were performed on 96-well plates in reaction buffer
containing Taqman Universal PCR Master Mix (No
AmpErase UNG, Applied Biosystems, USA), 150 nM
Taqman probe, 900 nM primers, and 22.5 ng cDNA.
PCR reaction conditions were 48°C for 30 minutes,
95°C for 10 minutes, followed by 40 cycles of 95°C for
15 seconds and 60°C for 1 minute using an ABI 7500
Fast Detection System (Applied Biosystems). Data
were obtained as Ct values according to the
manufacturer’s guidelines (the cycle number at which
logarithmic PCR plots cross a calculated threshold
line) and were used to determine ΔCt values (ΔCt = Ct
of the target gene minus Ct of the housekeeping
gene). Cyclophilin A transcripts were amplified in the
same reaction to normalize for variance in input RNA.
mRNA expression levels relative to cyclophilin A
were calculated by the 2-ΔCt method. All tests were
performed in duplicate. A negative control, RNA
amplification without previous retrotranscription,
was done to test for possible genomic DNA
contamination.
Statistical analysis
Normality of continuous variables was checked
by means of the Kolmogorov-Smirnov test.
Continuous variables are summarized as mean ± SD.
Discrete variables are presented as frequencies and
percentages. Comparison between the results of the
different groups was made with the analysis of
variance (ANOVA) and chi-square test for continuous
and categorical data, respectively. The post hoc
analysis was done with the Bonferroni test. Logistic
regression models were used in order to identify
independent factors (Odds ratio [OR]; 95%
Confidence Interval) for CAD in patients with DM2
associated with SREBP-1 and SREBP-2 expression, as
well as to control for confounding factors. Statistical
analyses were performed with SPSS for Windows
version 15 (SPSS Inc. Chicago, IL, USA). Values were
considered to be statistically significant when P<0.05.
Results
General characteristics of the patients
Among the 49 patients with CAD in our study
cohort, 53.1% (n=26) had DM2 (CAD-DM2 group).
Table 1 lists clinical and biochemical differences
between patients with CAD according to diabetes
status and Control group. Patients with CAD and
DM2 were more likely to have hypertension and
dyslipidemia, higher levels of glucose, HbA1c, total
and LDL cholesterol, triglycerides and C-reactive
protein, and lower HDL-cholesterol levels than those
without DM2 and controls. Angiotensin converting
enzyme inhibitors/Angiotensin II receptor blockers
were more often used in CAD-DM2 and Control
group, and Aspirin and Statins in CAD patients with
and without DM2.
Table 1. Clinical and biochemical characteristics of patients with coronary artery disease according to diabetes status and control group.
Variables N (%)
Age, years
Male gender
Smoking
Body mass index, kg/m2
Obesity
Hypertension
Dyslipidemia
Cerebrovascular disease
Left ventricular ejection fraction, %
Left ventricular ejection fraction ≤40%
Medications
Aspirin
Statins
ACEI/ARB
Beta-blocker
Biochemical data
Glucose, mg/dL
HbA1c, %
Total cholesterol, mg/dL
LDL cholesterol, mg/dL
HDL cholesterol, mg/dL
Triglycerides, mg/dL
Creatinine, mg/dL
Uric acid, mg/dL
GOT, IU/L
GPT, IU/L
CAD-DM2 (n=26)
64.4 ± 10.2
20 (76.9%)
18 (69.2%)
29 ± 6
14 (53.8%)
23 (88.5%)
21 (80.8%)
2 (7.7%)
55 ± 6
5 (19.2%)
CAD-NDM2 (n=23)
65.1 ± 10.8
17 (73.9%)
16 (69.6%)
28.4 ± 5
11 (47.8%)
18 (78.3%)
18 (78.3%)
1 (4.3%)
53 ± 6
4 (17.4%)
p value*
0.225
0.245
0.344
0.102
0.127
0.203
0.121
0.141
0.288
0.199
CONTROL (n=23)
62 ± 10
15 (65.2%)
12 (52.2%)
27.8 ± 4.1
10 (43.4%)
17 (74%)
16 (69.6%)
2 (8.7%)
52 ± 6
4 (17.4%)
p value**
0.201
0.09
0.06
0.101
0.08
0.333
0.08
0.119
0.288
0.201
p value***
0.187
0.100
0.07
0.124
0.114
0.533
0.09
0.09
0.601
0.249
p value
0.204
0.166
0.07
0.113
0.144
0.293
0.09
0.186
0.257
0.209
23 (88.5%)
20 (76.9%)
23 (88.5%)
21 (80.8%)
20 (87%)
17 (73.9%)
16 (69.6)
19 (82.6)
0.185
0.108
0.04
0.201
8 (34.8%)
15 (65.2%)
19 (82.6%)
18 (78.3%)
0.01
0.06
0.107
0.113
0.01
0.09
0.04
0.101
0.02
0.09
0.03
0.155
151 ± 38
7.9 ± 1
189 ± 31
122 ± 26
30 ± 6
203 ± 60
1.14 ± 0.51
5.4 ± 2
32.8 ± 21
40.1 ± 35
108 ± 33
5.8 ± 0.5
159 ± 28
100 ± 20
49 ± 9
157 ± 42
1.17 ± 0.76
6.1 ± 2.1
29.3 ± 27
37 ±29
0.01
0.01
0.02
0.04
0.03
0.03
0.244
0.141
0.218
0.109
103 ± 29
5.5 ± 0.5
160 ± 30
103 ± 21
44 ± 9
148 ± 40
1 ± 0.32
6.2 ± 2.2
34 ± 28
42.7 ± 34
0.01
0.01
0.02
0.04
0.02
0.03
0.277
0.219
0.111
0.241
0.217
0.188
0.201
0.199
0.214
0.108
0.199
0.109
0.221
0.247
0.02
0.01
0.01
0.04
0.03
0.03
0.281
0.207
0.281
0.194
Int. J. Med. Sci. 2017, Vol. 14
GGT, IU/L
CRP, mg/dL
Calcium, mg/dL
Potassium, mmol/L
Sodium, mmol/L
271
60 ± 33
51.6 ± 41
8.5 ± 0.7
4.3 ± 0.5
138 ± 3.6
58.3 ± 31
31.3 ± 30
8.6 ± 0.7
4 ± 0.5
137 ± 3
0.285
0.03
0.334
0.311
0.321
67.7 ± 32
19.2 ± 22
8.9 ± 0.8
4.1 ± 0.5
139 ± 3.7
0.189
0.01
0.147
0.213
0.244
0.112
0.02
0.218
0.201
0.299
0.188
0.02
0.222
0.218
0.274
Values are shown as mean ± SD and frequencies (percentages). Comparison between the results of the different groups was made with the analysis of variance (ANOVA) and chi-square
test for continuous and categorical data, respectively. The post hoc analysis was done with the Bonferroni test. Values were considered to be statistically significant when P<0.05.
p value: overall comparison for all groups. p value*: CAD-DM2 vs CAD-NDM2 comparison. p value** CAD-DM2 vs CONTROL comparison. p value*** CAD-NDM2 vs CONTROL
comparison.
ACEI: Angiotensin Converting Enzyme Inhibitor; ARB: Antiotensin II Receptro Blocker; CAD-DM2: Coronary Artery Disease-Type2-Diabetes Mellitus; CAD-NDM2: Coronary Artery
Disease-Non Type2-Diabetes Mellitus; CRP: C-Reactive Protein; GGT: Gamma-Glutamyl Transferase; GOT: Glutamic-Oxolacetic Transaminase; GPT: Glutamate-Piruvate Transaminase;
Hb1ac: glycated hemoglobin; HDL: High-Density Lipoprotein; IU/L: international units/liter; kg/m2: kilogram/square metre; LDL: Low-Density Lipoprotein; mg/dL:
milligram/deciliter; mmol/L: milimol/liter.
Table 2. Coronary artery disease characteristics grouped by
diabetes status.
Variable
N (%)
Multivessel coronary disease
>50% stenosis left main artery
>50% stenosis anterior descending artery
>50% stenosis circumflex artery
>50% stenosis right coronary artery
CAD-DM2
(n=26)
20 (76.9%)
17 (65.4%)
24 (92.3%)
19 (73%)
20 (76.9%)
CAD-NDM2
(n=23)
14 (61%)
11 (48%)
17 (74%)
14 (60.9%)
15 (65.2%)
p value
and DM2 when compared with patients without DM2
and controls (Table 4). The coefficient of
determinations for this model was 0.60. Other clinical
and biochemical variables were not significant.
0.02
0.01
0.01
0.02
0.02
Values are shown as frequencies (percentages). Comparison between the results of the
different groups was made with chi-square test. Values were considered to be statistically
significant when P<0.05.
CAD-DM2: Coronary Artery Disease-Type2-Diabetes Mellitus; CAD-NDM2: Coronary
Artery Disease-Non Type2-Diabetes Mellitus.
Patients of CAD-DM2 group were more likely to
present multivessel coronary disease and major
coronary stenosis (Table 2).
SREBP mRNA expression in EAT and
comparison between CAD-DM2, CAD-NDM2
and Control group
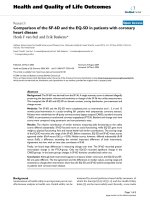
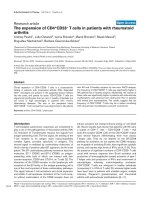
SREBP-1 and SREBP-2 mRNA in EAT were
significantly higher in patients with CAD and DM2
compared with CAD-NDM2 (p<0.001) and control
patients (p<0.001). No SREBP expression differences
were found between CAD-NDM2 and Control group
(Figure 1).
Association between SREBP mRNA
expression in EAT and biochemical and clinical
variables according to diabetes status
Cardiovascular risk factors, such as the presence
of hypertension and dyslipidemia; biochemical
parameters, such as glucose, Hb1ac, triglycerides,
total, LDL and HDL cholesterol; and SREBP-1 and
SREBP-2 mRNA expression, were identified as
independent factors for CAD in patients with DM2.
These results are presented in Table 3. The coefficient
of determination for this regression model was 0.66.
In addition, both SREBP-1 and SREBP-2 expression
were independently associated with the presence of
multivessel coronary disease, left main artery and
anterior descending artery stenosis, and higher
triglycerides, total and LDL cholesterol levels, and
lower HDL cholesterol levels, in patients with CAD
Figure 1. SREBP-1 (A) and SREBP-2 (B) mRNA expression in EAT comparison
between groups. CAD: coronary artery disease; DM2: type-2 diabetes mellitus;
EAT: epicardial adipose tissue; SREBP: Sterol Regulatory Element-Binding
Protein
Int. J. Med. Sci. 2017, Vol. 14
272
Table 3. Factors for coronary artery disease in patients with
type-2 diabetes mellitus.
Variable
Hypertension
Dyslipidemia
Glucose, mg/dL
Hb1ac, %
Total cholesterol, mg/dL
LDL cholesterol, mg/dL
HDL cholesterol, mg/dL
Triglycerides, mg/dL
SREBP-1 expression, RU
SREBP-2 expression, RU
OR (95% CI)
2.3 (1.5-4.1)
3.4 (1.7-5.4)
4.4 (1.8-5.8)
4.7 (1.8-6.2)
3 (1.3-4.9)
2.6 (1.7-4.6)
2.8 (1.4-5)
1.9 (1.1-3.5)
1.7 (1.1-2.5)
1.6 (1.2-3)
p value
0.02
<0.01
0.002
<0.001
0.02
0.02
0.02
0.03
0.02
0.02
B coefficient
0.541
0.688
0.718
0.722
0.587
0.581
-0.499
0.551
0.518
0.509
OR (95% CI) and B coefficient are shown.
Logistic regression analysis for CAD in patients with DM2. Values were considered to be
statistically significant when P<0.05.
95% CI: 95% Confidence Interval; Hb1ac: glycated hemoglobin; HDL: High-Density
Lipoprotein; LDL: Low-Density Lipoprotein; mg/dL: milligram/deciliter; OR: Odds
Ratio; RU: Relative Units, SREBP: Sterol Regulatory Expression Binding Protein
Table 4. Factors associated with SREBP-1 and SREBP-2
expression in patients with coronary artery disease and diabetes
mellitus.
SREBP-1 expression, RU
Multivessel coronary disease
Left main artery stenosis
Anterior descending artery stenosis
Total cholesterol, mg/dL
LDL cholesterol, mg/dL
HDL cholesterol, mg/dL
Triglycerides, mg/dL
SREBP-2 expression, RU
Multivessel coronary disease
Left main artery stenosis
Anterior descending artery stenosis
Total cholesterol, mg/dL
LDL cholesterol, mg/dL
HDL cholesterol, mg/dL
Triglycerides, mg/dL
OR (95% CI)
p value
B coefficient
1.6 (1.2-3.8)
1.3 (1.1-3.4)
1.3 (1.1-3.8)
1.8 (1.2-4.7)
1.6 (1.2-3.6)
1.8 (1.3-4.2)
2.8 (1.2-4.5)
0.03
0.04
0.04
0.03
0.03
0.03
0.02
0.487
0.458
0.438
0.517
0.521
-0.499
0.561
1.3 (1.1-3.4)
1.2 (1.1-3.5)
1.3 (1.1-3.6)
2.1 (1.3-4.6)
2.6 (1.5-4.9)
2.5 (1.3-4.7)
1.4 (1.1-4.6)
0.04
0.04
0.04
<0.01
<0.01
<0.01
0.04
0.431
0.437
0.444
0.576
0.601
-0.576
0.461
OR (95% CI) and B coefficient are shown.
Logistic regression analysis for SREBP expression in patients with coronary artery disease
and type2-diabetes mellitus when compared with patients without type2-diabetes mellitus
and control group. Values were considered to be statistically significant when P<0.05.
95% CI: 95% Confidence Interval; HDL: High-Density Lipoprotein; LDL: Low-Density
Lipoprotein; mg/dL: milligram/deciliter; OR: Odds Ratio; RU: Relative Units, SREBP:
Sterol Regulatory Expression Binding Protein
Discussion
Our study found that SREBP genes are expressed
in EAT and this expression was significantly higher in
patients with CAD and DM2. Hypertension,
dyslipidemia
(high
triglycerides,
total
and
LDL-cholesterol and low HDL cholesterol levels),
diabetes status (high fasting glucose and Hb1ac
levels) and SREBP-1 and SREBP-2 mRNA levels were
associated as cardiovascular risk factor for CAD in
patients with DM2. Moreover, SREBP expression in
EAT was independently associated with the severity
of CAD (presence of multivessel coronary disease,
and left main artery and anterior descending artery
stenosis) and poor lipid control (high levels
triglycerides, total and LDL cholesterol and low HDL
cholesterol) in patients with DM2.
These findings are important because the
expression of SREBP genes had not been previously
describe in EAT. This study is also important because
it adds to the relatively limited number of studies that
have explored the role of this tissue in the lipid
metabolism, and subsequently, in coronary
atherosclerosis and cardiovascular disease. In
addition, this study is unique focused on SREBPs
expression, crucial genes involved in lipogenesis,
adipocyte development and cholesterol homeostasis,
in patients with CAD separated by DM status and
associated with clinical and biochemical variables.
Several studies have shown that EAT is
associated with the development and progression of
coronary atherosclerosis, mainly through a
dysbalance of pro/anti-inflammatory adipokines
production in pathological conditions, as diabetes
status, speculating about the cardiovascular
implication of EAT in the DM2 [6-8]. Even, EAT has
been proposed to participate in the heart energy
homeostasis [9-11] and, an increase volume of this
tissue has been demonstrated to be correlated with the
extent and severity of CAD [8,11,12]. However, a
functional EAT would play a protector role over the
myocardium or coronary arteries in healthy humans
[13].
Although studies have shown that the
dysregulation of lipid homeostasis is closely
associated with DM2 and cardiovascular disease, the
molecular mechanism and regulation of lipid
homeostasis is extremely complicated and poorly
understood. Additionally, a lot of genes and different
types of tissues involved in this process still remain to
be discovered [14,15].
As our results, prior studies have investigated
the association between the expression of SREBP and
other genes in different tissues, mainly in liver and
adipose tissue, and cardiovascular diseases [16-8].
SREBPs overexpression has been implicated with
insulin resistance, carbohydrate and lipid metabolism,
and has been incriminated in the development of
human metabolic physiopathology such as obesity,
DM2, atherosclerosis, increased fatty acid secretion,
and metabolic syndrome [19-21]. Even, in an extensive
study performed by Marfella et al [22], was evidenced
a significant correlation between myocardium SREBP
expression and myocyte lipid accumulation in
patients with metabolic syndrome what might
contribute to heart dysfunction. Similarly to previous
reports, in the present study, lipid parameters were
associated with the expression of SREBPs,
contributing to the high cardiovascular risk, although
this expression was explored in different tissue.
Int. J. Med. Sci. 2017, Vol. 14
It is well known that CAD is the result of
complex interactions among genetic, metabolic, and
environmental risk factors. As regulators of
cholesterol biosynthesis, SREBPs have been proven to
be associated with CAD, helping in dissecting the
molecular pathophysiology of CAD. In our study, in
accordance with the results obtained in other studies
[23-5], we found association between SREBPs
expression and extent of coronary lesions. In this line,
Karasawa et al [26] also showed that the
overexpression of SREBP accelerated aortic atheroma
formation and Friedlander et al [17] found an
association between SREBP and the risk of myocardial
infarction in among men. Another study, published
by Robinet et al [27], related SREBP with early-stage
carotid atherosclerosis in subjects with a risk of
cardiovascular event but without detectable change in
plasma lipid levels. So, these findings support a role
of SREBPs in the development of cardiovascular
disease.
Given the role of SREBPs as regulators of
essential lipid homeostasis, their expression in
different tissues but specifically in EAT and their
clinical implication should be deeply characterized as
an important first step for future studies. In addition,
the knowledge in this field could have therapeutic
implications. Regulation of SREBP overexpression
could be a promising way of treating cardiovascular
diseases, specialty in patients with CAD and DM2.
This preliminary study is limited by the small
number of recruited patients and because our data are
from a single hospital. In addition, only small EAT
biopsy samples were taken, being insufficient for a
proteins determination. However, our study
preserves its validity because it benefits from a
well-designed study protocol and has been carried
out using well-stablished methods. The hypothesis
that EAT SREBPs expression was involved in CAD in
patients with DM2 as a cardiovascular risk factor and
its association with clinical variables and lipid
parameters would need to be confirmed in further
research.
273
Acknowledgments
The authors thank the Cardiovascular Surgery
Department of the Virgen de la Victoria Hospital of
Malaga for their contribution in collecting samples.
We are also grateful to Alicia Guerrero for her
technical assistance.
This work was supported by grants from the
Spanish Ministry of Health (FIS) (PI13/02542,
PI11/01661) and Spanish Cardiovascular Research
Network (RD12/0042/0030)/CIBERCV Enfermedades Cardiovasculares co-founded by Fondo Europeo
de Desarrollo Regional (FEDER). Dr. Luis M.
Pérez-Belmonte has the “Contrato Post-MIR Jordi
Soler” from Spanish Cardiovascular Research
Network (RD12/0042/0030)/CIBERCV Enfermedades Cardiovasculares.
Competing Interests
The authors have declared that no competing
interest exists.
References
1.
2.
3.
4.
5.
6.
7.
8.
9.
10.
11.
Conclusions
12.
SREBP-1 and SREBP-2 genes are expressed in
EAT. This expression was significantly higher in CAD
patients with DM2 than in those without DM2, and it
was associated as cardiovascular risk factor for the
severity of CAD and the poor lipid control. These
preliminary findings suggest the importance of EAT
and the SREBP expression in this tissue for the
cardiovascular homeostasis, and subsequently, for
coronary atherosclerosis of patients with DM2 and
highlight a future novel therapeutic target.
13.
14.
15.
16.
17.
18.
Goldstein JL, DeBose-Boyd RA, Brown MS. Protein sensors for membrane
sterols. Cell. 2006; 124: 35-46.
Brown MS, Goldstein JL. The SREBP pathway: regulation of cholesterol
metabolism by proteolysis of a membrane-bound transcription factor. Cell.
1997; 89: 331-40.
Brown MS, Goldstein JL. A proteolytic pathway that controls the cholesterol
content of membranes, cells, and blood. Proc Natl Acad Sci USA. 1999; 96:
11041-8.
Sato R. Sterol metabolism and SREBP activation. Arch Biochem Biophys. 2010;
501: 177-81.
Iacobellis G, Corradi D, Sharma AM. Epicardial adipose tissue: anatomic,
biomolecular and clinical relationships with the heart. Nat Clin Pract
Cardiovasc Med. 2005; 2: 536-43.
Berry C, Tardif JC, Bourassa MG. Coronary heart disease in patients with
diabetes: part I: recent advances in prevention and noninvasive management. J
Am Coll Cardiol. 2007; 49: 631-42.
Baker AR, Silva NF, Quinn DW, et al. Human epicardial adipose tissue
expresses a pathogenic profile of adipocytokines in patients with
cardiovascular disease. Cardiovasc Diabetol. 2006; 5: 1.
Shimabukuro M, Hirata Y, Tabata M, et al. Epicardial adipose tissue volume
and adipocytokine imbalance are strongly linked to human coronary
atherosclerosis. Arterioscler Thromb Vasc Biol. 2013; 33: 1077-84.
Marchington JM, Pond CM. Site-specific properties of pericardial and
epicardial adipose tissue: the effects of insulin and high-fat feeding on
lipogenesis and the incorporation of fatty acids in vitro. Int J Obes. 1990; 14:
1013-22.
Iozzo P. Myocardial, perivascular, and epicardial fat. Diabetes care. 2011; 34:
371-9.
Yerramasu A, Dey D, Venuraju S, et al. Increased volume of epicardial fat is an
independent risk factor for accelerated progression of sub-clinical coronary
atherosclerosis. Atherosclerosis. 2012; 220: 223-30.
Ahn SG, Lim HS, Joe DY, et al. Relationship of epicardial adipose tissue by
echocardiography to coronary artery disease. Heart. 2008; 94: e7.
Chang L, Villacorta L, Li R, et al. Loss of perivascular adipose tissue on
peroxisome proliferator-activated receptor-gamma deletion in smooth muscle
cells impairs intravascular thermoregulation and enhances atherosclerosis.
Circulation. 2012; 126: 1067-78.
Bornfeldt KE, Tabas I. Insulin resistance, hyperglycemia, and atherosclerosis.
Cell Metab. 2011; 14: 575-85.
Reaven GM. Insulin resistance: the link between obesity and cardiovascular
disease. Med Clin North Am. 2011; 95: 875–92.
Jump DB. Fatty acid regulation of gene transcription. Crit Rev Clin Lab Sci.
2004; 41: 41-78.
Friedlander Y, Schwartz SM, Durst R, Meiner V, Robertson AS, et al. SREBP-2
and SCAP isoforms and risk of early onset myocardial infarction.
Atherosclerosis. 2008; 196: 896-904.
Biddinger SB, Almind K, Miyazaki M, et al. Effects of diet and genetic
background on sterol regulatory element-binding protein-1c, stearoyl-CoA
desaturase 1, and the development of the metabolic syndrome. Diabetes. 2005;
54: 1314–23.
Int. J. Med. Sci. 2017, Vol. 14
274
19. Horton JD, Shimomura I, Ikemoto S, et al. Overexpression of sterol regulatory
element binding protein-1a in mouse adipose tissue produces adipocyte
hypertrophy, increased fatty acid secretion, and fatty liver. J Biol Chem. 2003;
278: 36652-60.
20. Kolehmainen M, Vidal H, Alhava E, et al. Sterol regulatory element binding
protein 1c (SREBP-1c) expression in human obesity. Obes Res. 2001; 9: 706-12.
21. Oberkofler H, Fukushima N, Esterbauer H, et al. Sterol regulatory element
binding proteins: relationship of adipose tissue gene expression with obesity
in humans. Biochim Biophys Acta. 2002; 1575: 75–81.
22. Marfella R, Di Filippo C, Portoghese M, et al. Myocardial lipid accumulation in
patients with pressure-overloaded heart and metabolic syndrome. J Lipid Res.
2009; 50: 2314-23.
23. Duan X, Zhu W, Li Y, et al. The effect of sterol regulatory element-binding
protein 2 polymorphism on the serum lipid in northern Chinese subjects. J
Lipid Res. 2005; 46: 252-7.
24. Fan YM, Karhunen PJ, Levula M, et al. Expression of sterol regulatory
element-binding transcription factor (SREBF) 2 and SREBF cleavage-activating
protein (SCAP) in human atheroma and the association of their allelic variants
with sudden cardiac death. Thromb J. 2008; 6: 17.
25. Zhao X, Feng D, Wang Q, et al. Regulation of lipogenesis by cyclin-dependent
kinase 8-mediatedcontrol of SREBP-1. J Clin Invest. 2012; 122: 2417-27.
26. Karasawa T, Takahashi A, Saito R, et al. Sterol regulatory element-binding
protein-1 determines plasma remnant lipoproteins and accelerates
atherosclerosis in low-density lipoprotein receptor deficient mice. Arterioscler
Thromb Vasc Biol. 2011; 31: 1788–95.
27. Robinet P, Védie B, Chironi G, et al. Characterization of polymorphic structure
of SREBP-2 gene: role in atherosclerosis. Atherosclerosis. 2003; 168: 381-7.