Influence of microalgae retention time on biomass production in membrane photobioreactor using human urine as substrate
Bạn đang xem bản rút gọn của tài liệu. Xem và tải ngay bản đầy đủ của tài liệu tại đây (1.1 MB, 5 trang )
Life Sciences | Biotechnology
Doi: 10.31276/VJSTE.60(4).66-70
Influence of microalgae retention time on biomass
production in membrane photobioreactor using
human urine as substrate
Nguyen Van Thuan1, Ngo Thi Thanh Thuy1, Nguyen Hong Hai1,
Nguyen Cong Nguyen2 & Xuan-Thanh Bui 1*
Faculty of Environment & Natural Resources, Ho Chi Minh city University of Technology
2
Faculty of Environment and Natural Resources, Da Lat University
1
Received 15 August 2018; accepted 31 October 2018
Abstract:
Introduction
Human urine is known as the excreta with a high
concentration of nitrogen and phosphorus, causing
eutrophication in water bodies. In this study, human
urine was used to feed microalgae (Chlorella vulgaris)
in a membrane photobioreactor (MPBR) at various
microalgae retention times (MRTs) and hydraulic
retention time (HRT) of 2 days to evaluate its biomass
production. The results indicate that MPBR was
operated under MRT of 2 to 5 days and HRT of 2 days,
which performed the optimum condition with biomass
productivity from 146.43±8.52 to 151.93±15.05 mg.l-1.day.
Moreover, the MPBR using the urine as a nutrient
source demonstrated the high performance in biomass
production and strong growth of microalgae.
Domestic wastewater has negatively affected the aquatic
environment when human urine is discharged directly into the
environment without sufficient treatment, thereby causing
eutrophication. Urine contains a high concentration of
nutrients (mostly nitrogen and phosphorus); it can therefore
be used as a liquid fertilizer or even as a slowly soluble
fertilizer (in the form of struvite - MgNH4PO4.6H2O) [1].
Additionally, it offers a high potential to cultivate microalgae
for nutrient recovery. Microalgae biomass production is a
potential source of feedstock for the bio-based production
of biochemicals, biofuels, fertilizer, feed for cattle, food
for health, and cosmetics for humans [2]. In addition,
many types of wastewaters from agricultural, industrial,
synthetic, and municipal activities which have been used for
microalgae cultivation coupling with wastewater treatment
is regarded as a more economical and sustainable option [3,
4]. Human urine contains about 80% of the nitrogen loading
in wastewater; therefore, separating urine at the source to
cultivate microalgae can help to improve effluent quality,
save energy consumption, and recover the investment cost
of the wastewater treatment plant [1].
Keywords: biomass production, human urine, membrane
photobioreactor, microalgae, nutrient removal.
Classification number: 3.5
The cultivation of microalgae using wastewater in
photobioreactors is a novel, prospective, and sustainable
method to remove contaminants (mostly nutrients) from
wastewater and simultaneously produce useful microalgae
biomass. Significant effort has been dedicated to developing
the performance and cost-effectiveness of microalgae
cultivation systems. The pilot scale or commercial cultivation
system are often based on open ponds technology. However,
this pond technology presents many disadvantages, such
as water evaporation, extensive space requirements,
contamination of algal cultures, and lack of control over
operating parameters [5, 6]. To overcome these issues with
open pond technology, the photobioreactor (PBR) has been
designed to tackle these drawbacks [4]. However, PBRs
present additional challenges, such as poor settling ability,
biomass washout, and harvesting limitations [7]. Therefore,
*Corresponding author: Email:
66
Vietnam Journal of Science,
Technology and Engineering
September 2018 • Vol.60 Number 3
Life Sciences | Biotechnology
the microalgae cultivation system has been improved by
combining it with membrane separation in PBR, rendering
it the membrane photobioreactor (MPBR). The advantages
of MPBR relative to PBR included decoupling the hydraulic
retention time (HRT) and microalgae retention time (MRT),
preventing biomass washout, higher biomass production,
enhanced nutrient removal efficiency, and reduced land
requirement, which contributed to a decrease in construction
and operation costs.
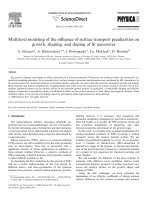
(2). The permeate was intermittently withdrawn in a cycle
(8 min of operation and 2 min idle) by a suction pump. A
digital pressure gauge (13) was installed on a pipe connected
with a permeate pump (Fig. 1).
13
There was minimal available knowledge regarding
microalgae cultivation by using human urine as a substrate
incorporated with a membrane photobioreactor [2]. In
14
several previous studies, synthetic or real urine was
applied as a nutrient medium for microalgae growth [2,
8, 9]. However, ammonia production, high pH, and keyelement precipitation that occurred during urea hydrolysis
in concentrated urine would produce microalgae growth
difficulties and render nutrient recovery ineffective [9].
In fact, Jaatinen, et al. (2016) reported that 1:25-diluted
10
urine could be used for microalgae biomass production [8].
In addition, Chlorella vulgaris was known to be easy to
cultivate in an inexpensive nutrient medium and exhibited
a fast growth rate and a high biomass productivity [10].1: feed tank; 2: feed pump; 3: photobioeactor; 4: compressed CO cylinder; 5: air blower; 6: valve; 7-9: rotame
2
feed tank;
2: feed lamp;
pump;
3: photobioeactor;
4: pressure
compressed
At HRT of 2 days, microalgae concentration and biomass10: air1:distributor;
11: fluorescent
12: membrane
module; 13: digital
gauge; 14: permeate pump.
cylinder;diagram
5: air of
blower;
6: membrane
valve; 7-9:photobioreactor.
rotameters; 10: air
productivity of MPBR achieved 3.5-fold and 2-fold higherFig. CO
1. Schematic
lab-scale
2
compared to those of PBR respectively [11]. Therefore, the distributor; 11: fluorescent lamp; 12: membrane module; 13:
digital pressure gauge; 14: permeate pump.
first time that Chlorella vulgaris was grown in the MPBR Microalgae retention time (MRT, day) was calculated by the following expression [11]:
Fig. 1.V Schematic diagram of lab-scale membrane
system with diluted human urine as nutrients source in this MRT
Fretentate
study, the reactor was operated under conditions in which photobioreactor.
HRT was fixed at 2 days, and the MRT was variable. Thiswhere V was volume of reactor (l), and Fretentate was daily volume of wasted retentate (l/day).
Microalgae
retention
time
(MRT,
day) was
the optimum
MRT,
MPBR
was operated
in calculated
four phases at MRTs changing fr
study aims to investigate the effect of various microalgae To determine
by(during
the following
[11]:18 to day 113), to 3 days (between day 114 and
5 days
operation expression
period from day
retention times (MRTs) on algae biomass production.
175), to 2 days (between day 176 and day 190) and 1.5 days (from day 191 to day 218) and
V
discharged
biomass
MRT
= amounts were 1.6, 2.67, 4.0, and 5.3 l/day, respectively. However,
F
reactor was operatedretentate
in during the start-up time (from day 0 to day 17) to achieve a sufficie
Membrane photobioreactor structure
high initial microalgae concentration. While MRT was changed in turn, HRT was controlled
V was MRTs.
volume
of(day)
reactor
(l), and
was expression
daily
dayswhere
for all operated
HRT
was defined
by Fthe
following
[11]:
retentate
The MPBR system was installed in a wooden box with volume of wasted retentate (l/day).
V
a thickness of 10 mm to prevent temperature change. It HRT
was then continuously illuminated with four 18 W white
ToFindetermine the optimum MRT, MPBR was operated
where
F
was
influent
flowrate
(l/day).
in
1: feed
tank;
2: feed pump;
3: photobioeactor;
4: compressed CO2 cylinder; 5: air blower; 6: valve; 7-9: rota
fluorescent lamps (11), and the intensity of the lighting
Materials and methods
in10: four
phases at MRTs changing from 5 days (during
air distributor; 11: fluorescent lamp; 12: membrane module; 13: digital pressure gauge; 14: permeate pum
was 4.4 kLux. MPBR (3) was made from transparent operation
period
from ofday
to daystrain
113),
to 3 days
Fig.wastewater
1. Schematic
diagram
lab-scale
membrane
photobioreactor.
Feed
characteristics
and 18
microalgae
acrylic and designed with an internal diameter of 100 mm Chlorella
vulgaris
was and
used day
in this
studytoprovided
The Research
Institute for Aquacul
(between
day 114
175),
2 days by
(between
day 176
and 1200 mm in height; the working volume was 8 l. ANo. 2, HoMicroalgae
retention
time (MRT,
day) was
calculated
by mg/l.
the following expression [11]:
Chi Minh
city,
Vietnam
with(from
initial
dry weight
of day
36
and day
190)
and
1.5
days
day
191
to
218)
and
V
hollow fiber membrane module (12), which was made from Fresh MRT
human
was collected from male toilet in Ho Chi Minh city University
urine biomass
the discharged
amounts were 1.6, 2.67, 4.0, and
o
polyvinylidene fluoride (PVDF) (Mitsubishi, Japan) andTechnology
and Fstored
retentate at 4 C in a refrigerator to reduce the effect of urea hydrolysis before u
5.3
l/day,
respectively.
However,
the and
reactor
operated
urine was
diluted
with
in
feed
tank. retentate
The diluted
u
wascontained
dailywas
volume
of wasted
(l/day
V was
volume30oftimes
reactor
(l), tap
and water
Fretentate
had a pore size of 0.4 µm with a membrane area of 0.035Then where
3+
2
To
determine
the
optimum
MRT,
MPBR
was
operated
in
four
phases
at6-12
MRTs
changing
contained
PO
P
of
4-8
mg/l,
total
phosphorus
(TP)
of
8-15
mg/l,
NH
mg/l
and t
in
during
the
start-up
time
(from
day
0
to
day
17)
to
achieve
4
4 -N of
m ; it was submerged in the reactor.
days
(during
operation
periodmicroalgae
from day 18 concentration.
to day 113), to 3 days
(between day 114 an
Kjeldahl
nitrogen
(TKN)
180-350
mg/l.
a5sufficiently
highof initial
While
Operating conditions of the MPBR system
175), to 2 days (between day 176 and day 190) and 1.5 days (from day 191 to day 218) a
Analysis
MRT
was changed
in turn,were
HRT1.6,
was
controlled
days respectively.
for
discharged
biomass amounts
2.67,
4.0, and at
5.32 l/day,
Howeve
The flow rates of CO2 (4) and air (5) mixture, which all
reactor
was operated
during(day)
the start-up
time (from
to day 17) to achieve a suffic
operated
MRTs.inHRT
was defined
byday
the0following
were 0.1 l/min and 4.0 l/min respectively, were injected into
high initial microalgae concentration. While
Page MRT
3/9 was changed in turn, HRT was controlle
expression
[11]:
days for all operated MRTs. HRT (day) was defined by the following expression [11]:
the MPBR via a 20 mm-diameter air diffuser installed at the
V
bottom of the reactor.
HRT
The diluted human urine (30 times) was pumped from
the feed tank (1) into the MPBR by an automatic feed pump
Fin
where Fin was influent flowrate (l/day).
where Fin was influent flowrate (l/day).
Feed wastewater characteristics and microalgae strain
Chlorella vulgaris was used in this study provided by The Research Institute for Aquac
No. 2, Ho Chi Minh city, Vietnam with initial dry weight of 36 mg/l.
Fresh human urine was collected
from
maleoftoilet
Vietnam
Journal
Science,in Ho Chi Minh city Univers
SeptemberTechnology
2018 • Vol.60
Number
of urea hydrolysis befor
and stored
at 4oC3in a refrigerator to reduce the effect 67
Technology and Engineering
Then urine was diluted 30 times with tap water and contained in feed tank. The diluted
contained PO43-P of 4-8 mg/l, total phosphorus (TP) of 8-15 mg/l, NH4+-N of 6-12 mg/l an
Kjeldahl nitrogen (TKN) of 180-350 mg/l.
0 210 220 230
Feed wastewater characteristics and microalgae strain
Chlorella vulgaris was used in this study provided by The
Research Institute for Aquaculture No. 2, Ho Chi Minh city,
Vietnam with initial dry weight of 36 mg/l.
Fresh human urine was collected from male toilet in Ho
Chi Minh city University of Technology and stored at 4oC in a
refrigerator to reduce the effect of urea hydrolysis before use.
Then urine was diluted 30 times with tap water and contained
in feed tank. The diluted urine contained PO43-P of 4-8 mg/l,
total phosphorus (TP) of 8-15 mg/l, NH4+-N of 6-12 mg/l and
total Kjeldahl nitrogen (TKN) of 180-350 mg/l.
Analysis
Daily, 200-ml samples were taken from influent and
permeate for analysis. In addition, 50-ml samples of
mixed liquor suspended solids (MLSS) were taken from
middle of MPBR to measure biomass concentration [10].
MLSS was measured using a Whatman glass fiber filter
membrane and then drying biomass after filtering until
a constant weight was reached at 105°C [12]. The water
quality parameters including TKN, TP, nitrite, nitrogen
(NO2-˗N), nitrate nitrogen (NO3-˗N), and biomass concentration
were analysed, following the Standard Method for The
Examination of Wastewater [12]. pH was measured using a pH
meter (HANA, USA).
Biomass productivity (P, mg.l-1.day) was calculated based
on the following expression [11]:
D
HRT X MPBR
1
= X MPBR ×
×
=
ν
HRT MRT
MRT
where, XMPBR was biomass concentration in MPBR (mg/l), D
was dilution rate (day-1), and υ was dilution factor.
35
30
1000
1000
900
900
Start-up
Start-up
25
15
10
5
0
erent MRTs.
Cell density =
number of cell
ml
=
number of cell on a l arge square
volume of a larg e square x dilution rate
Results and discussion
Results and discussion
Figure 2 demonstrates that the variation of Chlorella
Figure biomass
2 demonstrates
that the variation
ofChlorella
vulgaris
biomass concentration in
vulgaris
concentration
in MPBR
operated
at different
MPBR operated
during the
entire of
cultivation
period
218 days.At the startMRTs
during at
thedifferent
entireMRTs
cultivation
period
218 days.
Atofthe
up period,period,
biomass biomass
concentration
achieved 615 achieved
mg/l at day615
.9Based
on the
start-up
concentration
mg/l
at observed results,
there9.was
no lagon
phase
the first 18 days
(start-up
period)
, which
reflected
the results of Gao, et
day
Based
theinobserved
results,
there
was
no lag
phase
inal.the
daysthat
(start-up
period),
reflected
[13].first
This18proved
Chlorella
vulgariswhich
adapted
effectivelythetoresults
human urineas a feeding
ofsubstrate.
Gao, et al. [13]. This proved that Chlorella vulgaris adapted
effectively to human urine as a feeding substrate.
At MRT of 5 days, biomass concentration was maintained
in the range of 540-860 mg/l. This high concentration of
microalgae was achieved through the effect of the submerged
membrane in MPBR, which allowed the reactor to operate under
a longer MRT but a shorter HRT [4]. However, at the initial time
MRT =
=3
3 days
days
MRT
Biomass concentration
concentration
Biomass
Cell density
density
Cell
800
800
MRT =
=
MRT
MRT = 1.5 days
2 days
days MRT = 1.5 days
2
Operational
Operational
problem
problem
700
700
20
MRT =
=5
5 days
days
MRT
method with hemocytometer (Germany). After counting the
microalgae cell via light microscope, cell density is calculated
by the following formula:
30
30
25
25
600
600
20
20
500
500
15
15
400
400
300
300
Page 4/9
200
200
10
10
5
5
100
100
0
0
35
35
Cell
Celldensity
density(×(×10
1066cells/mL)
cells/mL)
P = X MPBR ×
Cell density
(×106 cells/mL)
Biomass
concentration
(mg
Biomass
concentration
(mgLL-1-1))
T = 1.5 days
Life Sciences | Biotechnology
samples of mixed liquor suspended solids (MLSS) were taken from middle of MPBR to measure
biomass concentration [10]. MLSS was measured using a Whatman glass fiber filter membrane
and then drying biomass after filtering until a constant weight wasached
re at 105°C [12]. The
water quality parameters including TKN, TP, nitrite, nitrogen (NO2- N), nitrate nitrogen (NO 3N), and biomass concentration were analysed, following the Standard Method for The
Examination of Wastewater[12]. pH was measured usinga pH meter (HANA, USA) .
Biomass productivity (P, mg/l.day) was calculated based on the following expression [11]:
-1
D loading 1(mg.lHRT
The nutrients
.day)Xand
MPBR food/microorganism
P Xratio
X MPBR were calculated
MPBR of MPBR
(F/M)
HRT MRT MRT using the following
equation
[13]:
where, X MPBR was biomass concentration in MPBR (mg/l), D was dilution rate (day-1), and υ was
C ×Q
dilution factor.
Nutrients loading = inf
The nutrients loading (mg/l.day)
and food/microorganism (F/M) ratio of MPBR were
V
calculated
using
the
following
equation
[13]:
Q × C inf
F
=
M V ×loading
X MPBR C inf Q
Nutrients
V
where, Cinf was the concentration
(mg/l) of TN (or TP) in the
Q
C
F
influent.
inf
M V X MPBR cell density was determined every day by
Microalgae
counting
method
following
Fuchs-Rosenthal
and Burker
where, C inf was
the concentration
(mg/l)
of TN (or TP) in the influent.
0
0
10 20
20 30
30 40
40 50
50 60
60 70
70 80
80 90
90 100
100 110
110 120
120 130
130 140
140 150
150 160
160 170
170 180
180 190
190 200
200 210
210 220
220 230
230
10
0
0
Cultivation (days)
(days)
Cultivation
Fig.
2. Microalgal
Microalgal
growth
curve
and
cell density
density
ofdifferent
Chlorella
vulgaris at
at different
different MRTs.
MRTs.
Fig.Fig.
2. Microalgal
growth curve
and cell
densityand
of Chlorella
vulgaris at
MRTs.vulgaris
2.
growth
curve
cell
of
Chlorella
0-860 mg/l. This
At MRT
MRT of
of 5
5 days,
days, biomass
biomass concentration
concentration was
was maintained
maintained in
in the
the range
range of
of 540-860
540-860 mg/l.
mg/l. This
This
ged membrane in At
high
concentration
of
microalgae
was
achieved
through
the
effect
of
the
submerged
membrane
in
high concentration of microalgae was achieved through the effect of the submerged membrane in
horter HRT [4].
Vietnam
Journal
of
Science,
MPBR,
which
allowed
the
reactor
to
operate
under
a
longer
MRT
but
a
shorter
HRT
[4].
MPBR,
which allowed the
reactor
to• Vol.60
operate
under
rom 560 mg/l68
on
September
2018
Number
3 a longer MRT but a shorter HRT [4].
Technology
Engineering
However,
at and
the
initial time
time of
of this
this MRT,
MRT, biomass
biomass concentration
concentration was
was reduced
reduced from
from 560
560 mg/l
mg/l on
on
However,
at
the
initial
electrical floater)
day
18
to
305
mg/l
on
day
29
due
to
the
operational
problem
(clogging
of
the
electrical
floater)
day 18 to 305 mg/l on day 29 due to the operational problem (clogging of the electrical floater)
mg/l on day 32.
of the
the system.
system. Biomass
Biomass concentration
concentration was
was then
then continuously
continuously increased
increased to
to 540
540 mg/l
mg/l on
on day
day 32.
32.
of
viously described
Life Sciences | Biotechnology
of this MRT, biomass concentration was reduced from 560 mg/l
on day 18 to 305 mg/l on day 29 due to the operational problem
(clogging of the electrical floater) of the system. Biomass
concentration was then continuously increased to 540 mg/l on
day 32. Similarly, on day 32, a biomass washout incident again
occurred due to the previously described operational problem.
Therefore, biomass concentration was again gradually reduced
to 175 mg/l on day 42. From day 46, biomass concentration
was restored and achieved a steady state (800 mg/l) from day
51 onwards. At the steady state of 5-day MRT, the average
biomass productivity was 151.93±15.05 mg.l-1.day (Fig. 3).
Biomass productivity (mg/l.day)
180
Average biomass productivity
160
140
120
100
80
60
40
20
the competition of bacteria and their extracellular polymeric
substance [14] and the intracellular substances was released
by dead algae [8]. Bacteria growth could not cause a ‘shut
down’ of the photobioreactor and the microalgae dominant,
although bacteria, protozoa, and flocs formation occurred in
the MPBR at almost MRTs. Moreover, the influence of bacteria
was effectively prevented by withdrawal of biomass and a
microfiltration membrane module in the photobioreactor.
The longer MRT corresponded with high biomass
concentration (Table 1), which may lead to the rapid removal
of nitrogen [15, 16]. However, the high concentration indicates
low nutrient loading rates or low F/M ratios. In this study, these
ratios were 0.13, 0.22, 0.3, and 1.21 for nitrogen and 0.01,
0.01, 0.02, and 0.04 for phosphorus corresponding with MRT
of 5, 3, 2, and 1.5 days, respectively. Therefore, at MRT of
5 days, MPBR performed the optimum biomass productivity;
the productivity at 2 days was then 136.67±20.34 mg.l-1.day.
Relative to MRT of 2 days, the lower biomass productivity was
achieved at MRT of 3 days due to lower F/M ratio. In contrast
to MRT of 3 days, the lowest microalgae productivity occurred
at 1.5 days because of the overly high F/M ratios. In addition,
light may limit the microalgal growth due to self-shading at
high biomass concentration; therefore, dark respiration of
algae occurs in MPBR [17]. This was not proved in this study.
Based on the observed results, it is clear that the MRT
as short as 1.5 days could cause the biomass productivity to
MRT (days)
decrease significantly due to low algal biomass concentration
retained in the reactor. MRT of lower than 2 days strongly
Fig. 3. Biomass
productivity
of Chlorella
vulgaris
at different
3. Biomass productivity
of Chlorella
vulgaris
at different
MRTs.
affects
the dead
biomass concentration and biomass productivity
MRTs.in MPBR was measured as MLSS. This value included
he biomass growth
living,
of
the
MPBR.
, protozoa and bacteria. However, based on cell counts and microscopic observation, livingIn addition, the suitable MRTs for MPBR in
this study ranged between 2 and 5 days. The average biomass
At dominant
MRT of in3 the
days,
average
biomass
concentration
was observed to be
biomass
mixture
during
the cultivationproductivicty
period, which
ranged between 146.43±8.52 and 151.93±15.05
and
biomass
productivity
reached
410
mg/l
and
6
ed from 0.3×10136.67±20.34
to 28.5×10⁶mg.l
cells/ml
(Fig.
2).
Flocs
formation
of
microalgae
in of 2 to 5 days (Table 1).
-1
-1
.day for MRT
.day, respectively. The system was stable mg.loccurred
R at the beginning
of
the
stationary
phase;
therefore,
the
counting
number
of
algae
was
after several days and operated for 50 days at 3-day MRT.
Table 1. Comparison of performance of MPBRs.
0
5
3
2
1,5
y estimated because flocs formation was occurred in the reactor. The appearance of flocs in
of 2 days, microalgae biomass concentration
Influent
R could be due toAttheMRT
competition
of bacteria and their extracellular polymeric substanceMPBR concentrations
Nutrients loading
Growth of microalgae
achieved a steady state quickly for several days. During 15
and the intracellular
substances
was
released
by
dead
algae
[8].
Bacteria
growth
could
not
References
days of operation, average biomass concentration and biomass
Microalgae
TP
TN
SVR
TN
TP
MLSS
e a ‘shut down’productivity
of the photobioreactor
and the
productivity
were 292.86 mg/l
and microalgae
146.43±8.52 dominant,
mg.l-1.day, although bacteria,
(m )
(mg N/l) (mg P/l) (mgN.l .day) (mgP.l .day) (mg/l)
(mg.l .day)
zoa, and flocs formation
respectively.occurred in the MPBR at almost MRTs. Moreover, the influence
5-day MRT (this study)
5.13
759
151.93±15.05
cteria was effectively
prevented by withdrawal of biomass and a microfiltration
membrane 200.1 10.2 86.30
When MRT was controlled at MRT of 1.5 days, the
3-day
MRT
(this
study)
410
136.67±20.34
184.0
9.4
92.01
4.70
ule in the photobioreactor.
39.2
biomass concentration began to decrease significantly
2-day MRT
(this study)
6.29
292
146.43±8.52
he longer MRT from
corresponded
biomass
(Table
1), which
may
lead to 176.5 12.5 88.28
310 mg/lwith
(dayhigh
194)
to 80 concentration
mg/l (day 203);
it then
1.5-day
MRT
(this
study)
198.8
9.3
99.44
4.66
82
54.67±7.30
apid removal ofbecame
nitrogen
[15, at16].
indicates low nutrient
steady
thisHowever,
value. At the
thishigh
stage,concentration
average biomass
Marbelia,
et
al.
(2014)
[11]
20.0
7.4
1.6
3.74
0.84
590
27.00
biomass
productivity
achieved
mg/l0.22,
and 0.3, and 1.21 for
ng rates or lowconcentration
F/M ratios. and
In this
study,
these ratios
were 82
0.13,
-1
Gao,
et
al.
(2014)
[3]
32.3
19.1
1.24
8.39
0.56
39.93
54.67±7.30
mg.l0.04
.day,for
respectively.
gen and 0.01, 0.01,
0.02, and
phosphorus corresponding with MRT of 5, 3, 2, and
Gao, et al. (2016)biomass
[13]
57.5
13.3
0.72
6.66
0.36
1724
50.72
ays, respectively. The
Therefore,
MRT in
of MPBR
5 days,was
MPBR
performed
the optimum
biomassatgrowth
measured
as MLSS.
Gao, et al. (2016) [18]
56.2
6.8
0.42
6.81
0.42
1100
42.60
uctivity; the productivity
2 daysliving,
was then
Relative to MRT of 2
This value at
included
dead136.67±20.34
algae, protozoamg/l.day.
and bacteria.
However,
based onwas
cellachieved
counts and
microscopic
observation,
the lower biomass
productivity
at MRT
of 3 days
due to lower
F/M ratio.
Insurface volume ratio; TN = total nitrogen; TP =
Remarks:
SVR =
was observed
to beproductivity
dominant inoccurred
the biomass
ast to MRT of living
3 days,algae
the lowest
microalgae
at 1.5 days
because of MLSS = mixed liquor suspended solids.
total phosphorus;
the light
cultivation
period,
which ranged
fromdue to self-shading
verly high F/M mixture
ratios. Induring
addition,
may limit
the microalgal
growth
Because of the high nutrient media in this study, which were
0.3×10⁶ to 28.5×10⁶ cells/ml (Fig. 2). Flocs formation of
gh biomass concentration;
respiration
algae occurs
in MPBR
This
10- to[17].
28-fold
and 6- to 24-fold higher than these wastewaters
microalgae therefore,
occurred indark
MPBR
at the ofbeginning
of the
not proved in this
study.
respectively,
the
microalgae productivity in this study was
stationary phase; therefore, the counting number of algae was
higher
than
in
previous
studies [3, 11, 13, 18]. Relative to
ased on the observed
results,
it
is
clear
that
the
MRT
as
short
as
1.5
days
could
cause
the
hardly estimated because flocs formation was occurred in the
other
studies,
the
nutrient
loading
in this study was higher. This
ass productivityreactor.
to decrease
significantly
algalcould
biomass
concentration
retained in
The appearance
of due
flocstoinlow
MPBR
be due
to
eactor. MRT of lower than 2 days strongly affects the biomass concentration and biomass
uctivity of the MPBR. In addition, the suitable MRTs for MPBR in this study ranged
een 2 and 5 days. The average biomass productivicty ranged between 146.43±8.52 and
Vietnam Journal of Science,
September 2018 • Vol.60 Number 3
69
93±15.05 mg/l.day for MRT of 2 to 5 days (Table 1).
Technology and Engineering
-1
-1
-1
-1
Life Sciences | Biotechnology
proved that the 1:30-diluted human urine provided sufficient
nutrients for microalgae production, while Jaatinen, et al. (2016)
reported that the 1:25-diluted urine was the optimal medium for
Chlorella vulgaris cultivation [8]. The submerged membrane
demonstrated the effectiveness in preventing wash-out of biomass
and improvement of nutrient loading. The highest biomass
concentration of 759 mg/l at MRT of 5 days was achieved.
In this study, the MPBR exposed an illumination area
of 0.32 m2 and yielded the surface to volume (S/V) ratio of
m2/m3, which was lower than the optimum S/V ratios of
80-100 m2/m3 in PBR [11]. However, the reactor’s biomass
and biomass productivity were respectively 759 mg/l and
151.93±15.05 mg.l-1.day. This value was higher than that yielded
by other MPBRs [3, 11]. Therefore, the performance of MPBR
could be minimised by effective mixing of air bubbles. Moreover,
the S/V ratio was smaller than the ratio in previous studies by Gao,
et al. [13, 18]; nevertheless, the higher production was achieved in
this study due to the lower biomass concentration (Table 1). The
high concentration of algae could cause the respiration in the dark
[17] and the smaller production in these studies.
The N/P ratio of diluted human urine in this study was
20:1, which was higher than the ratio of microalgal biomass
(CO0.48H1.83N0.11P0.01) [5] and Redfield ratio (16:1) [18]; therefore,
P was the limiting factor for microalgal growth. In addition, the
N/P ratio of 15:1 was regarded as the optimum ratio for microalgal
growth with maximum biomass concentration of 3568 mg/l [19].
Additionally, other types of wastewater containing the lower N/P
ratio can be mixed with human urine for microalgal cultivation.
For example, the shrimp farming wastewater containing TN and
TP was 159 and 19.6 kg/ha.crop (the N/P ratio was 8:1), which
is one of the potential sources for eutrophication in the Mekong
Delta [20].
Conclusions
This study illustrates the potential of applying human
urine for biomass production. Urine can be an ideal nutrient to
cultivate microalgal biomass. The average biomass productivity
was as high as 146.43 to 151.93 mg.l-1.day at the operated MRT
of 2 to 5 days. The MRT shorter than 1.5 day caused a significant
reduction of biomass productivity.
ACKNOWLEDGEMENTS
This research was funded by the Ho Chi Minh city
University of Technology - VNU-HCM under grant number
TSĐH-MTTN-2017-22. The laboratory research was supported
by intern students (Mr. Joel Lee, Dadu Hugo, and Alexander
Marcos).
The authors declare that there is no conflict of interest
regarding the publication of this article.
REFERENCES
[1] T. Karak, P. Bhattacharyya (2011), “Human urine as a source of
alternative natural fertilizer in agriculture: A flight of fancy or an achievable
reality”, Resour. Conserv. Recycl., 55, pp.400-408.
[2] K. Tuantet, H. Temmink, G. Zeeman, M. Janssen, R.H. Wijffels, C.J.N.
Buisman (2014), “Nutrient removal and microalgal biomass production on
70
Vietnam Journal of Science,
Technology and Engineering
urine in a short light-path photobioreactor”, Water Res., 55, pp.162-174.
[3] F. Gao, Z.H. Yang, C. Li, Y. Wang, Y. Jie Jin, W. Hong, Deng Y. Bing
(2014), “Concentrated microalgae cultivation in treated sewage by membrane
photobioreactor operated in batch flow mode”, Bioresour. Technol., 167,
pp.441-446.
[4] Y. Luo, P. Le-Clech, R.K. Henderson (2016), “Simultaneous
microalgae cultivation and wastewater treatment in submerged membrane
photobioreactors: a review”, Algal Res., 24, pp.425-437.
[5] Y. Chisti (2007), “Biodiesel from microalgae”, Biotechnol. Adv., 25,
pp.294-306.
[6] A.M. Kunjapur, A.R.B. Eldridge (2010), “Photobioreactor design for
commercial biofuel production from microalgae”, Ind. Eng. Chem. Res., 49(8),
pp.3516-3526.
[7] M.R. Bilad, V. Discart, D. Vandamme, I. Foubert, K. Muylaert, I.F.J.
Vankelecom (2014), “Coupled cultivation and pre-harvesting of microalgae in
a membrane photobioreactor (MPBR)”, Bioresour. Technol., 155, pp.410-417.
[8] S. Jaatinen, A.-M. Lakaniemi and J. Rintala (2016), “Use of diluted
urine for cultivation of Chlorella vulgaris”, Environ. Technol., 37(9), pp.11591170.
[9] S. Zhang, C.Y. Lim, C.-L. Chen, H. Liu, and J.-Y. Wang (2014), “Urban
nutrient recovery from fresh human urine through cultivation of Chlorella
sorokiniana”, J. Environ. Manag., 145, pp.129-136.
[10] C. Safi, B. Zebib, O. Merah, P.-Y. Pontalier, and C. Vaca-Garcia
(2014), “Morphology, composition, production, processing and applications of
Chlorella vulgaris: a review”, Renew. Sust. Energ. Rev., 35, pp.265-278.
[11] L. Marbelia, M.R. Bilad, I. Passaris, V. Discart, D. Vandamme, A.
Beuckels, K. Muylaert, I.F.J. Vankelecom (2014), “Membrane photobioreactors
for integrated microalgae cultivation and nutrient remediation of membrane
bioreactors effluent”, Bioresour. Technol., 163, pp.228-235.
[12] American Public Health Association, American Water Works
Association, Water Environment Federation (1992), “Standard methods for the
examination of water and wastewater”, American Public Health Association,
Washington.
[13] F. Gao, C. Li, Z.H. Yang, G.M. Zeng, J. Mu, M. Liu, W. Cui (2016),
“Removal of nutrients, organic matter, and metal from domestic secondary
effluent through microalgae cultivation in a membrane photobioreactor”, J.
Chem. Technol. Biotechnol., 91, pp.2713-2719.
[14] J. Lee, D-H. Cho, R. Ramanan, B-H. Kim, H-M. Oh, H-S. Kim (2013),
“Microalgae-associated bacteria play a key role in the flocculation of Chlorella
vulgaris”, Bioresour. Technol., 131, pp.195-201.
[15] J. Ruiz, Z. Arbib, P.D. Álvarez-Díaz, C. Garrido-Pérez, J. Barragán,
J.A. Perales (2014), “Influence of light presence and biomass concentration on
nutrient kinetic removal from urban wastewater by scenedesmus obliquus”, J.
Biotechnol., 178, pp.32-37.
[16] A.M. Åkerström, L.M. Mortensen, B. Rusten, H.R. Gislerød (2014),
“Biomass production and nutrient removal by chlorella sp. as affected by
sludge liquor concentration”, J. Environ. Manag., 144, pp.118-124.
[17] H. Choi (2015), “Intensified production of microalgae and removal
of nutrient using a microalgae membrane bioreactor (mmbr)”, Appl. Biochem.
Biotechnol., 175, pp.2195-2205.
[18] F. Gao, C. Li, Z.H. Yang, G.M. Zeng, L.J. Feng, J. Liu, J. Zhi, M. Liu,
H. Cai (2016), “Continuous microalgae cultivation in aquaculture wastewater
by a membrane photobioreactor for biomass production and nutrients removal”,
Ecol. Eng., 92, pp.55-61.
[19] H-N-P. Vo, X-T. Bui, T-T. Nguyen, D. Duc Nguyen, T-S. Dao,
N-D-T. Cao, T-K-Q. Vo (2018), “Effects of nutrient ratios and carbon dioxide
bio-sequestration on biomass growth of Chlorella sp. in bubble column
photobioreactor”, J. Environ. Manage., 219, pp.1-8.
[20] P. Thi Anh, C. Kroeze, S.R. Bush, A.P.J. Mol (2010), “Water
pollution by intensive brackish shrimp farming in south-east Vietnam: Causes
and options for control”, Agric. Water Manag., 97, pp.872-882.
September 2018 • Vol.60 Number 3