Urban planning and economic development of Nepal
Bạn đang xem bản rút gọn của tài liệu. Xem và tải ngay bản đầy đủ của tài liệu tại đây (379.97 KB, 12 trang )
TRIBHUVAN UNIVERSITY JOURNAL, VOL. 32, NO. 2, DECEMBER, 2018
107
URBAN PLANNING AND ECONOMIC
DEVELOPMENT OF NEPAL
Krishna Raj Acharya*
ABSTRACT
Urban planning is an integral part of economic planning. The
concept of planning has became more popular because of answering
the questions; what to produce, how to produce and to whom should be
produced. If there is a proper planning in urban areas of any country,
then economic development is possible in those nations. In this paper,
attempts were directed to explore the relationship between dependent
and affecting variables (independent variables) in the time of study of
urban planning. It concluded that there is no association among urban
growth and urban population, number of urban areas as well as urban
population percent. The identified urban indicators are regressed with
urban growth which reveals that the variables are not best fitted so that
the development of our nation is still in the verge of obstacle. P value of all
these independent variables are insignificant (P > 0.05, 0.87 coefficients of
urban population percent, 0.72 coefficient of number of urban areas and
0.09 coefficient of national population growth > 0.05).
Keywords: Urban planning, economic development, variables, resources,
population
INTRODUCTION AND OBJECTIVE
Planning is the systematic way of doing certain work. Basically in
economic planning three components are included into analysis. They areobjectives, resources for the fulfillment of that objective and certain time
period. The concept of planning was first of all propounded and implemented
from the side of former USSR in 1928 AD. Due to their economic plan
of that time, their economy was not affected from the great depression of
1930s decade. Thereafter, the concept of plan became worldwide. Planning
is useful to mobilize the available resources according to the intensity of
wants so that there is a greater chance of being rapid economic development
in the country. Similarly, economic development is a process whereby real
per capita income of the people increase over the long time period. It is
*
Dr. Acharya is an Associate Professor of Economics, Ratna Rajyalaxmi
Campus, Bhrikuti Mandap, TU.
108 URBAN PLANNING AND ECONOMIC DEVELOPMENT IN NEPAL
only possible when we have a good planning. Economic planning in each
country is to accelerate the pace of economic development. If planning is
formulated and implemented properly and effectively then it will be a key
role for the utilization of available resources.
The geographical location of Nepal is panoramic in the sense that it
has lot of beautiful places. The Himalaya, mountains and the Terai constitute
Nepal. The highest peak of Mt. Everest with several peaks of the Himalayas
is the center of attraction for courageous tourists. Nepal is the one of the
best countries in the world with specialties of the large mountain areas, the
beautiful structure of those mountains, multi religious, multi lingual, multi
ethnic and multi culture (Parajali, 2008). As of other nations, Nepal has
rural as well as urban areas. Development of the nation is relying on the
planning and management of these areas.
In every country, there are two sectors. They are rural sector and
urban sector. Economic planning incorporates both rural and urban planning.
In the absence of rural planning, the dream of urban planning cannot be
materialized. For example, we have a plan of establish the industries in the
urban areas of Nepal but there is lack of rural plan to produce raw materials
then it cannot convert into reality. So that rural and urban planning and
development are complementary rather than substitute. In the absence of
one, the value of next will be nil.
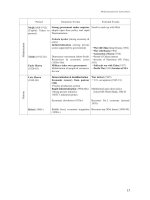
Earlier, Nepal had 217 cities and 3157 famous villages with fame
and specialties because they all have different culture, natural resources and
other special identities. Later on, the data was changed as the commission
of Restructuring in Federalism has decided 774 local bodies in Falgun
of 2073 which constitute 7 provinces, 77 districts, 6 metropolises, 11
sub metropolis, 276 municipalities and 481 rural municipalities. The
recommended local bodies are listed in the red book of the government and
it is implemented practically. The concept of one metropolis in one state
according to government policy has been neglected. For example there are
three metropolises in a province three of Nepal and other provinces have
no metropolis in Nepal. The government’s such irrational activity has been
heavily criticized by the people. Nepal is a country of villages in the sense
that even it is declared as urban, they are like of rural and backward. So,
there is no way to develop our nation until and unless village is not in
the mainstream of development. It is quite essential to increase the rural
TRIBHUVAN UNIVERSITY JOURNAL, VOL. 32, NO. 2, DECEMBER, 2018
109
agrarian production, productivity and skill to ensure peace, progress and
prosperity in the faces of rural dwellers.
Conceptualizing Urban Planning
Urban planning is the systematic efforts to develop the area where
development strategies are carried out with certain objectives and defined
resources. The concept of planning became more popular due to the limited
resources. Limited resources should be used where it is more productive.
It is basically decided on the basis of various criteria. Cost benefit ratio,
net present value and internal rate of return are basic instruments that used
before investing in capital assets. In Nepal, the concept of planning was
systematically forwarded in 2013 BS even it was informally implemented
in Rana regime. We completed more than a half century of our systematic
manner of work. But in real sense, we are not getting as we expected from
our plans due to various imperfections in the market and acute shortage
of resources. So that urban planning implies the systematic and planned
work of the urban areas. For example, wide and clean road, employment
opportunities, proper sanitation and health facilities, pure drinking water,
development of secondary sectors, solid waste management, and appropriate
space that required in the time of evacuation when natural calamities are the
components of urban planning.
A city is not only collection of buildings, and it is more than a
collection of human beings. It must have at least some minimum of
structure, with identifiable roles and status positions. It is more amorphous
than a corporation, more structured than a crowd. Although it has a political
definition, the operational city frequently does not coincide with the
political boundaries, and the economic structure likewise fails to conform
to the political unit. Despite these difficulties, all of us seem to agree that
there is an identifiable phenomenon called a city; that there is, indeed, a
class of such phenomena; and that these cities have certain properties which
can be studied by scientific methods. It is possible to represent the city as
a system characterized by a feedback loop involving human efforts, capital
equipment, and goods and services. (There are numerous other feedback
loops within this one, for ex- ample, the population-garbage-disease cycle,
which will be ignored in this paper.) A psychological approach to this urban
system proposes that we focus on the human beings who are the atoms, the
irreducible units of the system. Inputs into the urban process include human
talents, skills, and energies; human outputs include consumable goods and
110 URBAN PLANNING AND ECONOMIC DEVELOPMENT IN NEPAL
income, services, suffering, goal- achievements, and satisfactions. By this
definition, criminal behavior may be an output, as well as the pain of the
victim; the production of music by a symphony orchestra is another service
output, and the enjoyment of the listener is an out- put of a different kind,
but, nevertheless, not one to be ignored. For convenience, the traditional
out- puts (commodities, street-maintenance, school-operation, and the
like) are separated from the psychological outputs (anxieties, hostilities,
frustrations, and satisfactions). In any real observation of the city, of course,
there is a close linkage of the two categories (Stagner, 1970).
Current Urban Condition of Nepal
Urban database system on land and infrastructure related variables
is poor and far from comprehensive and reality. Land fragmentation,
unregulated and informal urban land market, cumbersome land acquisition
and compensation mechanism and lack of comprehensive zoning
regulations and land use controls characterize the prevailing conditions of
urban land. The supply of serviced land is limited and urban sprawl is at
the expense of productive agricultural land. The evolving urban form is
becoming increasingly disorganized with incompatible land uses pattern
and declining level of amenities and neighborhood environment in Nepal
(MoUD, 2017).
Lack of urban infrastructures is highlighted by the condition
of water supply, sanitation, solid waste management, housing pattern,
transport and energy. There is considerable disparity among ecological
regions. Only 32.9 percent of households have access to piped water supply
in urban Tarai as compared to 81.2 percent of households in urban hill. The
quality and quantity of drinking water is insufficient and untimely in all
urban regions. To meet the MDG target of water for all by 2017, substantial
investment to the tune of Rs. 7.5 billion per annum is required to be spent.
Conditions of sanitation system and solid waste management are also
critical. Only 56.1 percent of urban households have access to sanitation
system with 88.2 percent households having access to toilets. Likewise, out
of 58 municipalities, only 6 have sanitary landfill sites and only 5 practices
controlled waste dumping reflect worse situation (MoUD, 2017)
Lack of affordable housing and increasing squatter settlements
are major problems in the urban housing sector, which is evident in the
growing housing deficit and increasing percentage of squatter settlements
in urban areas. Squatters settlement comprise an approximately 10 percent
TRIBHUVAN UNIVERSITY JOURNAL, VOL. 32, NO. 2, DECEMBER, 2018
111
of the urban population, but some urban areas have three times of such
problem like Dharan. Inadequate, unproductive and inefficient transport
infrastructure is a critical concern in urban transportation sector. The average
road density of urban areas is 3.26 km/sq.km, which is inadequate for the
efficient urban mobility as well as to promote urban rural linkages. The
national energy crisis is apparent and exaggerated in the urban area. The
demand of electricity is the highest in urban and industrial corridors with
an annual rate of increment of 9 percent but it is not available in reasonable
rate. Demand for electricity is high when it compared the supply in urban
areas.
To assess the infrastructural status of various municipalities,
an Urban Infrastructure Condition Index (UICI) was computed for 58
municipalities. UICI provides a tool for comparison of infrastructural
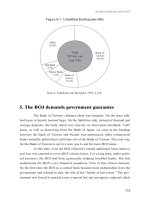
condition of municipalities. Kathmandu Metropolitan City has the highest
value of UICI whereas Gulariya remains at the bottom of the index list.
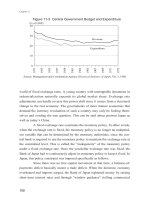
Urban areas are regarded as the engines of economic growth. The recent
GDP data by CBS shows that urban areas directly contributed 33.1 percent
to the national GDP (NPC/ UNDP 2014) and another 30 percent comes from
the VDCs at proximity to or served by the urban centers. The contribution
of urban areas to the GDP provides stronger justification for investing in
urban infrastructure because it facilitates in the generation of wealth and
employment opportunities and boosts the rate of economic growth (MoUD,
2017).
Agriculture and its related activities account for one-third of
the total employment in the urban sector. Wholesale and retail trade and
manufacturing contribute 17 percent and 14 percent of urban employment
respectively. Poverty in urban areas is rising. In 2003/04 about 10 percent
of urban population was lying below the poverty line. The 2010/11 NLSS
shows that population below poverty line comprises 15 percent of the total
urban population. There are significant differences between urban areas –
Pokhara has only 1.3 percent below poverty line while in Gulariya, it is 50
percent which is quite high than that of Pokhara (MoUD, 2017).
Planning and Development in Nepal
In normal sense, economic planning and development have positive
relationship. It was realized in the tome of great depression of the world by
former USSR. Their economy was safe from the big blow of depression
in that time. Without proper plan, there is a chance of misuse of scarce
112 URBAN PLANNING AND ECONOMIC DEVELOPMENT IN NEPAL
resources. Urban and rural planning can be summarized in a plan of a nation
because country is a summation of rural and urban areas.
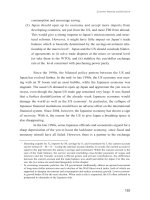
Over the years, the economic growth rate has lingered between
three and four per cent. Nepal needs to ensure stable economic growth to
meet the target of 5.5 per cent growth by 2015. Agriculture still employs the
majority of the workforce in the country, and thus immediate steps need to
be taken to enhance production capacity through innovative means and new
technology. The immediate challenge is to deal with the energy crisis as
the country faces 56 hours of load-shedding per week. It also has to ensure
good governance, inclusive development and sustainable growth in the near
future. It is also necessary to undertake strategies to invest in some large
infrastructures such as mid-hill highways, Kathmandu-Tarai Fast Track,
mega power plants etc (ORF, 2015)
However, the most immediate challenge is of political stability
as without this no economic programme or policy can be prepared or
implemented. The political instability and the inability of the political
parties to conclude the peace process and Constitution-writing have severely
hampered Nepal’s development prospects. Foreign investment is lacking in
major sectors like infrastructure and hydro-power development. Industry is
suffering and donor-funded projects remain incomplete. The transition to
an equitable and inclusive development requires political stability, which
has been illusive in Nepal since 1990’s.There are opportunities for Nepal’s
growth mainly through development of hydro sector and expansion of
market as a “bridge” between two giant economies of the world - India and
China. The political class should realize this immense opportunity knocking
Nepal and resolve the political tensions at the earliest for the sake of peace,
development and well-being of all Nepalese people (ORF, 2015).
In summary, there is a positive relationship between economic
planning and development in the sense that it allocate and use of human
and natural resources in most productive sectors. If there is a planning
of urban area then the resources available in that area utilized properly,
efficiently and effectively. Natural resources should be balanced with the
size of population of that area. If there is no association between these two
variables, then there is a problem of over utilization and underutilization
quantitative as well as qualitative aspects of both (rural and urban) areas
should take as a part of analysis. .
TRIBHUVAN UNIVERSITY JOURNAL, VOL. 32, NO. 2, DECEMBER, 2018
113
METHODOLOGY
This paper was prepared on the basis of existing stock of knowledge
of the presenter and different data and literature available in the time of
study. Previous development plans of Nepal with expected growth and
actual growth were taken as a instrument of analysis. In Nepalese context,
plans, resources allocation and actual returns were analyzed with the help
of available literature in this paper. To explore the relationship between
economic plans and development was the main objective of this paper and
existing stock of knowledge were used to reach in the conclusion in this
assigned task. Secondary data were used to explain about various micro
and macro variables. To some extent, questions were asked to the dwellers
of urban area and write the conclusion on the basis of their answers. Some
of the writing is based on the observation from the side of presenter. Some
data were taken from economic surveys, budget speech and various five and
three years interim plans of Nepal.
Model was developed to explore the relationship between dependent
and independent variables.Urban population percent, number of urban areas
and national population growth were taken as independent variables while
urban growth was dependent variable. Model was specified as;
Y= β0 + β1X1 + β2X2 + β3X3………………………………….. (i)
Y= Urban Growth, X1= Urban Population (in percent), X2= Number of
Urban Areas and
X3 = Urban Population Growth
ANALYSIS
This section incorporates process of urban planning and current
practices of Nepal.
Process of Urban Planning and Economic Development
Urban planning was started in Nepal before implementation of five
year economic plan in 1956. Before that time period, people are centered in
the areas where there are fertile land, employment opportunities and others
facilities. Slowly, people started to shift from hills and Himalayan regions
to Terai areas, ultimately large number of population leads toward urban
centers. Now, those centers have lot of problem due to influx of population
and heavy encroachment on natural resources. Growth of population and
their management were two basic components for the rise of urban sector in
114 URBAN PLANNING AND ECONOMIC DEVELOPMENT IN NEPAL
Nepal. The rise of urban sector is rapid after the declaration of new federal
structure of Nepal.
Table1: Urban growth patterns in Nepal
Urban
Year/
Population
Variables
(000)
1961
336
1971
462
1981
957
1991
1696
2001
3228
2011
4523*
2014
5130
No. of
Urban
areas
16
16
23
33
58
58*
191
Urban
Population
(%)
3.6
4
6.4
9.2
13.9
17*
18.2
Urban
Growth
4.4
3.2
7.5
5.8
6.6
3.4***
4.1
National
Population
Growth
1.65
2.07
2.66
2.1
2.27
1.35*
1.35
Source: Adapted from Choe and Pradhan(2010: p.7)
* CBS (2012), ** UN DESA(2014), *** MoUD(2015)
The number of population in the urban areas is increasing year after
year. But the facilities of the urban areas remain unchanged. The number of
urban center is also increasing due to the internal migration of people from
hill to Terai and district headquarters of Nepal.The economic activities of
this region cannot increase as it is expected from the side of policy makers.
So that the rate of economic development is slow in Nepal.
Urbanization is an index of transformation from rural economy to
modern industrial one. It is consider as an integral part of the process of
human civilization, economic transformation and development. Urbanization
has positive change than negative change on social change. Number of
urban places increased from 10 in 1952/53 to 191 in 2014. Urbanization
in Nepal has spatial characteristics. There is a regional variation in level of
urbanization. It range from 14.3 percent to 40.3 percent in ecological zones,
25.9 percent to 47.3 percent in development regions and 4.9 percent to 64.3
percent in ecological regions. The level of urbanization ranging from a low
of 6 percent for Rolpa district to a high of 100 percent for Kathmandu and
Bhaktpur districts (Thapa, 2074).
115
TRIBHUVAN UNIVERSITY JOURNAL, VOL. 32, NO. 2, DECEMBER, 2018
Table 2: Log Values of Urban Population, Number of Urban Areas, National
Population Growth &Urban Growth.
Years
1961
1971
1981
1991
2001
2011
2014
LNURBAN_
GROWTH
1.481605
1.163151
2.014903
1.757858
1.88707
1.223775
1.410987
LNUPOPC
LNUAREA
LNNPG
1.280934
1.386294
1.856298
2.219203
2.631889
2.833213
2.901422
2.772589
2.772589
3.135494
3.496508
4.060443
4.060443
5.252273
0.500775
0.727549
0.978326
0.741937
0.81978
0.300105
0.300105
Source: Based on Table 1 & Processed by Applying Eview 9 software
Our given data were converted as log value (first order differentiation)
tp make the value more symmetrical and bell shaped. It is still taken as a
important step in the process of model building in the context of statistical
analysis. Now descriptive statistics of the table 2 can be estimated as;
Table 3: Descriptive Statistics of above listed Variables
LNURBAN_
GROWTH
LNUPOPC
LNUAREA
LNNPG
Mean
1.562764
2.158465
3.650048
0.624082
Median
1.481605
2.219203
3.496508
0.727549
Maximum
2.014903
2.901422
5.252273
0.978326
Minimum
1.163151
1.280934
2.772589
0.300105
Std. Dev.
0.329619
0.669913
0.888086
0.262523
Skewness
0.136551
-0.20365
0.709441
-0.15116
Kurtosis
1.541482
1.466549
2.470435
1.628792
Jarque-Bera
0.642209
0.734232
0.668986
0.575053
Probability
0.725347
0.692729
0.715701
0.750117
Sum
10.93935
15.10925
25.55034
4.368576
Sum Sq. Dev.
0.651893
2.692702
4.732184
0.413509
Observations
7
7
7
7
Source: Based on Table 2 and Analyzed by Using Eview 9 Software.
Nepal is one of the ten least urbanized countries in the world.
However, it is also one of the top ten fastest urbanizing countries. In 2014,
116 URBAN PLANNING AND ECONOMIC DEVELOPMENT IN NEPAL
the level of urbanization was 18.2 per cent, with an urban population of
5,130,000, and a rate of urbanization of 3 percent. For the period 2014- 2050,
Nepal will remain amongst the top ten fastest urbanizing countries in the
world with a projected annual urbanization rate of 1.9 per cent (UNDESA,
2014). Urbanization in Nepal is dominated by a few large and medium
cities with an excessive population concentration in the Kathmandu Valley.
High urban growth is occurring in the Kathmandu Valley, the Pokhara
Valley, the Inner Tarai valleys, and in market and border towns located on
highway junctures between the east-west highway and the five main northsouth corridors. Urban growth centers are also emerging close to the border
with India (Muzzini&Apericio, 2013). On the basis of table 2, we have a
regression analysis on the basis of Eview 9.
Table 4: Results of Regression Analysis
Variable
LNUPOPC
LNUAREA
LNNPG
C
R-squared
Adjusted R-squared
S.E. of regression
Sum squared resid
Log likelihood
F-statistic
Prob(F-statistic)
Coefficient
0.068594
0.126601
1.208896
0.198155
0.683674
0.367348
0.262177
0.206211
2.404117
2.161296
0.271511
Std. Error
t-Statistic
0.399337
0.171770
0.325456
0.388996
0.496620
2.434247
0.787020
0.251779
Mean dependent var
S.D. dependent var
Akaike info criterion
Schwarz criterion
Hannan-Quinn criter.
Durbin-Watson stat
Prob.
0.8746
0.7232
0.0930
0.8175
1.562764
0.329619
0.455966
0.425058
0.073943
2.863033
Source: Based on Table 2 and Processed through Eview 9 Software.
On the basis of given information, we can conclude that there is no
association among urban growth and urban population, number of urban
areas as well as urban population percent. In other words, they are statistically
insignificant. No relationship among variables of urban indicators reveals
that variables are not best fitted so that the development of our nation is still
in the verge of obstacle. It can mathematically express as;
Y= 0.19 + 0.06X1 + 0.12X2 + 1.2X3………………………….. (ii)
Where,
Y= Urban Growth, X1= Urban Population (in percent), X2= Number of Urban
Areas
X3 = Urban Population Growth
TRIBHUVAN UNIVERSITY JOURNAL, VOL. 32, NO. 2, DECEMBER, 2018
117
Urban planning in Nepal is not satisfactory because there is no
close relationship among the desired variables. No urban planning, the rate
of development is certainly slow which is true in Nepalese context.
Current Practices of Urban Planning in Nepal
Urban planning is the systematic function of the urban area but the
role of rural should not be overlooked. In these days, population criteria if
fulfilled then it declared as an urban area in Nepal. In Nepal, population size
is taken as a indicator of urban area. In urban areas of Nepal, manpower
planning is hazardous so that production is less. Water supply in most of
the cities of Nepal is inadequate and of low quality. Appropriate type of
education and health services are rare in Nepalese urban area which is the
basic service of such areas. Pollution level of Nepalese cities is very high
which easily can be realized with simple observation. Waste management
is a basic problem of Nepalese cities so that the dwellers of urban areas
are facing the problem from such type of waste. All the variables of urban
area are not actually met from our side so that there is low rate of economic
growth. It is due to lack of urban planning in Nepal. In the time of developing
cities in Nepal, environmental aspect still is not taken into analysis. So that,
the rate poor is more rapid due to cities of Nepal.
The urban population living below poverty lone was 10 percent
in fiscal year 2003/04. While, it was went up to 15 percent in fiscal year
2010/11. Urban poverty gap varies substantially across Nepal. Population
living below poverty line is 1.3 percent in Pokhara while that of Guleria
is 50 percent (Economic Survey, 2017). Contribution of urban sector to
gross domestic product (GDP) is 33.1 percent. Contribution of village
development committee in proximately to urban areas enjoying urban
facilities accounts for 30 percent (UNDP, 2014).
CONCLUSIONS
After the study in this presented paper, we know that planning and
growth of a nation are two inseparable parts as two sides of same coin.
It was empirically verified in the time of economic depression of 1930s.
Health, education, employment, space management, waste management,
pure drinking water, less dust and smoke, people with awareness, dominant
of secondary sector are the basic prerequisite for the urban (cities) areas.
We can easily claim the poor real situation with the help of observation. In
our data there is no strong statistical association between dependent (urban
growth) and independent variables (number of cities, urban population size
118 URBAN PLANNING AND ECONOMIC DEVELOPMENT IN NEPAL
and urban population percent). The probability value of all these independent
variables is higher than 0.05 (0.87 coefficient of urban population percent,
0.72 coefficient of number of urban areas and 0.09 coefficient of national
population growth > 0.05) so that there is no association among them.
ACKNOWLEDGEMENTS
The author deserve thanks to the Institute of Social Development
and Research, Ranchi for providing an opportunity to present a paper
entitled “Urban Development” which was held on 10-12 March, 2018.
REFERENCES
CBS.(2014). National population and housing census 2011: Urban tables.
Kathmandu: Author.
MoF (2017).Economic survey. Kathmandu: Ministry of Finance.
MoUD(2015). National urban development strategy. Kathmandu:Author.
- - - (2017). National urban development strategy. Kathmandu: Author.
Muzzini, E. &Aparicio, G. (2013).Urban growth and social transition in
Nepal. Washington D.C: World Bank.
ORF (2015).Annual report 2015. Delhi India: Author.
Parajuli (2008).Citizen Perception about Green Space Park in Pokhara.
Himalayan Journal of Sociology and Anthropology,Vol (3), pp. 3445
Stagner, R. (1970). Perceptions, Aspirations, Frustrations, and Satisfactions:
An Approach to Urban Indicators. The Annals of the American
Academy of Political and Social Science, (388), 59-68. Retrieved
from />Thapa, N.R (2074). Urban demography in Nepal. RR Interdisciplinary
Journal.Vol.( 1), pp. 142-150
UNDESA (2014). World urbanization prospects: 2014 revision. New York:
Author.
UNDP (2014). Nepal annual report. Washington D.C. United Nation
Development Program.