Trade and environment in Indonesia: Case study of Euindonesia free trade agreement
Bạn đang xem bản rút gọn của tài liệu. Xem và tải ngay bản đầy đủ của tài liệu tại đây (705.92 KB, 8 trang )
TRADE AND ENVIRONMENT IN INDONESIA: CASE STUDY OF EUINDONESIA FREE TRADE AGREEMENT
Resty Tamara Utami1
Dyah Titis Kusuma Wardani2
1
International Program for Islamic Economics and Finance, Faculty of Economics and
Business, Universitas Muhammadiyah Yogyakarta, Indonesia
2
Department of Development Economics, Faculty of Economics and Business,
Universitas Muhammadiyah Yogyakarta, Indonesia
Abstract
This paper attempts to investigate whether environmental impacts, would increase
or decrease with trade liberalization. Trade expansion, that is, Comprehensive Economic
Partnership Agreement (CEPA) between EU (European Union) and Indonesia causes
environmental damage in Indonesia. Trading activities between Indonesia and EU makes
some negative externalities even the vision of CEPA included the concrete measures to
promote the sustainability of environment of EU-Indonesia. Using industrial pollution
projection system developed by the World Bank in 1995, it has been found that the
estimated amounts of pollution have been increasing in Indonesia after three years of
CEPA implementation from 2014 to 2016. Even though the share of export of most
polluting sectors has been decreasing, its contribution on the pollution intensity remains
the largest. Since chemicals become the most polluting sector with its rapid growing in
export to EU countries, this sector needs to be considered in trade negotiations in order to
lessen negative impacts of trade to the environment.
Keywords: trade and environment; liberalization; pollutions; Indonesia-EU CEPA
JEL Classifications: F18; F10; F64; F02
1. Introduction
In recent years, trade liberalization has brought the issue of the relationship between
trade and environment whether it has positive or negative impact on the environment. The
production of goods, either they are exported or imported, would have environmental
impacts like other production. With expanded trade, it is generally believed that the trading
nations would be beneficial through increasing efficiency and greater wealth. However,
what if the expanded trade leads to environmental degradation? Since trade always
involves two or more nations, the burden of environmental externalities can be
transnational and it will cause significant problems when international trade agreements do
not explicitly include any regulations for environmental protection.
There are many ways that expanded trade may encourage the entire world
production which leads to increase the pollution intensity and environmental damage.
133
Trade activities always involve energy use to transport goods overseas resulting on air
pollution. For example, the Kenyan exporters of horticulture products deliver the flowers
to Europe by jet in which the energy consumed in jet fuel causes environmental issue. On
the other hand, displacing peasant with larger-scale export agriculture and growing crops
focusing on export also will damage the environment. They will use their economic power
to demand environmentally damaging input subsidies which lead to over irrigate, over
mechanize, and overspray (Harris, 2004). Over spraying the crops through pesticides will
cause harmful effects for health. The harvested products will contain the leftover of
hazardous chemicals which are dangerous to consume.
Even though expanded trade seems to have negative impacts on the environment, it
also has beneficial effects. Based on theory of comparative advantage, trade encourages the
trading nations to be more efficient in exploiting their resources and avoiding the waste.
Trade expansion can spread the environmentally friendly technology to many developing
countries through replacing the high-polluting power plants with modern, highly efficient
ones. Transnational companies also play important role by introducing efficient technologies
to develop cleaner process for industrial sectors. Hence, the relationship between trade and
environmental quality is somewhat complicated and needs to investigate further.
Previous studies have discussed about trade liberalization and environmental issues
since 1970s, particularly after some trade negotiation rounds. Trade expansion is strongly
related to rapid growth of the global economy which leads to gradual degradation in the
environment. The relationship between economic growth and environmental damage was
theoretically depicted through Environmental Kuznets Curve (Grossman and Krueger,
1991). This concept predicted three stages of environmental decay that it would rise at
lower income levels, attain a maximum level at turning point income, and then decline.
During the first stage, the nation is positioned at the early phase of industrialization and
development, which is characterized by exploitation of natural resources and dirty
technologies for production, causing the environmental decay. As time goes by, quality of
life improves since people wealthier and they tend to demand for an environment-friendly
society, making the government to pay attention on how to preserve environmental quality.
Shafik and Bandopadhyay (1992) confirmed this proposition by finding a consistent and
significant relationship between income and environmental quality indicators. An initial
rise in income would be followed by an increase in pollution matter such as sulphur
dioxide and then declined once the economy attained a given level of income. Grossman
and Krueger (1995) predicted that the turning point of income would come before $8,000
income per capita. Generally, this relationship has been established only in some areas of
environmental degradation with immediate and visible effects, such as air pollution.
The net effect of trade liberalization on environmental quality can be decomposed
into three components, such as composition effect, scale effect, and technique effect
(Grossman and Krueger, 1991). The composition effect occurs when trade is more open,
causing specialization which makes a country to export products with abundant resources
and import products with relatively scarce resources. The magnitude of the composition
134
effect is based on the comparative advantage of the country whether it is in pollutionintensive sectors or less polluting sectors. The positive impact on local environment would
emerge if a country exports less polluting sectors after trade liberalization. The scale effect
comes from enhanced economic activities which is hazardous to the environment since it
produces additional emissions. The technique effect takes place when cleaner production
techniques are introduced which lead to lower level pollution per unit of output. Then, the
net effect for the environment is based on the combination of those components, not the
individual component. It can be positive if the scale effect is less than the composition and
technique effects, and negative if the opposite holds.
Some studies argued that trade liberalization has brought positive environmental
consequences. Grossman and Krueger (1993) found that more liberal trade through easier
access to US market has generated income growth in Mexico to the level that was powerful
enough to encourage the government for environmental protection. Since Mexico was
characterized by labor-intensive industry and agriculture sectors in their export, pollution
reduction was inevitably to take place. Antweiler et al. (1998) supported the argument that
freer trade leads to pollution reduction as shown by their estimation that a rise in GDP per
capita by 1% from trade liberalization will decrease the sulphur dioxide concentration
about 1%.
Meanwhile, opposite results have been found in other studies, particularly in the
case of developing countries. Developing countries are likely to specialize and export
pollution intensive sectors due to their characteristics of lack of environmental regulations
with greater capacity to absorb pollution. In this case, trade liberalization could hamper
environmental quality. Copeland and Taylor (1994) concluded that liberalized trade
increases pollution levels in South countries with low level of human capital and decreases
pollution levels in North countries with high level of human capital. Cole et al. (1998)
estimated that the emissions in five pollutants (nitrogen dioxide, sulphur dioxide, carbon
monoxide, suspended particular matter, and carbon dioxide) in most developing countries
would increase after Uruguay Round of trade negotiations.
Based on the previous studies, trade liberalization may have positive or negative
impacts on the environment depending on comparative advantage of the country. Policy
coordination among trading partners is very limited and the environmental issues are
generally neglected in trade agreements. Hence, linking better environmental management
with trade negotiation is necessary to maintain the sustainability of the environment. This
study will provide better understanding of the environmental consequences of Free Trade
Agreements (FTAs) in the case of negotiation and implementation of Comprehensive
Economic Partnership Agreement (CEPA) between EU (European Union) and Indonesia.
The relations between Indonesia and EU member states have been marked by
strong economic relations: the EU remains the third largest destination of Indonesian
exports, and certain EU member countries have consistently been the main sources of
foreign investment in Indonesia. However, since EU has dynamic and larger economy with
its growing demand for Indonesia products especially in furniture, vegetable oils and
135
footwear products. Creating new export opportunities in the ASEAN markets is a priority
under the EU's Global Europe trade strategy. From China‘s perspective, China wanted to
make ASEAN as its source of raw materials for industrialization (Bernardino, 2004).
As time goes by, negotiating directives obtained in 2014 by EU-Indonesia the scope
of tariff reduction in an EU-Indonesia bilateral context is limited by the existing level of
tariff liberalization especially within the framework of WTO and ASEAN. A simple
comparative analysis of tariff lines shows that those already relative low. The simple
average of MFN tariff applied, is 5,3% for the UE (2009) and Indonesia (2007) The Vision
Group therefore recommends a move to zero tariffs for 95% of tariff lines (covering at
least 95% of tariff line (covering at least 95% of trade value). Moreover, the Vision Group
recognizes that in asymmetrical relationship the speed of implementation of tariff
reductions takes into account the different levels of development. Still, as 60% of the tariff
lines of the two parties are between 0 and 5% and 20% are already at zero, gains from
tariff measures would be expected to be small.
Different speeds should apply to different products of different ―sensitivities‖. The
least sensitive ones should be liberalized faster with the greater parts of commitment
implemented at the time of entry into force of the agreement. The most sensitive ones
should be liberalized more slowly.
Finally, safeguards and provisions on sensitive sectors may be incorporated. At the
same time, credibility and ambition would be negatively affected if such provisions and
their application would not remain truly exceptional and subject to objective criteria.
In relation to this, little research has been carried out in the context of
environmental consequences of free trade in a specific country. This study aims to fill this
knowledge gap by assessing the possible implications of trade on the environment from the
perspective of a specific country, which is Indonesia in this case. Then, Indonesia-EU
CEPA was selected as a case study to estimate the possible impacts of FTA on any change
in the trade flows and the environment through the use of trade-environment matrix.
2. Method
To evaluate whether freer trade will lead to environmental degradation, the method
has to be able to measure the environmental consequences of production activities caused
by trade, and consider the interaction between trade, income, and environmental quality
(Vutha and Jalilian, 2008). In this study, we employed an adjusted method to estimate the
effects of trade on pollution levels based on industrial pollution projection system from
Hettige et al. (1995) in World Bank. This method classified trade sectors into three
categories based on the amount of pollution emitted by their production and developed
trade-environment matrices to estimate pollution intensity. Through this method, we can
indicate the impact of trade on one feature of environmental deterioration which is
pollution. Even though this study realizes the shortcomings of using only pollution data to
indicate the impact on the environment, this can be an initial point for further research.
The adjusted method in this study estimated industrial emission to the air, water and
land and also the sum of emissions to all mediums using value of output, value added, and
136
employment. To measure the impacts of trade on pollution levels, we use pollution
intensity levels for all media emitted by physical volume of output valued at one million €.
Then, trade sectors are classified into three categories based on pollution emission using
polluting sectors, referring to those with toxic pollution of less than 500 pounds per
million € of production Harmonized System (HS) for product classification: most
polluting sectors or pollution-intensive sectors, referring to those with total toxic pollution
of more than 1,500 pounds per million USD of production; moderately polluting sectors,
referring to those with total toxic pollution level of 500 to 1,500 pounds per million USD
of production; and least polluting sectors, referring to those with toxic pollution of less
than 500 pounds per million USD of production
Then, this study will construct a trade-environment matrix using data from the
export trade matrices from Indonesia to EU by assuming that increasing exports will lead
to increase production and a simultaneous change in pollution levels. In the tradeenvironment matrix, the rows classified traded sectors based on their level of pollution
emission. The first column records time frames in the trade relationship between Indonesia
and EU CEPA (2014). The second column depicts the relative share of the product to total
trade, while the third column presents estimated pollution intensity (EPI), which is
calculated from the World Bank study by Hettige et al. (1995) to measure the pollution
level generated by the value of final products in million € .
3. Results
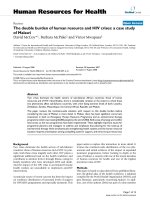
Table 4. Trade-environment Matrix for Indonesia’s Exports to EU
Source: Author estimation based on data from UN COMTRADE.
Table 4 presents a trade-environment matrix for Indonesia‘s exports to EU. It
suggests that Indonesia exported about 2,5$ billion of the most polluting sectors to EU in
2016, or 18% of total exports, with pollution intensity generated by the production
estimated at 19 million pounds. Even though its portion of total exports has been
137
decreasing, its pollution intensity has been increasing after three years of Indonesia-EU
CEPA implementation and its contribution to pollution intensity still remained the largest.
This significant increase is mostly due to the dramatic acceleration of export growth in
chemicals sector in response to greater demands from China.
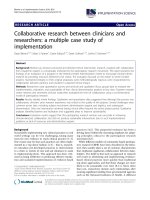
Figure 1. Diagram of Estimated Pollution Intensity (EPI)
Total Estimated Pollution Intensity
Estimated Pollution Intensity (EPI)
18,688
19,031
18,480
15,349
14,484
1,165
1,004
924
2014
Most Polluting sectors
14,934
2015
Moderately polluting sectors
2016
least polluting sectors
For the moderately polluting sectors, the total amount of Indonesia‘s exports to EU
was $7,1 billion in 2016, or 49% of total exports. Since the production activities in these
sectors generate less pollution than the pollution intensive sectors, the pollution effects of
these exports were less significant, as shown by the EPI level of 15 million pounds.
Nevertheless, the amount of pollution emitted by these exports was larger after IndonesiaEU CEPA. This is mainly due to the improving export performance of animal and
vegetables fats oil from rising prices with its peak in 2014, particularly coal as the major
contributor in the mineral sector representing around 49% of the total export to EU.
The trade-environment matrix also demonstrates that Indonesia generated about
one-third of its total exports to EU from the least polluting sectors. Even though the share
of the least polluting sectors has been increasing after three years of the Indonesia-EU
CEPA implementation, the future effect of these trade sectors on pollution levels is likely
to be infinitesimal concerning that the estimated EPI of just around 1 million pounds.
4. Discussion and Conclusion
Based on previous research of Azizurrohman and Hartarto (2017), they found that
in ASEAN-China Free Trade Agreement (ACFTA), the pollution levels of Indonesia has
been increasing because there is no environmental regulation about the sustainability of
138
environment. Therefore, in this case, found that the pollution level in Indonesia has been
increasing even CEPA has the sustainability of environment regulations.
This study has exposed the general relationship between FTA, trade and the
environment through a case study of Indonesia-EU CEPA by examining the impact of
Indonesia-EU CEPA from the perspective of Indonesia as the largest economies in
ASEAN. It has been found that after three years implementation of Indonesia-EU CEPA,
the share of the most polluting sectors in total export from 2014 to 2016 has been declining
from 19% to 18%, the share of the moderate polluting sectors has been increasing from
46% to 49%, while the share of least polluting sectors in total export has been decreasing
from 35% to 34%. However, the estimated pollution is still high from 34,096 million
pounds to 35,129 million pounds over fifteen years. The significant rise in the estimated
pollution mostly came from higher demand of the moderately polluting sectors especially
on animal and vegetables products by EU particularly after the implementation of
Indonesia-EU CEPA. It has been recorded that the export value of chemicals to EU has
been gradually increasing, leaving the estimated pollution growing quickly. Even, the
contribution of pollution generated by chemical sector toward total estimated pollution
reached 45.8%. Since Indonesia-EU CEPA already contained agreement for cooperation
on environmental problems due to trade liberalization, chemical sector is necessary to be
considered in trade negotiations in order to mitigate negative impact of freer trade to the
environment since it is categorized as most polluting sector with significant increase in the
export production.
In conclusion, this study asserts that trade could be a source of environmental
issues, particularly in countries without strong regulatory frameworks or management
system. Hence, this study recommends that environmental issues need to be more
considered in trade negotiations between Indonesia and EU in order to lessen any negative
impact of trade to the environment.
5. Reference:
1. Antweiler, W., Copeland, B.R. and Taylor, M.S. (1998), “Is free trade good for
the environment?” NBER Working Paper Series, No. 6707.
2. Bernardino, N. Y. (2004), “The ASEAN-China Free Trade Area: Issues and
Prospects.” Regional Workshop Paper No. 6 (Manila: Asia-Pacific Network for Food
Sovereignty)
3. Copeland, B.R. and Taylor, M.S. (1994), “North-South trade and the
environment,” Quarterly Journal of Economics 109: 755-787.
4. Cole, M.A., Rayner, A.J. and Bates, J.M. (1998), ―Trade liberalization and the
environment: the case of the Uruguay Round.‖ World Economy 21 (3): 337-347.
5. Grossman, G.M. and Krueger, A.B. (1991), “Environmental impacts of a North
American Free Trade Agreement.” NBER Working Paper, No. 3914, November 1991.
6. Grossman, G.M. and Krueger, A.B. (1993), “Environmental impacts of a North
American Free Trade Agreement.” In P. Garder (ed.), the U.S.-Mexico Free Trade
Agreement. (Cambridge, Massachusetts, USA: MIT Press).
139
7. Grossman, G.M. and Krueger, A.B. (1995), “Economic growth and the
environment.” Quarterly Journal of Economics, Vol. 110 (2): 353-77.
8. Harris, M. J. (2004). “Trade and the Environment”. Tuft University.
9. Hartarto, R.B. and Azizurrohman, M. (2017), “Trade and Environment in
Indonesia: Study Case of ASEAN-China Free Trade Agreement (ACFTA)” Indonesian
Students Association Scientific Conference in Osaka University, Japan 2017.
10. Hettige, H., Martin, P., Singh, M. and Wheeler, D. (1994), “The industrial
pollution projection system.” Environment, Infrastructure and Agriculture Division
(PRDEI) of the Policy Research Department (Washington, D.C: World Bank).
11. Shafik, N. and Bandyopadhyay, S. (1992), “Economic growth and
environmental quality: Time series and cross-section evidence.” Policy Research Working
Paper No. WPS904 (Washington, D.C: World Bank).
12. Vultha Hing, Jalilian Hossein. 2008. Environmental Impact of ASEAN-China
Free Trade Agreement on the Greater Mekong Sub-Region. Cambodia Development
Resource Institue.
140