Attitude to and usage intention of high school students toward electric two-wheeled vehicles in Hanoi city
Bạn đang xem bản rút gọn của tài liệu. Xem và tải ngay bản đầy đủ của tài liệu tại đây (719.52 KB, 16 trang )
VNU Journal of Science: Economics and Business, Vol. 35, No. 2 (2019) 47-62
Original Article
Attitude to and Usage Intention of High School Students
Toward Electric Two-Wheeled Vehicles in Hanoi City
Trinh Thu Thuy*, Pham Thi Thanh Hong
Hanoi University of Science and Technology, No. 1 Dai Co Viet, Hai Ba Trung, Hanoi, Vietnam
Received 10 June 2019
Revised 11 June 2019; Accepted 24 June 2019
Abstract: In recent years, electric two-wheeled vehicles (E2Ws) including electric bicycles and
electric motorcycles have been used widely in Vietnam. Currently, the total number of E2Ws used
is 3 million and with an average growth rate of 13.33% an estimated 6 million E2Ws will be used
in 2024. E2Ws have been used widely among Vietnam’s youth. Based on the Theory of Planned
Behavior (TPB) of Ajzen (2005, 2016) [1, 2], the main purpose of this research is to identify
factors affecting the attitude to and intention of high school students in Hanoi city towards E2W
usage and their affected level. The analytical results show that the attitude towards E2W usage is
influenced respectively in descending order by (i) perceptions of economic benefit, (ii) usage
convenience, (iii) friendly environmental awareness, (iv) stylish design. Usage intention towards
E2Ws is determined respectively in descending order by (i) subjective norm, (ii) attitude toward
E2W usage, (iii) the attraction of motorcycles. Based on the research results, some proposals for
producers, authorities and policy-makers have been recommended.
Keywords: Electric two-wheeled vehicle, intention, attitude high school students.
1. Introduction *
The current total number of E2Ws used is 3
million vehicles [3], which is still a small figure
compared to the 49 million fuel motorcycles in
the whole country [4]. The average growth rate
of E2Ws in recent years is approximately
13.3% [5]. These figures indicate a potential
market in Vietnam for E2Ws in the coming
time.
Private vehicles, especially fuel motorcycles
and E2Ws, play the most important and
convenient role for urban residents and account
for 85-90% of the total number of trips by all
motorized
vehicles.
Meanwhile,
public
transportation meets only 10-15% of the total
1.1. Overview
Vietnam currently has 3.2 million cars and
49 million registered fuel motorcycles. The
average growth rate of personal vehicles is
7.3% for fuel motorcycles and 6.3% for cars.
Besides fuel motorized vehicles, two-wheel
electric vehicles have been increasingly used,
especially among the youth and in urban areas.
_______
*
Corresponding author.
E-mail address:
/>
47
T.T. Thuy, P.T.T. Hong / VNU Journal of Science: Economics and Business, Vol. 35, No. 2 (2019) 47-62
travel needs of people. By 2020 and 2030,
personal vehicles are estimated to still account for
75-80% and 60-65% of the total travel needs of
people, with public transport meeting 20-25% and
35-40% of the total travel needs [6].
The increase in the use of fuel motorized
vehicles cause serious environmental pollution
and serious traffic congestion in urban areas in
Vietnam. Emissions from fuel transport
vehicles are a cause of air pollution, and this is
one of the biggest factors that exacerbate
climate change. Fuel motorized vehicles emit
carbon dioxide, which creates the greenhouse
effect. Fuel motorcycles are one of the main
sources of CO and VOC emissions, which
cause air pollution and profoundly affect urban
residents’ health. Therefore, the reduction of
emissions from fuel transport vehicles becomes
an urgent issue in Vietnam.
E2Ws run on lead-acid batteries or iron
lithium batteries. E2Ws do not use gasoline fuel
and save energy. E2Ws do not discharge
emissions into the environment and help
diminish pollution. In the future, along with the
trend of developing and using electric vehicles
around the world, E2Ws can be used as a useful
alternative to fuel motorcycles in Vietnam.
E2Ws have many stylish designs, dimensions,
colors, which are suitable for young people's
taste. The average price of E2Ws is from 8-15
million VND per unit, which is a competitive
price compared to a fuel motorcycle. This study
aims to identify factors and their impact on the
attitude to, and the intention to use E2Ws of
48
young people in Hanoi, focusing mainly on
high school students.
1.2. Study area
Hanoi is the capital, the economic - social
and political center of Vietnam. Hanoi is
located in the North part of Vietnam, and is the
largest city of Vietnam with an area of 3,324
km2 and a total population of 7.65 million
people. Hanoi has 12 districts with a population
density of 2,279 people per km2, four times
higher than the average population density of
the whole country. The economic growth rate of
Hanoi is about 8.5%, higher than the economic
growth rate of all Vietnam (6.8%). The average
GDP per capita of Hanoi is about 86.04 million
VND (approximately 3,740 USD per capita).
The estimated population of Hanoi by 2030 is
9.13 million people, by 2040 9.93 million and
by 2050 10.73 million people [7]. The average
growth rate of fuel motorcycles and cars has
been 6.7% and 10.67% respectively from 2011
to 2016 [8].
According to the Register Office, Hanoi had
5,255,245 registered fuel motorcycles and
327,820 cars at the end of 2016. The average
growth rate of all motorcycles and cars was
6.7% and 10.67% respectively in the period of
2011-2016. On average, there are 470 fuel
motorcycles/1,000 people and 20 cars/1,000
people. The ownership rate of fuel motorcycles
in Hanoi is 1.5 times higher than the national
average ownership rate and higher than that of
other countries in the Asian region [8].
Table 1. Population, vehicles in Hanoi in the period 2010-2016
Year
2010
2011
2012
2013
2014
2015
2016
Population
(number of
people)
6,617,900
6,779,300
6,957,300
7,128,300
7,306,508
7,489,170
7,676,399
Fuel
motorcycles
(unit)
3,577,041
3,980,070
4,444,127
4,660,761
4,852,380
5,045,672
5,255,245
Cars
(unit)
Total vehicles
(unit)
180,396
218,507
226,810
231,960
255,658
275,938
327,820
3,850,582
4,301,247
4,778,526
5,002,883
5,228,797
5,454,385
5,741,200
Percentage of total vehicles (%)
Fuel motorcycles
Cars
Other vehicles
93.0
92.5
93.0
93.0
93.0
92.5
91.5
4.7
5.1
4.7
4.6
4.9
5.0
5.7
2.3
2.4
2.3
2.4
2.1
2.5
2.8
Source: Hanoi Department of Transport (2017) [9], Trinh Thu Thuy (2018) [5].
49
T.T. Thuy, P.T.T. Hong / VNU Journal of Science: Economics and Business, Vol. 35, No. 2 (2019) 47-62
y
The number of personal vehicles in Hanoi is
expected to increase. Besides that, Hanoi has
11,000 E2Ws of which 7,000 are electric
bicycles and 4,000 are electric motorcycles. In
addition, there are 88 electric cars used for
tourist services. On average, there are 11.02
electric motorcycles per 1,000 people and 47.21
electric bicycles per 1,000 people [9].
It is estimated that Hanoi will have 1.4
million E2Ws by the year 2024 if the E2W
growth rate reaches 13.5% per year, compared
to 6 million E2Ws in the whole country at
present [5].
Table 2. Forecast of personal vehicles and transport market share in Hanoi city for the period 2020-2030
Year
2020
2025
2030
Total number (units)
Automobiles Cars
843,042
623,420
1,404,364
1,091,467
1,954,738
1,532,195
Fuel motorcycles
6,099,273
7,002,347
7,506,430
Market share (%)
Public transport
20÷25
27÷31
35÷40
Personal vehicles
75÷80
69÷73
60÷65
Source: Hanoi Department of Transport (2017) [9].
2. Research context
2.1. Usage intention towards E2W
According to the Theory of Planned
Behavior (TPB), a behavioral intention is based
on an attitude toward the behavior, a subjective
norm and perceived behavioral control. A
behavioral intention is defined as an important
antecedent to future behavior. The strength of
intention indicates how much people attempt to
conduct the behavior. Therefore, understanding
behavioral intention results in a valuable
prediction about a given behavior [1, 2]. The
application of TPB has been conducted in some
studies on travel behavior, focusing on
behavioral
intentions
toward
public
transportation [10-12]. The theory of planned
behavior from intention to action has been
applied to study the relationship among beliefs,
attitudes, behavioral intention and actual
behavior
in
various
fields
including
transportation mode choices and particular
consumer behavior in use of vehicles [10, 13].
2.2. Attitude towards E2W usage
Attitude towards a behavior is the degree to
which performance of the behavior is positively
or negatively valued. According to the
expectancy-value model, attitude towards a
behavior is determined by the total set of
accessible behavioral beliefs linking the
behavior to various outcomes and other
attributes [1].
A positive attitude will encourage people to
choose, buy, use and stick with the products.
On the contrary, a negative attitude will not
support or limit the purchase or use of the
product [14]. Consumer attitude towards E2W
usage is based on the perception of consumers'
beliefs about economic benefits, the
convenience of using E2Ws, E2Ws’ design
style, environmental protection, and safety
awareness during E2W use, and an awareness
of environmental pollution and unsafe
conditions when using fuel motorcycles.
2.3. Subjective norm
A Subjective norm is the perceived social
pressure to engage or not to engage in a
behavior. Drawing an analogy to the
expectancy-value model of attitude, it is
assumed that the subjective norm is determined
by the total set of accessible normative beliefs
concerning the expectations of important
referents [1]. A subjective norm is an external
factor affecting a consumer’s decision-making
process [7, 15]. A subjective norm is affected
by the perception, and thinking of reference
groups or influential people such as family
members, friends and colleagues [10, 16]. In
addition to family and friends, businesses also
have a significant and direct impact on
consumer behavior such as through sales
advice, product policy, promotion policy,
customer service and guarantee policies [17].
T.T. Thuy, P.T.T. Hong / VNU Journal of Science: Economics and Business, Vol. 35, No. 2 (2019) 47-62
Influences of both electric and fuel
motorcycle brand names as well as customer
care policies have a significant impact on
consumers’ intention to use such fuel
motorcycles in Hanoi [16]. Brand name and
communication policy of businesses affect the
usage intention of bicycles and electric scooters
in India [18, 19]. The advertising effectiveness
of businesses has affected customers’ decisions
in buying bicycles in India [19] and the
willingness to buy electric cars in China [13].
2.4. Perceived behavioral control
Perceived behavioral control refers to
people’s perceptions of their ability to perform
a given behavior. Drawing an analogy to the
expectancy- value model of attitude (see
attitude toward the behavior), it is assumed that
perceived behavioral control is determined by
the total set of accessible control beliefs, i.e.,
beliefs about the presence of factors that may
facilitate or impede performance of the
behavior [1, 2]. Perceived behavioral control
has a strong impact on the decision making to
buy fuel motorcycles in Vietnam [16] and affect
the intention to use bicycles in India [19] as
well as the intention to use the BRT in Thailand
[20]. However, Perceived behavioral control
has not affected the intention to use the metro in
Ho Chi Minh City [10].
2.5. Perception of economic benefits
The economic benefit is related to the
attribute of products that measure in economic
terms, the saving of operating cost in
comparison with an alternative vehicle such as
a motorcycle. Economic benefits are often
determined by product attributes, which are
internal factors affecting attitudes and
behaviors. Awareness of economic benefits is
often based on purchasing cost and the
operating cost of a vehicle. The purchasing
price of electric vehicles depends heavily on the
battery cost, which is the biggest obstacle to the
widespread dissemination of electric vehicles.
As battery costs decrease, the competitiveness
of electric vehicles will increase [21].
The lower price of electric motorbikes and
lower operating costs in comparison with other
50
vehicles is one of the reasons electric bicycles
are used in China [22, 23]. The operating cost
of a motorcycle in Vietnam is a factor affecting
the purchase of motorcycles [16]. The cost of
operating electric motorbikes in Vietnam and
India is lower than that of fuel motorcycles,
which encourages people to accept electric
motorbikes [18, 24].
2.6. Perception of usage convenience
Convenience refers to the comfortable
features of products that users have experience
in terms of flexibility, mobility, fuel recharge
and replacement of components and parts. The
speed and travel range of electric scooters
affected the popularity of electric scooters in
Taiwan in the 1990s [25]. The specifications of
electric bicycles such as speed, engine capacity,
travel range, comfort, and convenience have
increased the use of electric bicycles in China
[22, 23]. Efficient technology improvements for
electric scooters such as higher engine power,
higher speed and faster acceleration have
increased the use of electric motorcycles in
Hanoi. Conversely, long battery charging times
or slow acceleration will decrease the choice of
an electric motorcycle [24]. The characteristics
of electric bicycles, such as having a longer
range and relatively easy hill-climbing are the
advantages of electric bikes compared to pedalpowered bicycles, promoted a potential market
for electric bicycles in Portland, Oregon, USA
[26]. Durability, electric motor power and the
availability of spare parts are important factors
affecting the buying behavior for electric
motorcycles in India [18].
2.7. Perception of style design
Style design (size and weight) refers to
apparent features of a vehicle that affect the
taste of users. The electric scooter style was
widely accepted in Taiwan in the 1990s [25].
The preferred designs and brands of bicycles
have created competition in the market and
stimulated more bike usage in India [12, 19].
Fuel motorcycles’ stylish designs and brand
names are images stimulating consumers’
minds, being one of the factors that affect the
process of buying motorbikes in Vietnam [16].
51
T.T. Thuy, P.T.T. Hong / VNU Journal of Science: Economics and Business, Vol. 35, No. 2 (2019) 47-62
The design of electric motorbikes has made
electric motorbikes more widely accepted in the
Indian market recently [18].
In Vietnam, there are about 50-60 different
E2W designs in the E2W market. These are
relatively diverse and compact, and are suitable
for people of various appearances, ages, gender
as well as the diversified preferences of users.
2.8. Perception of usage safety
Safety is considered as the result of a user’s
experience in terms of perception of speed
safety and road safety. Electric vehicles have a
safer speed than those powered by gasoline
engines because of limitations in engine power,
speed and acceleration. A safe speed is one of
the reasons that electric motorbikes are widely
accepted in Taiwan [25] and electric bicycles
are used in China [22, 23].
Currently, there are no statistics on
accidents caused by two-wheeled electric
vehicles in Vietnam. Two-wheeled electric
vehicles have been controlled for safe speeds
and engine capacity by technical standard
regulations issued by state official agencies.
According to
the
National
technical
standardized regulations for electric bikes by
the
Ministry
of
Transport
(Circular
No.30/2013/TT-BGTVT dated November 1,
2013), electric bicycles have a maximum speed
of no more than 25 km/h and motor power is no
higher than 250W. Electric motorcycles have a
maximum speed of no more than 50 km/h and a
motor power of no higher than 400W. This
standard regulation ensures safety for E2W
users during their operation because E2Ws only
reach a maximum speed of 35-60 km/h.
2.9. Perception of environmental friendliness
Environmental concerns have a direct strong
impact on people’s behavior in specific
environmentally related domains like recycling,
energy saving, buying environmentally friendly
products or travel mode choices. Environmental
perception
includes
the
perception
of
environmental pollution, environmental knowledge
and energy saving on a user’s behavior.
Environmental and energy efficiency issues
have rapidly increased the number of electric
motorcycles in Taiwan [25]. Electric bicycles
are considered friendly environmental vehicles,
attracting more interested people and increasing
usage in India. The electric bicycles with
outstanding features such as no fuel
consumption and no carbon emissions have
high potential for the strong development of the
electric bicycle market in comparison with
gasoline motorcycles in India in the future [18].
Electric vehicles do not use fuel and have
no emissions into the environment. Using an
E2W results in cost-efficiency, convenience,
and are relatively energy-saving compared to
other competitive vehicles. However, E2Ws use
lead-acid batteries so their impact on the
environment needs to be considered. But due to
technological improvement, the feasibility of
lithium ion batteries will mean the replacement
of lead acid batteries, making electric bicycles
more energy efficient and will significantly
diminish environmental pollution [22].
2.10. Attraction of alternative vehicles
An attractive alternative to E2Ws is fuel
motorcycles - one of the most popular vehicles
used in Vietnam which users prefer to substitute
for E2Ws. Fuel motorcycles have some
attributes, which are better than that of E2Ws
such as speed, engine power, longer travel
distance, and are easy to recharge with fuel, etc.
The attraction of fuel motorcycles as well as
the habit of using personal vehicles has had an
adverse impact on the intention to use the metro
in Ho Chi Minh City [10], where there are more
than 7.2 millions motorbikes with a personal
ownership rate of 865 vehicles/1,000 people
[27], accounting for 92% of the total number of
vehicles [4].
2.11. Social and demographic factors
The electric motorcycle market in Taiwan is
divided by gender between men and women.
Women are more responsive to the design of
electric scooters. Age, educational level and
many motorcycles in a household are also
factors affecting the choice of electric
T.T. Thuy, P.T.T. Hong / VNU Journal of Science: Economics and Business, Vol. 35, No. 2 (2019) 47-62
motorbikes. People with a higher educational
level tend to use electric scooters more and pay
more
attention
to
the
technological
improvements of vehicles and environmental
pollution caused by traffic [25].
The social - demographic factors such as
age, gender, educational level and income
indicate the differences in buying electric
scooters in India [18, 19]. In India, people with
a higher income and a higher educational level
tend to buy more electric scooters while young
people between 15 and 25 years old will show
more interest in electric motorbikes than other
age groups [18, 19]. Educational level has a
significant impact on the decision to use electric
motorbikes in Hanoi city, while gender does not
make any difference. People with a higher
educational level more easily accept electric
motorcycles [25].
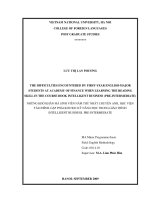
3. Objectives, research model and hypothesis
The main objective of this study is to
identify factors affecting the attitude and
intention to use E2Ws and their influence level
in Hanoi city.
Perception of
economic benefit
Perception of
usage convenience
H4 +
Perception of convenience in
replacing components
By applying TPB theory to a contextual
study of Vietnam and adjusting the TPB model
in accordance with the actual situation of
Vietnam and Hanoi city, a specific research
model is proposed to explore factors affecting
attitude to, and use intention towards E2Ws in
Vietnam. From the fuel motorcycle usage in
Hanoi, we adjust the TPB model and construct
additional factors of motorcycle attraction to the
model and other antecedent factors affecting
attitude towards E2W use.
Exploratory Factor Analysis (EFA) has
confirmed the research model with 12 factors
affecting directly and indirectly use intention
towards E2W. Intention to use E2Ws is
influenced by five factors: attitude towards E2W
usage, subjective norm, perceived behavioral
control, business’s sale promotion and attraction
of fuel motorcycles. Attitude towards E2W usage
is influenced by seven factors: perception of
economic
benefits,
usage
convenience,
convenience in replacing components, size weight, use safety, environmental friendliness,
environmental pollution and unsafety caused by
fuel motorcycles.
H11
Attitude toward
E2W usage
Subjective norm
H6 +
H2 +
H1 +
H13 +
H3 +
H7 +
Perception of
usage safety
H11
Intention to
use E2W
Business’s sale policy
Perception of
size - weight
Perception of enviromental
friendliness
Social - demographic
characteristics of users
H5 +
H12+
Perceived behavioral control
H10 -
H8 +
Perception of enviromental H9 +
pollution and unsafety of using
fuel motorcycle
52
Attraction of
fuel motorcycle
Figure 1. Research model and hypotheses after exploratory factor analysis EFA.
53
T.T. Thuy, P.T.T. Hong / VNU Journal of Science: Economics and Business, Vol. 35, No. 2 (2019) 47-62
Table 3. Factors and hypotheses
Factors
Attitude towards E2W usage
Subjective norm
Perceived behavioral control
Perception of economic benefit
Perception of convenience
Perception of size - weight
Perception of safety
on E2W usage
Perception of environmental
friendliness
Perception of environmental
pollution and unsafety of
gasoline motorcycle
The attraction of fuel motorcycle
Social
demographic
characteristic of users
Perception of convenience in
replacing components
Business’s sale policy
Expected relations
Hypothesis H1: Positive attitude toward E2W usage encourages people’s
intention to use E2Ws.
Hypothesis H2: Subjective norm positively affects usage intention toward
E2Ws.
Hypothesis H3: Perceived behavioral control affects positively usage
intention toward E2Ws.
Hypothesis H4: Perception of economic affects positively attitude toward
E2W usage.
Hypothesis H5: Perception of convenience positively affects intention to
use E2Ws.
Hypothesis H6: Perception of size and weight tastes has significant
influence on attitude towards E2W usage.
Hypothesis H7: Perception of safety on E2W usage affects positively
intention to use E2Ws.
Hypothesis H8: The better perception of environmental awareness, the
better attitude towards the usage intention of E2Ws.
Hypothesis H9: The better perception of environmental pollution and
unsafety of using fuel motorcycle, the better attitude towards the usage
intention of E2Ws.
Hypothesis H10: The attraction of fuel motorcycle has negative affect to
usage intention of E2Ws.
Hypothesis H11: Social - demographic characteristics of users has
differential affect to attitude to and intention toward E2W usage.
Hypothesis H12: Perception of convenience in replacing components has
positively affect attitude of E2W usage.
Hypothesis H13: Business’s sale policy affects positively attitude towards
E2W usage.
h
4. Methodology
4.1. Research design
In order to develop the research model and
testing, the research was conducted by two-step
methodology. The first step was primary
research, which applied a desk research method
and the second step was exploratory research,
which applied a qualitative and quantitative
research method.
Exploratory research: Exploratory research
was implemented using a qualitative research
method. Data collection was gathered by indepth interviews and focused on group
interview techniques. Exploratory research was
conducted initially to collect fundamental
information known as the qualitative research
method to identify the factors most relevant to
the study context and to have a better
understanding of the potential influence of these
factors on attitude and usage intention towards
electrical two-wheeled vehicles. In addition,
this exploratory research helped confirm the use
intention as the key responsive variable to be
researched in the second survey stage.
In-depth interviews: The psychological
characteristics of E2W users may internally
drive users’ responses to electric two-wheeled
vehicles. These interviews were conducted with
key knowledgeable people such as directors,
technical managers, sales’ managers, marketing
managers, etc. in E2W manufacturer, who have
been directly responsible for collecting and
analyzing information regarding the electric
vehicle market, consumers’ taste and needs,
brand names of various E2Ws, government
policies
and
regulations
relevant
to
electric vehicles.
T.T. Thuy, P.T.T. Hong / VNU Journal of Science: Economics and Business, Vol. 35, No. 2 (2019) 47-62
Focus group interviews: The interviews
were conducted before a large-scale interview.
Data was gathered from groups of E2W users in
Hanoi city. The group interviews are useful to
54
have a better understanding of the perception,
attitude and the usage of consumers, which has
assisted in identifying more accurate
research issues.
Table 4. In-depth interviews and Focus group interviews
No.
1
2
3
Interviewees
Directors, technical managers, sale managers,
production managers in the E2W manufacturers
Sale staffs, customer care staffs, technical staff
at the E2W stores and agents
E2W users in Hanoi
Total
Number of interviewees (persons)
14
10
20
44
Source: Trinh Thu Thuy (2018) [5].
In-depth interviews and focus target group
interviews helped us to construct a scale of
variables for each factor. The interviews were
conducted using semi-structured questions,
which assisted in gaining insights into specific
information and close discussion.
Qualitative method: EFA is applied to
identify factors affecting attitude and usage
intention toward E2Ws for high school students
in Hanoi.
4.2. Questionnaire design
Based on the hypotheses, a questionnaire
survey with the stated preferences was
developed to understand the attitude and use
intention of E2W users.
The survey questionnaire is divided into 4
parts. Part I is general information on E2Ws.
Part II is psychological questions to find out the
perception of E2W users as well as their
attitude and intention toward E2W usage. Part
III is to collect other data on E2W usage. Part
IV is personal information.
Part 1 includes information related to E2Ws
such as type of E2Ws, brand, price and
production place. Part 2 consists of
psychological statements with an ordinal scale.
The respondents were asked whether they
agreed or disagreed with the 44 statements or
variables, which are divided into 11 factor
groups. Their given answers were judgments on
a five-point Likert scale, ranging from 1 =
strongly disagree to 5 = strongly agree. Part 3
consists of questions related to E2W usage such
as the purpose of E2W usage, how often E2Ws
are used, limitation of using E2Ws and change
to other vehicles if possible. Part 4 includes
some personal information such as gender, age
and educational level.
4.3. Data collection
Hanoi has 180 high schools and 190,934
students [7]. Data were collected from ten high
schools in Hanoi through 300 survey
questionnaires,
averaging
30
survey
questionnaires for each high school. These
schools are located in crowded areas, scattered
through 6 districts in Hanoi. The sample focused
on teenagers from 15 to 18 years old or from 10th
to 12th grade. The interviews were at lunchtime,
school break time or after school time and lasted
for 45-60 minutes.
Over 2 months, from September 2017 to
November 2017, 238 survey questionnaires
were collected with sufficient information. The
response rate to the survey questionnaires was
nearly 80 percent. 238 survey questionnaires
were sufficient to implement an EFA.
According to Hair et al. (2006), the minimum
sample for an EFA is 100 units. According to
Bollen (1989), the sample size in comparison
with variables must be at least 5:1 or the
minimum sample size must be five times the
number of variables [28].
55
T.T. Thuy, P.T.T. Hong / VNU Journal of Science: Economics and Business, Vol. 35, No. 2 (2019) 47-62
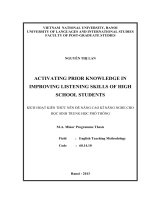
4.4. Data analysis
With the support of SPSS (Statistical
Package for Social Science) and AMOS
(Analysis of Moment Structure) software, data
analysis was implemented through 5 steps as
follows: (i) Statistic description, (ii) Reliability
analyses: Cronbach’s Alpha test and EFA, (iii)
k
Model fitness test, (iv) Analysis with structural
equation modeling, (v) Analysis of variance
(ANOVA) with t-test was conducted to find
significant differences in attitude and intention
to use E2Ws among different groups
of students.
Four steps of EFA.
Figure 2. Four steps to analyze EFA.
Source: Hoang Trong and Chu Nguyen Mong Ngoc (2008) [28].
5. Survey results and discussion
5.1. Statistics of survey
Gender and age: 69.4% is the
percentage of E2W use by female high school
students compared to 30.6% used by males.
E2Ws are used mostly by teenagers from 16-17
years old (respectively 42.2% and 43.5%).
Vehicles, brands and manufacture places:
46.6% of the E2Ws are electric motorcycles,
and 53.4% electric bicycles. Electric bicycles
are used more than electric motorbikes (1.06
times higher). The Nijia brand is used the most,
22.4% of the total, followed by Giant brand
with a rate of 18.2%, X-men brand 10.9%,
Momentum brand 7.8%, Aima has the lowest
rate of 1.2%, after Yadea 2.5% and Fuji 2.7%
and some other brands. E2Ws produced
domestically in Vietnam accounted for the
highest percentage of 40.1%; E2Ws produced
in China were 24.4%; from Taiwan, 15.5%;
from Japan 18% and from other countries 1.9%.
Vehicle usage duration and average travel
distance per day: 45.6% of the high school
students have used an E2W for more than one
year, 35.2% of the students have used an E2W
from 1-2 years, 15.3% of the students from 2-3
years, 1.6% of the students from 3-4 years and
only 1.9% of the students have used an E2W
for more than 4 years.
Teenagers or high school students are
potential customers for the E2W market. This
market segment will be sustainable and well
developed. 29.6% of the students using E2Ws,
on average, travelled less than 10km per day,
37.1% from 10-20km/day, 18.4%, from
20-30km/day, 11.2% from 30-40km/day, and
3.7%. travelled more than 40km/day. E2Ws are
convenient to use for short travel distances of
less than 30km/day in the inner urban area.
Distinguishing between electric bikes and
electric motorcycles: 94.8% of high school
students distinguished the difference between
electric bicycles and electric scooters, only
5.2% did not distinguish the difference between
these two vehicles.
Frequency of use and usage purpose:
97.1% of the high school students used an E2W
only as their means of transport, 2.3% of the
high school students used one less often, and
only 0.6% rarely used an E2W. 96.1% of the
students used an E2W to go to school daily,
moving mainly from home to their study
location, 27.1% used an E2W to go shopping
and to entertainment, 6.5% to go to exercise,
7.1% for part-time work and 11.4% for
other usage.
T.T. Thuy, P.T.T. Hong / VNU Journal of Science: Economics and Business, Vol. 35, No. 2 (2019) 47-62
Limitation of using E2Ws: 86.5% of the
high school students said that an E2W was
inconvenient when it was raining, 22.6% said
that an E2W was limited when there was a
traffic jam due to easily running out of battery,
29.8% said that an E2W was not convenient for
battery charging. 17.5% said that an E2W is not
convenient when there is no battery-charging
infrastructure. Fuel motorcycles are still the
dominant means that replace E2Ws when an
E2W is not being used (51.2%) or when there is
an opportunity to change from an E2W
(55.3%).
5.2. Factors affecting attitude and intention
towards E2W usage
Results from tests of Cronbach’s Alpha
(> 0.6), KMO and Barlett in SPSS indicate that
40 variables or scales are meaningful and
significant (see Appendix 1, Table 1). A
Principal component analysis (PCA) with
varimax rotation technique was employed to
identify factor groups affecting attitude and
intention toward E2W usage. The results of
EFA indicate 40 variables or scales were
divided into 13 factor groups (see Appendix 2,
3, 4, 5), in which, attitude toward E2W usage
was influenced by 7 groups of factors, namely:
perception of economic benefit, usage
convenience,
convenience
in
replacing
components, size - weight, usage safety,
perception of environmental friendliness,
perception of environmental pollution and
unsafety of using a fuel motorcycle. Intention to
use E2Ws was influenced by 5 groups of
factors, including: attitude toward E2W usage,
subjective norm, business’s sale policy,
perceived behavioral control, and attraction of
fuel motorcycles (Figure 1).
Structural Equation Model analyses (SEM)
indicates the research model fits with the survey
data (see Appendix 6, Figure 1). The test results
show the following:
There are significant relationships between
factors of perception of economic benefit, usage
convenience, size - weight, perception of a
friendly environment and attitude toward E2W
usage. And there are significant relationships
between factors of attitude toward E2W usage,
subjective norm, attraction of fuel motorcycles
and intention to use an E2W.
There are no significant relationships
between factors of replacement convenience of
components, usage safety, perception of
environmental pollution and unsafety of using
fuel motorcycle and attitude toward E2W
usage. There are no relations between factors of
business sale policies or perceived behavioral
control (Table 5).
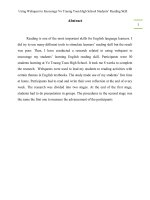
The analytical results (presented in Table 5)
show that attitude towards E2W usage is
descendingly influenced by (i) perceptions of
economic benefit, (ii) convenience in use, (iii)
environmental awareness, and (iv) stylish
design. Usage intention towards E2Ws is
determined respectively in descending order by
(i) subjective norm, (ii) attitude towards E2W
usage and (iii) the attraction of fuel motorcycles
(Figure 2).
Table 5. Standardized coefficient in SEM
TD
TD
TD
TD
TD
TD
TD
DD
<--<--<--<--<--<--<--<---
TK
LI
TH
MT
AT
XT
TT
XM
Unstandardized
coefficient
-.158
.363
-.041
.346
-.021
.037
.303
-.120
56
Standardized
coefficient
-.162
.465
-.076
.345
-.033
.057
.454
-.219
Standard
error
.059
.087
.037
.090
.051
.052
.059
.053
C.R.
P-value
-2.665
4.196
-1.100
3.865
-.405
.705
5.132
-2.249
.008
***
.271
***
.685
.481
***
.025
57
T.T. Thuy, P.T.T. Hong / VNU Journal of Science: Economics and Business, Vol. 35, No. 2 (2019) 47-62
DD
DD
DD
DD
<--<--<--<---
Unstandardized
coefficient
.028
.005
.281
.385
KS
DN
CC
TD
Standardized
coefficient
.032
.008
.522
.449
Standard
error
.090
.056
.070
.089
C.R.
P-value
.309
.085
3.990
4.344
.758
.932
***
***
Source: Research result from Trinh Thu Thuy (2018) [5].
Economic benefit
1. Purchasing cost
2. Operation cost
3. Registered cost
=0.465
Usage convernience =
0.4
1. Travel distance
54
2. Mobility and flexibility
3. Convenience in
narrow space
4. Time saving
5. Comfort
Size – weight
= 0.16
2
Attitude toward
E2W usage
1. Like to use
2. Good idea
3. Exciting
=
0.449
Intention to use
Subjective norm
E2W
1. Influence of family
2. Influence of friend =0.522 1.Permanent use
everyday
3. Influence of seller
2. Use in the future
3. Advise others to
Attraction of
use
= fuel motorcycle
0.219
1. Higher speed
2. Higher power
engine
3. More flexibility
=
Friendly environment
and mobility
0.4
1. No emissions
35
4. Easier to charge
2. Energy saving
with fuel
3. No noise
5. Longer travel
distanctacne
Figure 2. Factors impacting on intention to use E2Ws of high school students in Hanoi.
Source: Research result from Trinh Thu Thuy (2018) [5].k
1. Smaller dimensions
2. Lighter weight
Testing the significant differences between
groups: ANOVA test results showed that there
was an insignificant difference in attitude and
intention to use E2Ws between male and female
student groups, and between different
age groups.
5.3. Main findings and implications
The research results have met the initial
research purpose. The main findings show
seven groups of factors affecting attitude:
perception of economic benefits, usage
convenience,
convenience
in
replacing
components, size - weight, use safety,
environmental friendliness, environmental
pollution and unsafety caused by fuel
motorcycles. Intention to use E2Ws is
influenced by five factors: attitude towards
E2W usage, subjective norm, perceived
behavioral control, business’s sales’ promotion
and attraction of fuel motorcycles
The attitude toward E2W usage is
influenced respectively in descending order by
(i) perceptions of economic benefit, (ii) usage
convenience, (iii) friendly environmental
awareness, (iv) stylish design. Usage intention
towards E2Ws is determined respectively in
T.T. Thuy, P.T.T. Hong / VNU Journal of Science: Economics and Business, Vol. 35, No. 2 (2019) 47-62
descending order by (i) subjective norm, (ii)
attitude toward E2W usage, (iii) the attraction
of fuel motorcycles.
Factors such as convenience in replacing
components, size - weight, use safety,
environmental pollution and unsafety caused by
fuel motorcycles have no significant
relationships with attitudes toward E2W usage
and factors of perceived behavioral control and
business’s sales’ promotion have no significant
relationships with intention to use E2Ws.
This research and its findings have not been
explored in any previous research in Vietnam
and in any other studies on electric vehicles
with the new approach from the psychology of
consumer’s behavior towards E2W.
Some implications are proposed from the
research results:
E2W producers may expand E2W sales in
the market by reducing production costs in
terms of operation costs to compete with fuel
motorcycles, establishing professional sales and
sales consultants, and improve and innovate
E2W attributes in terms of enhancing usage
convenience such as longer battery life with
shorter charging time and diversifying
stylish designs.
Local authorities and policy-makers may
encourage effective E2W usage to replace fuel
motorcycle usage in order to reduce air pollution
in Hanoi city by controlling and limiting fuel
motorcycle usage, enhancing perception and
attitude of consumers towards friendly, green
products, encouraging E2W usage for short
distance travel in the city, managing and
controlling E2W quality to increase E2W usage,
researching and developing new technology in the
battery industry, enabling the replacement of leadacid batteries and orienting to develop the E2W
industry and electric vehicle industry in the
near future.
In the coming time, this research model
should be expanded to study more latent
variables, scales and scale levels, which have
not been included in this research and research
areas should be expanded to various cities,
regions, and provinces with different ages and
occupations of consumers.
58
6. Conclusion
The advantage of various stylish designs,
compact size, ease of control, ease of operation
and smooth running, make E2Ws suitable for
youth, especially for pupils and students. E2Ws
are convenient for travel in narrow and small
lanes with many intersections and are
convenient in narrow spaces for stopping
and parking.
However, due to limitations in battery
technology and the travel distances possible per
charge means E2Ws are more convenient for
travelling short distances in urban areas. In
addition, the battery life is relatively short. All
of these factors have limited the adoption of
E2Ws for personal transport.
The results of this research may help
producers to manufacture E2W products
suitable for the consumer’s taste if producers
want to expand their market share of E2Ws and
increase their sales. The results of this research
may also help authorities and policy-makers to
understand more about the behavior of E2W
users, especially the youth, to more efficiently
manage and control E2Ws, which are
prominent personal transport vehicles in
Vietnam’s urban areas,
Acknowledgements
The authors would like to acknowledge the
financial support from the School of Economics
and Management, Hanoi University of Science
and Technology.
References
[1] I. Ajzen, Attitude, personality and behavior, 2nd
Edition, England: Berkshire, 2005.
[2] I. Ajzen, The Theory of Planned Behavior.
aizen/pdf.html/, 2016.
[3] Tran Thuy, “Located fuel motorcycles, remote
controls, and accident notices: a mother buys to
supervise
her
child”.
2018.
[4] National Traffic Safety Committee, “The study on
the traffic safety of highschool students in Hanoi
and some proposed solutions”, Final Report,
59
[5]
[6]
[7]
[8]
[9]
[10]
[11]
[12]
[13]
[14]
[15]
[16]
[17]
[18]
T.T. Thuy, P.T.T. Hong / VNU Journal of Science: Economics and Business, Vol. 35, No. 2 (2019) 47-62
Vietnam
Association
of
Motorcycle
Manufacturers VAMM, 2017.
Trinh Thu Thuy, “Factors affects consumer’s
behavior towards two-wheeled vehicles in Hanoi
city”, Doctorate Dissertation, Hanoi University of
Science and Technology, 2018.
Jica, Data Collection Survey on Railway in Main
Urbans of Vietnam, final report, Part 2, Hanoi
area, November, 2015.
Statistic
Office
of
Hanoi.
2018.
Nguyen Minh Tam, “Planning Orientation of
Hanoi’s Urban Railway System to 2030 and
Vision to 2050”, International workshop report,
Hanoi
Planning
and
Architecture
Department, 2017.
Hanoi Department of Transport, “Scheme on
strengthening management of road transport
means to reduce traffic congestion and
environmental pollution in Hanoi city, period
2017-2020, a vision to 2030”, General report,
Hanoi People’s Committee, 2017.
Dang Thi Ngoc Dung, “Factors Affect Intention
Usage Toward Metro System in Ho Chi Minh
City” Master Thesis, Ho Chi Minh Economics
University, 2012.
Le Quan Hoang, Toshiyuki Okamura, “Influences
of Motorcycle Use on Travel Intentions in
Developing Countries: A case of Ho Chi Minh
City, Vietnam”, Journal of Eastern Asia Society
of Transportation Studies 11 (2015) 1555-1574.
M. Ronald, T. Debasis, “A Study on consumer
buying behavior toward two wheeler bikes in
context to Indian market”, International Journal of
Advanced Research in Management (IJARM) 4
(2013) 65.
W. Ning, L. Yafei, “Key factors influencing
consumers’ willingness to purchase electric
vehicles in China”, School of Automotive Studies,
Tongji University. Volume II, November (2015)
911-955.
Chu Tien Dat, “Consumer behavior and marketing
- mix strategy of mobile communication
businesses in Vietnam”, Doctorate Dissertation,
National Economic University, 2014.
D.W. Hoyer et al., Consumer Behaviour, 6th
Edition, South Western Cengage Learning, 2013.
Nguyen Ngoc Quang, “Qualitative Methods in
Research on Consumer’s Behavior Toward
Motorcycle in Vietnam”, Doctorate Dissertation,
Hanoi National Economic University, 2008.
P. Kotler, G. Amstrong, Principles of Marketing,
15th Edition, Pearson Prentice Hall, 2014.
R. Pranav, B. Yuvraj, S. Razia, “Assessment of
consumer buying behavior toward electric
[19]
[20]
[21]
[22]
[23]
[24]
[25]
[26]
[27]
[28]
scooters in Punjab”, International Journal of
Research in Commerce and Management 4 (2013)
7-15.
S. Sheetal, S. Abhishek, “Consumer Behavior
towards Two-Wheeler Bikes - A Comparative
Study of Rural and Urban Consumers of Jodhpur
District of Rajasthan, India”, Research Paper,
Global Research Analysis 1 (2012) 91-92.
K. Rattanaporn, S. Wichuda, J. Sittha, S. Thaned,
“Psychological factors influencing intentions to
use Bus Rapid Transit (BRT) in Khon Kaen,
Thailand”, Proceedings of the Eastern Asia
Society for Transportation Studies 10 (2015).
S. William et al., “The influence of financial
incentives and other socio-economic factors on
electric vehicle adoption”, Journal of Energy
Policy 68 (2014) 183-194.
R.C. Christopher, Electric Two-Wheelers in
China: Analysis of Environmental, Safety, and
Mobility Impacts, PhD Dissertation, University of
California, Berkeley, Spring 2007.
X.W. Jonathan, The Rise of Electric Twowheelers in China: Factors for their Success and
Implications for the Future, Doctor of Philosophy
In Transportation Technology and Policy,
University of California, 2007.
R. Luke et al, “The effect of incentives and
technology on the adoption of electric
motorcycles: A stated choice experiment in
Vietnam”, Transportation Research Part A
57, 2013.
Ch. Yi-Chang, T. Gwo-Hshiung, “The market
acceptance of electric motorcycles in Taiwan
experience through a stated preference analysis”,
Transportation Research, Pergamon, Part D 4,
January 9, 1999, pp. 127-146 (Published by
Elsevier Science Ltd).
D. Jennifer, R. Geoffrey, “Electric Bikes and
Transportation Policy: Insights from Early
Adopters”, Transportation Research Record:
Journal of the Transportation Research Board, No.
2314, Transportation Research Board of the
National Academies, Washington, D.C., 2012,
pp. 1-6.
Ho Chi Minh Department of Transport, General
Report: “Schme on strengthening management of
road transport means to reduce traffic congestion
and environmental pollution in Hanoi city, period
2017-2020, a vision to 2030”, General report,
Hochiminh People’s Committee, Department of
Transportation, 2017.
Hoang Trong, Chu Nguyen Mong Ngoc, Data
Analysis with SPSS, Hong Duc Publishing House,
Ho Chi Minh City, 2008.
T.T. Thuy, P.T.T. Hong / VNU Journal of Science: Economics and Business, Vol. 35, No. 2 (2019) 47-62
60
u
APPENDIX 1
Table 1. Test of KMO and Bartlett
First
round
Second
round
KMO efficient
(Kaiser-Meyer-Olkin Measure of Sampling Adequacy)
Approx. Chi-Square
df
Bartlett’s Test of Sphericity
Sig.
KMO efficient
(Kaiser-Meyer-Olkin Measure of Sampling Adequacy)
Approx. Chi-Square
Bartlett’s Test of Sphericity
0.752
1,713.999
276
0.000
Test of two rounds:
0.7 < KM0 < 0.8
Sig. = 0.000 < 0.05
satisfy to EFA
0.738
1,115.833
df
91
Sig.
0.000
Source: Trinh Thu Thuy (2018) [28].
APPENDIX 2
Table 2. Total Variance Explained - TVE
Component
1
2
3
4
5
6
7
8
9
10
11
12
13
14
15
16
17
18
19
20
21
22
Total
4.433
2.878
1.805
1.600
1.353
1.183
1.095
0.938
0.866
0.685
0.682
0.638
0.557
0.517
0.462
0.424
0.374
0.363
0.337
0.303
0.277
0.229
Initial Eigenvalues
% of
Cumulative %
variance
20.151
20.151
13.083
33.235
8.203
41.438
7.275
48.712
6.148
54.861
5.377
60.238
4.977
65.215
4.262
69.477
3.936
73.413
3.113
76.526
3.102
79.628
2.902
82.529
2.530
85.059
2.349
87.408
2.102
89.510
1.929
91.439
1.700
93.139
1.651
94.790
1.530
96.321
1.376
97.697
1.261
98.958
1.042
100.000
Extraction Sums of Squared Loadings
Total
4.433
2.878
1.805
1.600
1.353
1.183
1.095
% of variance
cumulative %
20.151
13.083
8.203
7.275
6.148
5.377
4.977
20.151
33.235
41.438
48.712
54.861
60.238
65.215
Rotation Sums of Squared Loadings
% of
Total
umulative %)
variance
2.747
12.484
12.484
2.247
10.215
22.700
2.145
9.751
32.451
1.962
8.920
41.371
1.807
8.213
49.585
1.727
7.852
57.436
1.711
7.779
65.215
Extraction Method: Principal Component Analysis.
APPENDIX 3
Table 3. Rotated Component Matrixa . First Round
Variable
LI1
LI2
LI3
TT1
TT2
1
0.530
0.528
2
3
Factor loadings
4
5
0.723
0.826
0.617
6
7
T.T. Thuy, P.T.T. Hong / VNU Journal of Science: Economics and Business, Vol. 35, No. 2 (2019) 47-62
61
TT3
TT4
TT5
TT7
TT8
TK2
TK3
AT1
AT2
AT3
MT1
MT2
MT3
XT1
XT2
XT3
XT4
0.792
0.803
0.763
0.784
0.837
0.843
0.782
0.510
0.798
0.701
0.776
0.690
0.720
0.536
0.732
0.792
0.653
Extraction Method: Principal Component Analysis. Rotation Method: Varimax with Kaiser Normalization.
a. Rotation converged in 8 iterations.
APPENDIX 4
Table 4. Total Variance Explained - TVE. Second Round
Initial Eigenvalues
Component
Extraction Sums of Squared Loadings Rotation Sums of Squared Loadings
Cumulative
%
Total
% of
variance
Cumulative
%
Total
% of
variance
Cumulative
%
Total
% of variance
1
3.792
25.278
25.278
3.792
25.278
25.278
2.774
18.495
18.495
2
2.244
14.962
40.240
2.244
14.962
40.240
2.047
13.643
32.138
3
1.622
10.812
51.052
1.622
10.812
51.052
1.901
12.673
44.811
4
1.307
8.711
59.763
1.307
8.711
59.763
1.776
11.843
56.654
5
1.076
7.170
66.934
1.076
7.170
66.934
1.542
10.280
66.934
6
0.804
5.358
72.292
7
0.767
5.111
77.402
8
0.634
4.225
81.627
9
0.601
4.007
85.634
10
0.510
3.399
89.033
11
0.490
3.268
92.302
12
0.376
2.504
94.806
13
0.318
2.123
96.929
14
0.271
1.808
98.737
15
0.189
1.263
100.000
Extraction Method: Principal Component Analysis.
APPENDIX 5
Table 5. Rotated Component Matrixa. Second Round
Factor loadings
Variable
1
TĐ1
TĐ2
TĐ3
2
3
0.773
0.791
0.679
4
5
T.T. Thuy, P.T.T. Hong / VNU Journal of Science: Economics and Business, Vol. 35, No. 2 (2019) 47-62
CC1
0.784
CC2
0.863
CC3
0.683
CC5
0.869
CC6
0.888
KS1
0.828
KS2
0.827
XM1
0.777
XM2
0.834
XM3
0.567
XM4
0.737
XM5
0.708
62
Extraction Method: Principal Component Analysis. Rotation Method: Varimax with Kaiser Normalization.
a. Rotation converged in 6 iterations.
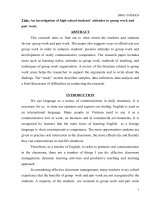
APPENDIX 6
Figure 1. Correlation and causal relationship between concepts in the model of exploratory factor analysis EFA.
Source: Research result from Trinh Thu Thuy (2018) [28].