The impact of financial inclusion on monetary policy: A case study in Vietnam
Bạn đang xem bản rút gọn của tài liệu. Xem và tải ngay bản đầy đủ của tài liệu tại đây (494.93 KB, 18 trang )
Journal of Economics and Development, Vol.20, No.2, August 2018, pp. 5-22
ISSN 1859 0020
The Impact of Financial Inclusion on
Monetary Policy: A Case Study in Vietnam
Nguyen Thi Truc Huong
University of Economics Ho Chi Minh City, Vietnam
Email:
Received: 25 September 2017 | Revised: 17 January 2018 | Accepted: 19 January 2018
Abstract
This paper examines the impact of financial inclusion (FI) on monetary policy (MP) – a case
study in Vietnam. The PCA method is used to construct a FI index- considered as a comprehensive
measure of FI. To answer the main research questions, OLS and GLS models are used to analyze
and to overcome the phenomenon of heteroskedasticity. Data is collected through secondary
sources including World Bank and IMF reports (for the period 2004-2015). The results of
empirical research indicate that there is a negative impact of FI on MP. Accordingly, FI transmits
to more successful MP, making efficient financial intermediation and balances, contributing to
a stable and sustainable economy. This study concludes that FI will enable monetary policy to
extend its reach to the financially excluded and aid policy makers to make better predictions of
movements in inflation.
Keywords: Financial inclusion (FI); financial services; monetary policy (MP).
JEL code: G2, G21, G28.
Journal of Economics and Development
5
Vol. 20, No.2, August 2018
1. Introduction
economy; accordingly, the way in which central banks implement MP is to rely on personal
access to financial services, including savings
and credit3. Obviously, there is consensus that
the expansion of formal financial services for
all segments of the economy will reduce informal financial services, increasing the capacity
and effectiveness of MP transmission (Lapukeni, 2015). This then shows the importance of
FI in the economy in general and contributes to
the effectiveness of MP in particular.
Nowadays, FI has emerged as an important
topic on the global agenda for sustainable economic growth. APEC economies and international organizations in general, and Vietnam
in particular, have been implementing FI as
an important part of their strategy to achieve
sustainable growth. This is because economic
opportunities are linked to access to financial
services, and that access particularly affects
the poor as it allows them to save, invest and
benefit from credit (Subbarao, 2009). Efforts
to enable most people to access formal financial services contribute to the overall efficiency
of the economy and the financial system. FI,
therefore, is seen as a tool to tackle the critical
issues of poverty and unsustainability (Alliance
for a FI, 2012). Especially for Vietnam, FI is
not only important but also a priority issue.
As a matter of fact, the level of access and use
of formal financial services in Vietnam is low
(only about 31% of adults have an account at a
formal financial institution, while the level is
98.7% in Singapore1. In Vietnam 39% of adults
save outside the formal sector, “under the mattress” or using informal means including savings’ clubs; 65% send or receive remittances
outside the formal system or pay school fees or
utility bills in cash2). In addition, due to the relatively small size of the financial market, ASEAN countries are vulnerable to external shocks
(Shimizu, 2014); and Vietnam is no different
from other countries in the same region. In particular, after the global financial crisis, FI issues are even more interesting. There is no denying that financial services are closely linked
to each country’s financial and economic standing. And MP is seen as a tool for stabilizing the
Journal of Economics and Development
The topic of FI in the past has attracted increasing interest of the academic community.
There are a number of studies on this subject,
but the research focuses on FI measurement and
promotion (e.g. Sarma, 2008; Hannig and Jansen, 2010; Demirguc-Kunt and Klapper, 2012;
Allen et al., 2016); the impact of FI on poverty
reduction, income inequality and growth (e.g.
Chibba, 2009; Manji, 2010; Park and Mercado, 2015; Sharma, 2016; Johal, 2016; Ghosh
and Vinod, 2017); or on financial stability (e.g.
Hannig and Jansen, 2010; Khan, 2011; Han and
Melecky, 2013; Morgan and Pontines, 2014;
Garcia, 2016). Meanwhile, there are only a few
studies examining the relationship between
FI and MP (Evans, 2016; Mehrotra and Nadhanael, 2016). Particularly in Vietnam as well
as in the ASEAN region, almost no research
exists on this topic. And this is considered to be
an exciting field for further research.
In addition, although there is consensus in
the understanding of FI, there is no comprehensive method to measure this (Amidžić et
al., 2014; Park and Mercado, 2015; Lenka and
Bairwa, 2016). Indeed, there is a shortage for
most economies in terms of a systematic indicator of the use of different financial services
6
Vol. 20, No.2, August 2018
lows. The next section provides an overview
of the related literature. Section 3 discusses the
data and methodology. Subsequently, I report
my findings and discussion in section 4. Finally, section 5 provides conclusion and policy
implications.
(Demirguc-Kunt and Klapper, 2012; Sethy,
2016). Therefore, the identification of factors
measuring the level of FI for Vietnam is very
necessary. The fact that empirical studies ignore the income component when examining
the effects of FI on MP has created a gap that
this study will fill when modeling income as
an intermediate factor. Because FI makes it
easy for people to access savings and borrowing tools, which help them improve their lives
and earn more, thus making MP more effective
(Mehrotra and Yetman, 2015; Khan, 2011). Experimental research results on the relationship
between FI and MP are sometimes contradictory. Evans (2016) argues that although there
is a one-way effect from MP effectiveness to
FI, there seems to be no impact in the opposite
direction. Lenka and Bairwa (2016) found a
significant impact of FI on the effectiveness of
MP; Lapukeni (2015) found that an increase in
FI would contribute to improving the effectiveness of MP. It is therefore worthwhile to study
the impact of FI on Vietnam’s economy by determining the impact of FI on the effectiveness
of MP, in order to make important conclusions
in establishing a reasonable MP which contributes to improving the effectiveness of MP
transmission, economic stabilization and sustainable growth.
2. Literature review
2.1. Financial inclusion
FI is a process that ensures the accessibility,
availability and use of official financial systems
for all members of the economy (Sarma, 2008)
at an affordable cost in a fair and transparent
manner (De Koker and Jentzsch, 2013), providing timely and adequate credit (Rangarajan, 2008; Joshi et al., 2014). In addition, when
referring to FI, Chakravarty and Pal (2013)
and Gwalani and Parkhi (2014) also focus on
access to financial services for the underprivileged and those of low-income. However,
FI here does not imply that service providers
ignore risks and other costs when deciding to
provide financial services (Hannig and Jansen,
2010). Therefore, with the World Bank4, FI
means individuals and businesses have access
to affordable financial products and services
that meet their needs and are implemented in a
way that is responsible and sustainable.
However, FI is a multidimensional concept
that cannot be accurately captured by individual indicators such as bank account ratios,
loans, automatic teller machines (ATMs) and
bank branches (Camara and Tuesta, 2014).
Therefore, efforts to measure FI through multidimensional indexes have been made. A series of FI dimensions are used to estimate this
problem (e.g. Demirguc-Kunt and Klapper,
2012; Gupte et al., 2012). But, the limitation
of these approaches is the development of FI
This paper employs the Principal Component Analysis (PCA) method to construct a FI
index - considered as a comprehensive measure
of FI in Vietnam. And to answer the question of
whether FI has an impact on MP in Vietnam,
OLS and GLS models are used to analyze and
to overcome the phenomenon of heteroskedasticity.
The rest of this paper is organized as folJournal of Economics and Development
7
Vol. 20, No.2, August 2018
And to achieve one of these targets, the Central
Bank often uses a variety of tools, including
three important tools: open market operations,
interest rate policy and mandatory reserve requirements (Bean et al., 2010; Hamilton et
al., 2012). Adediran et al. (2017) suggested
that studies by Bernanke and Gertler (1995),
Mishkin (1996) identified five channels for MP
transmission: interest rates, asset prices, exchange rates, credit, and expectations. For most
economies, the pursuit of price stability always
leads to indirect pursuit of other goals such as
economic growth, which can only take place
in conditions of price stability and efficiency.
Therefore, MP, to ensure that money supply is
in line with growth targets of real incomes, will
ensure that growth does not cause inflation.
measurement indices by means of averaging of
the dimensions, so the weights are assigned to
arbitrary factors, mainly based on the intuition
of the researcher. Thus, Amidžić et al. (2014)
provide a new composite index using the FA
(factor analysis); the PCA method of Camara
and Tuesta (2014) to determine the appropriate weight for the FI, is considered an attempt
to overcome previous criticisms, and is less
arbitrary in determining the overall financial
size. However, the formulation of an index for
FI evaluation has yet to reach an official consensus. Amidžić and his colleagues mention
aspects such as outreach, use, and quality of
service; Camara and Tuesta are interested in:
usage, barriers, and access to services. Ambarkhane et al. (2016) developed indicators in
three aspects: service needs, service delivery,
and infrastructure. Thus, the literature review
of FI is still a subject that researchers continue
to debate.
Mishkin (1996) was one of the earliest economists to study the system of channels for
MP to affect price and output. Berument et al.
(2007) show the relationship between the degree of openness and the effectiveness of MP
on output growth and inflation. According to
traditional economic theory, central banks often change the money supply to affect interest
rates rather than other economic variables. According to Adams and Amel (2011), short-term
interest rates should be used to designate MP.
Beside the policy interest rates, money supply
is also one of the important representatives of
MP. By following the IS-LM model of Keynes
(1936), the central bank can implement MP
by changing money supply or interest rates
to affect yields and other economic variables.
Experimenting on the relationship between FI
and MP, Lapukeni (2015), Lenka and Bairwa
(2016) and Evans (2016), see inflation as a
proxy variable for the success of MP: the ma-
2.2. Monetary policy
MP is macroeconomic policy implemented
by the central bank to influence money supply
or interest rates to achieve macroeconomic objectives and target all sectors of the economy
(Lapukeni, 2015) as a goal for stabilizing inflation (Begg et al., 2008), or ensuring price
stability and public confidence in the value of
money (Agoba et al., 2017). MP targets are
often expressed in terms of maintaining economic stability, ensuring unemployment, stabilizing the financial system, etc. (Clarida et
al., 1998; Rogoff, 1985). However, in practice,
Central banks can not achieve all objectives at
the same time, so they have to choose the most
important goal in implementing MP, usually
stabilizing prices (Cecchetti and Krause, 2002).
Journal of Economics and Development
8
Vol. 20, No.2, August 2018
jority of policymakers are aiming to stabilize
prices.
Lapukeni (2015) noted however, that the relationship between these two factors is that excessive access to credit can also cause financial
instability by increasing the risk of bad debts;
and access to credit can lead to inflation if the
loans are consumer loans, not contributing to
production. So when discussing the FI increase,
it must be relevant and effective for the economy and the financial system in general.
2.3. Financial inclusion and monetary policy
Theoretical studies have discussed the implications of limited access to finance for policy
response functions of the central bank and the
effectiveness of MP (Gali et al., 2004). Policy
signals also clearly recognize the relationship
between FI and the potential for MP. Accordingly, access to basic financial services will
lead to increased economic activity and employment opportunities for rural households,
which will result in higher disposable income
and greater savings. As well as increasing the
amount of deposits stably to banks and other
financial institutions access to basic financial
services can increase the effectiveness of MP
(Khan, 2011).
2.4. Review of relevant experimental studies
Mehrotra and Yetman (2014) using a PVAR
found that the ratio of output volatility to inflation volatility increased in the share of financially included consumers in the economy
when monetary policy was conducted optimally, which was consistent with the theory
on limited asset market participation that only
financially included households are able to
smooth their consumption in response to income volatility.
Mehrotra and Yetman (2015) also argue that
FI will change the behavior of businesses and
consumers, which may affect the effectiveness
of MP. First, the increase in finance facilitates
consumption, as households have easy access
to tools for saving and borrowing. As a result,
the output fluctuation is less costly, contributing to creating conditions for the central banks
to maintain price stability. Secondly, enhancing
FI may increase the importance of interest rates
in the transmission of MP, enabling the central
bank to improve the effectiveness of MP.
Using the vector VAR model, Lapukeni
(2015) examined random causalities and analyzed the fundamental trends in FI’s impact
on inflation - considered a proxy variable for
the effectiveness of MP in Malawi (from the
year 2001 to 2013). For the FI, the study used
non-payment deposits and loans as a percentage of GDP. Control variables include interest
rates, money supply, and exchange rates. The
results show that there is a causal relationship
between FI and inflation, or FI is important for
a more accurate and stronger MP.
Besides, economies with higher FI levels
tend to exhibit higher interest rate sensitivities for changes in yields and prices; raising
the importance of interest rate channels in the
transmission of MP (Mehrotra and Nadhanael
2016).
Journal of Economics and Development
In a study of SAARC countries (from the
year 2004 to 2013), Lenka and Bairwa (2016)
found significant effects of FI on MP. In the
study, inflation was also seen as a measure of
the success of MP. FI includes a number of fi9
Vol. 20, No.2, August 2018
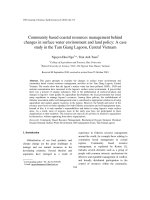
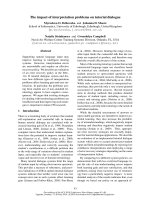
Figure1: Framework for analyzing the impact of FI on MP
Savings
Financial
inclusion
(FII)
Income
(NI)
Investment
Monetary
policy
(INF)
Consumption
Source: Synthesis of the author from theoretical and related studies
nancial access factors such as geographic access
(number of commercial banks per 1,000 km2,
number of ATMs per 1,000 km2), demographic
approach (100,000 commercial banks, ATMs
per 100,000 adults), and bank penetration (balance of deposits and loans unpaid by percentage of GDP). Controlling variables include the
average lending rate of commercial banks and
the exchange rate. A multidimensional measure
of FI was analyzed using the PCA method and
the use of three models (Fixed Effects Model,
Random Effects Model, and Panel Corrected
Standard Error) to analyze the data considered
the merits of this study.
the success of MP; money supply and interest
rates are used as control variables.
In contrast to the above studies, the findings
by Evans (2016) suggest that FI is not an important motivation for effective MP in Africa. In contrast, the effectiveness of MP is the
driving force behind FI. The study uses the
VECM analysis and causality analysis for African countries (from the year 2005 to 2014). In
particular, FI is measured by the number of depositors at commercial banks per 1,000 adults;
inflation is also considered to be a measure of
According to Amidžić et al. (2014) and WB5,
there is consensus, at least from the policymakers’ point of view, that FI consists of three main
dimensions: the outreach, usage and quality of
financial services. As can be seen, both supply
and demand data are included to provide a holistic view. Therefore, based on the FI understanding of the concept and the comprehensiveness of the dimensions proposed to be included
in the FI, the author relies on this approach to
Journal of Economics and Development
From theoretical research and related studies, the research analysis framework can be
summarized in Figure 1.
3. Data and methodology
3.1. Data and measurement variables
This study uses annual data collected from
the results of the Financial Access Survey
(FAS), financial statistics from the International Monetary Fund (IMF) and data on the World
Development Indicators of World Bank (WB)
from the year 2004 to 2015 of Vietnam.
10
Vol. 20, No.2, August 2018
cial institutions will make aggregate demand
and investment more sensitive to MP through
increasing the elasticity of lending rates. Therefore, it is necessary to implement FI through
banks’ lending rates in order to affect the
achievement of the ultimate objective of MP,
money supply and ultimate inflation target.
Thus, bank lending rates are used in the model
as explanatory and control variables, and money supply is also used as an explanatory variable in the model to avoid variance.
select the variables that measure FI in research.
Outreach dimension: determined by geographic penetration (ATMs and bank branches
per 1,000 sq. Km.), and demographic penetration (ATMs and branches per 100,000 adults).
However, because the available data is limited,
the author uses “ATMs per 100,000 adults” as a
proxy variable for this dimension.
Use dimensions: Amidžić et al. proposed an
index of deposit and loan accounts per 1,000
adults. However, Sarma (2008) cited Kemps
et al. (2004) that in some countries high rates
of bank account holders use very few of the
services provided; therefore, a bank account
is not enough for an overall financial system.
Thus, this research examines the two basic services of the banking system, credits and deposits, as proposed by Lenka and Bairwa (2016).
Accordingly, outstanding credits and deposits
from commercial banks (% GDP) have been
used to measure this dimension.
In all MP models, inflation is the ultimate
goal of any monetary institution (Lapukeni,
2015); Lenka and Bairwa, 2016). Therefore,
inflation is considered a proxy variable to measure the success of MP in this study. Accordingly, the proposed research model is:
Yt = β0 +β1FIIt + β2NIt+ β3Ctrlt + ut (1)
Where, the dependent variable Y is the rate
of inflation (annual % change in consumer
prices); independent variables include: FII
[FI index - independent variable (ATMs per
100,000 adults; outstanding credit and deposit
%GDP)] and NI- net national income per capita; Ctrl - control variables (including money
supply- M2, bank lending rates- IR).
Quality of financial services: including financial literacy, disclosure requirements, dispute resolution and cost of ownership. However, because the data on this aspect is quite
scarce there is a limitation in the available data.
Therefore, this dimension is not considered in
the calculation of the proposed FI index
3.2. Methodology
In addition, from the research analysis
framework, “income” is considered as an intermediary factor in the relationship between FI
and MP. Thus, the author adds “income” to the
research model to examine its impact on MP,
and net national income per capita - NI is considered a proxy variable.
In order to answer the question of what factors can be used to measure FI in Vietnam, i.e.
to build a FI index (FII); based on the approach
of Camara and Tuesta (2014), the author uses
the PCA method to determine the weights for
factors in the FII. Accordingly, the index of the
jth element can be expressed:
According to Mehrotra and Yetman (2015)
with increasing financial integration, the number of people accessing and using formal finan-
Where, FIIj is FI index, Wj is the weighting
factor weights, X is the corresponding initial
Journal of Economics and Development
FIIj = Wj1X1 +Wj2X2 + …+ WjpXp (2)
11
Vol. 20, No.2, August 2018
value of the components and p is the number of
variables (elements) in the equation.
0.9772) assigned to the first PC (Appendix 1).
By doing so, we get a composite single value
index.
The answer to the second question is also the
main question of the study, i.e. whether FI has
an impact on MP in Vietnam, Ordinary Least
Squares and Generalized Least Squares models
are used to analyze and to overcome the phenomenon of heteroskedasticity.
After checking the suitability (Kaiser-Meyer-Olkin Test) (Appendix 3) and reliability
(Cronbanh’s Alpha Test) of the factors (Appendix 4), we predict the FI index (FII). That index
may be shown:
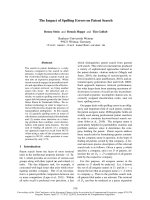
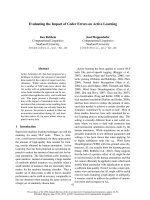
In this table, one can notice that from 2004
to 2008, Vietnam got a negative index for financial inclusion, which means an extreme condition of financial exclusion. From 2009 to 2015,
the level of financial inclusion has improved.
And we can clearly see the change of the level
of financial inclusion through the graph illustrated in Figure 2.
4. Results and discussion
4.1. Result of PCA
Through the PCA method, we calculated
eigenvalues of the all three factors, which included: [ATMs per 100,000 adults; outstanding
deposit from commercial banks (%GDP); and
outstanding credit from commercial banks (%
GDP)]. The highest eigenvalue of the components retains more standardized variance
among others, and an eigenvalue greater than
1 is considered for the analysis. The Appendix
shows the results of the PCA (Appendix 1). We
can see the eigenvalues of the three principal
components (PCs) are 2.85, 0.1, and 0.05. Except the first PC, no other PCs have an eigenvalue greater than 1; so we just take the first
component and extract the financial outreach
dimension using weights (0.9663, 0.9815, and
4.2. Result of regressions models
Declare data
The analysis data as well as declaration of
data is reported in Table 2. Accordingly, the
potential associations amongst the variables is
calculated (Table 3) and shown in Figure 3.
Table 4 presents the results of the OLS regression model. It explains the impacts of FI,
NI, IR and M2 on the INF of an economy,
which was used for effective and sound mon-
Table 1: Estimation of FI index in Vietnam
Year
FII
Year
FII
2004
2005
2006
2007
2008
2009
-1.69586
-1.43219
-1.07269
-0.53806
-0.37594
0.325
2010
2011
2012
2013
2014
2015
0.875955
0.497221
0.432587
0.706257
0.925121
1.352587
Source: Calculated by the author using PCA method on Stata 14.
Journal of Economics and Development
12
Vol. 20, No.2, August 2018
-2
-1
FI index
0
1
2
Figure 2: FI index in Vietnam (2004-2015)
2005
2010
Year
2015
Source: Calculated by the author using PCA method and drawing on Stata 14
etary policy.
In general, results from Table 4 show a negative and significant relationship between FI and
INF. However, after checking the defects of the
model [multi-collinearity (Table 5), heterogeneity (Appendix 10), autocorrelation (Appendix 11), omitting variables (Appendix 12)], we
found a problem of heteroscedasticity (Prob =
0.01 < α). Therefore, estimates may not be effective. So, to handle this problem, we use the
Then, a VIFs test is performed to check
whether there are multiple collinearity problems. Multicollinearity occurs when several
independent variables in a multiple regression
model are closely correlated to one another. In
this case, the result from Table 5 shows that
there
isn’t multicollinearity in the model (VIFs
< 10).
Table 2: Declare data
Variable
Obs
Mean
Std. Dev.
Min
Max
INF
12
9.174255
6.01076
.8786037
23.11632
FII
12
2.48e-09
1
-1.695856
1.352587
NI
12
5.746475
3.295909
-1.521328
10.31044
NI
12
11.55614
2.840744
7.1175
16.95383
M2
12
25.82612
9.637301
11.94245
49.106
Journal of Economics and Development
13
Vol. 20, No.2, August 2018
Table 3: The correlation between FI index and INF
INF
FII
NI
IR
M2
INF
1.0000
FII
-0.1996
1.0000
NI
-0.2837
0.3896
1.0000
IR
0.9126*
-0.0707
-0.1549
1.0000
M2
-0.1750
-0.5499
-0.0662
-0.1486
1.0000
seen that the responses of inflation to FII, NI,
and IR are consistent with theory suggestions,
reacting positively to the lending interest rate
and negatively to the financial inclusion index,
broad money, and net income per capita.
GLS model to find more accurate estimates:
This shows that a 1% increases in FI reduces
the level of the inflation by 0,74%. This result
is in line with most comparable results in the
literature of Lapukeni, (2015), Lenka and Bairwa, (2016). Similarly, NI, M2 is also negatively
associated with inflation in Vietnam. But IR is
positively associated with inflation. It can be
That a large share of the population is with-
Figure 3: Correlation between FI index and INF in Vietnam (2004-2015)
0
5
10
15
20
25
5. Conclusion and policy implications
2005
2010
Year
INF
2015
FI index
Source: Calculated by the author and drawing on Stata 14
Journal of Economics and Development
14
Vol. 20, No.2, August 2018
Table 4: Result of OLS regression model
INF
Coef.
Std. Err.
t
P>|t|
FII
-1.156459
1.061161
-1.09
0.312
-3.665707
1.352788
NI
-.1562355
.2686345
-0.58
0.579
-.7914552
.4789842
IR
1.82421
.2898155
6.29
0.000
1.138905
2.509515
M2
-.0987891
.1029697
-0.96
0.369
-.3422737
.1446955
_cons
-8.457436
4.954407
-1.71
0.132
Source: Calculated by the author using OLS model on Stata 14
-20.17275
3.257875
[95% Conf. Interval]
Table 5: Multi-collinear testing
Variable
VIF
1/VIF
FII
1.78
0.562940
M2
1.55
0.643718
NI
1.24
0.808632
IR
1.07
0.935229
Mean VIF
1.41
Table 6: Result of GLS regression model
INF
Coef.
Std. Err.
t
P>|t|
FII
-.7432105
.8346238
-0.89
0.414
-2.888679
1.402258
NI
-.1686668
.2416451
-0.70
0.516
-.7898352
.4525017
IR
1.837513
.4212649
4.36
0.007
.7546172
2.920409
M2
-.0264808
.0648342
-0.41
0.700
-.1931425
.140181
_cons
-10.62814 4.841059
-2.20
Source:
Calculated by the author using GLS on Stata 14.
0.080
-23.07248
1.8162
out access to a formal financial system is a
common
phenomenon in many emerging economies. Financial inclusion has been suggested
as a tool for addressing critical issues of poverty and under-development. So it is not surprising that many central banks in emerging
markets have explicit objectives regarding fiJournal of Economics and Development
[95% Conf. Interval]
nancial inclusion. Data from the Global Findex
database underline the importance of FI – as of
2014 in Vietnam only about one-third of adults
indicated they had a transaction account with a
formal financial provider, far below the regional average of 69%. Thus, Vietnam is among the
25 priority countries in which we are focusing
15
Vol. 20, No.2, August 2018
and calculation of its impact on MP, improving
the efficiency of MP transmission, contributing
to economic stability and sustainable growth.
our financial inclusion efforts through the Universal Financial Access by 2020 Initiative6. The
expansion of formal financial services to reach
millions of underserved and underserved adults
will help Vietnam achieve its goal of poverty
reduction and continued dynamic growth, advancing to the vision of prosperity.
In Vietnam, since 2016, the State Bank of
Vietnam (SBV) has been partnering the World
Bank Group to develop a FI national strategy
on the basis of a comprehensive approach. Although this strategy is still in the process of development, a number of key points have been
identified: digital-focused finance including
the transfer of government payment programs
to use services and digital technology platforms; financial services to rural and ethnic
minorities are backward and poverty rates are
higher than the national average; and there is
a need to enhance consumer protection and financial literacy to help newcomers to be better equipped with modern financial services.
However, Vietnam’s economy is still based
on cash transactions; most adults still do not
use formal financial services. So, switching to
a non-cash system is a priority in enhancing
efficiency, promoting business and economic
development, and reducing poverty in remote
rural areas where financial services providers
are difficult to reach. Therefore, the expansion
of formal financial services as well as FI enhancement will help Vietnam to promote the
non-use of cash, and improve the effectiveness
of the transmission of MP in the economy in
order to achieve poverty reduction goals and
sustainable growth.
FI, as documented in the literature, brings
about more economic wellbeing to individuals
and small and medium enterprises. Yet little is
known about its impact on MP which is seen as
a tool for stabilizing the economy. Using annual
data collected from the results of FAS, financial
statistics from The IMF and data on The World
Bank of Vietnam (from the year 2004 to 2015),
we provide comprehensive empirical evidence
that the impact of FI on MP is highly significant in Vietnam. The association between FI
and inflation is highly negative and statistically
significant. This shows that if FI increases then
it may reduce the inflation rate in an economy, which causes the stability of price levels.
This study investigated that if NI increases it
will help to reduce inflation in the market and
vice versa. Based on these research outcomes
it shows that the most important task of the
Government is to improve the FI, because FI
helps to stabilize the price level and controls
the inflation in an economy, which is essential
for sustainable economic growth. This study
helps policymakers and communities see the
importance of FI in the economy. From there,
a FI solution is integrated into the construction
1. Result of PCA
Factor analysis/correlation
Method: principal-component factors
Rotation: (unrotated)
APPENDIX
Number of obs
= 12
Retained factors = 1
Number of params = 3
Journal
of Economics and Development
16
Vol. 20, No.2, August 2018
Appendix 1: Principal components
Factor
Eigenvalue
Factor1
Factor2
Factor3
Difference
Proportion
Cumulative
2.85199
2.75240
0.9507
0.9507
0.09959
0.05117
0.0332
0.9839
0.04842
0.0161
1.0000
LR test: independent vs. saturated: chi2(3) = 43.58 Prob>chi2 = 0.0000
Appendix 2: Factor loadings (pattern matrix) and unique variances
Variable
Factor1
Uniqueness
ATM
Depst
Loans
0.9663
0.9815
0.9772
0.0663
0.0367
0.0451
Appendix 3: Kaiser-Meyer-Olkin measure of sampling adequacy
Variable
KMO
ATM
Depst
Loans
Overall
0.8623
0.7181
0.7527
0.7719
Appendix 4: Alpha test
Item
ATM
Obs
Sign
Correlation
Correlation
Correlation
Alpha
12
+
0.9666
0.9252
0.9505
0.9746
Depst
12
+
0.9813
0.9576
0.9074
0.9515
Loans
12
+
0.9771
0.9482
0.9199
0.9583
0.9259
0.9740
Test scale
Appendix 5: Interitem correlations
ATM
Depst
Loans
ATM
1.0000
Depst
0.9199
1.0000
Loans
0.9074
0.9505
1.0000
Journal
of Economics and Development
17
Vol. 20, No.2, August 2018
2.
Result of regressions models
Appendix 6: Declare data
Variable
Obs
Mean
Std. Dev.
Min
Max
INF
FII
NI
IR
M2
12
12
12
12
12
9.174255
2.48e-09
5.746475
11.55614
25.82612
6.01076
1
3.295909
2.840744
9.637301
.8786037
-1.695856
-1.521328
7.1175
11.94245
23.11632
1.352587
10.31044
16.95383
49.106
Appendix 7: The correlation between FI index and INF
INF
FII
NI
IR
M2
1.0000
-0.1996
-0.2837
0.9126*
-0.1750
1.0000
0.3896
-0.0707
-0.5499
1.0000
-0.1549
-0.0662
1.0000
-0.1486
1.0000
INF
FII
NI
IR
M2
INF
FII
NI
IR
M2
_cons
Coef.
Std. Err.
t
P>|t|
-1.156459
-.1562355
1.82421
-.0987891
-8.457436
1.061161
.2686345
.2898155
.1029697
4.954407
-1.09
-0.58
6.29
-0.96
-1.71
0.312
0.579
0.000
0.369
0.132
-3.665707
-.7914552
1.138905
-.3422737
-20.17275
1.352788
.4789842
2.509515
.1446955
3.257875
Variable
VIF
1/VIF
FII
M2
NI
IR
Mean VIF
1.78
1.55
1.24
1.07
1.41
0.562940
0.643718
0.808632
0.935229
Journal of Economics and Development
[95% Conf. Interval]
Appendix 9: Multi-collinear testing
Appendix 8: Result of OLS regression model
18
Vol. 20, No.2, August 2018
Appendix 10: Heteroskedasticity test
Breusch-Pagan / Cook-Weisberg test for heteroskedasticity
Ho: Constant variance
Variables: fitted values of INF
chi2(1)
= 6.12
Prob > chi2 = 0.0134
Appendix 11: Breusch-Godfrey LM test for autocorrelation
lags(p)
1
2
3
4
H0: no serial
correlation
chi2
df
Prob > chi2
1.617
5.763
7.404
10.228
1
2
3
4
0.2035
0.0560
0.0601
0.0368
Appendix 12: Ramsey RESET test
Ramsey RESET test using powers of the fitted values of INF
Ho: model has no omitted variables
F(3, 4) = 6.04
Prob > F = 0.0575
Appendix 13: Result of GLS regression model
INF
Coef.
Std. Err.
t
P>|t|
FII
-.7432105
.8346238
-0.89
0.414
NI
-.1686668
.2416451
-0.70
0.516
1.837513
.4212649
4.36
0.007
IR
M2
-.0264808
.0648342
-0.41
0.700
_cons
-10.62814
4.841059
-2.20
0.080
Appendix 14: Heteroskedasticity test
Breusch-Pagan / Cook-Weisberg test for heteroskedasticity
Ho: Constant variance
Variables: fitted values of INF
chi2(1) = 21.12
Prob > chi2 = 0.0605
Journal
of Economics and Development
19
[95% Conf. Interval]
-2.888679
-.7898352
.7546172
-.1931425
-23.07248
1.402258
.4525017
2.920409
.140181
1.8162
Vol. 20, No.2, August 2018
Notes:
1. Updated data from the World Bank’s 2014 World Development Indicators.
2. See at Ceyla Pazarbasioglu (2017), ‘Vietnam’s financial inclusion priorities: Expanding financial
services and moving to a ‘non-cash’ economy’, The World Bank, from < />voices/vietnam-s-financial-inclusion-priorities-expanding-financial-services-and-moving-non-casheconomy>.
3. See at Monetary policy and financial inclusion (2015), from < />commentary/2015/6/22/monetary-policy-and-financial-inclusion>.
4. The World Bank (2017), Understanding/ Poverty/ Topics/ Financial inclusion, from
5. See at The World Bank (2015), How to Measure Financial Inclusion, from
org/en/topic/financialinclusion/brief/how-to-measure-financial-inclusion>.
6. See at Ceyla Pazarbasioglu (2017), ‘Vietnam’s financial inclusion priorities: Expanding financial
services and moving to a ‘non-cash’ economy’, The World Bank, from < />voices/vietnam-s-financial-inclusion-priorities-expanding-financial-services-and-moving-non-casheconomy>.
References
Adams, R.M. and Amel, D.F. (2011), ‘Market structure and the pass-through of the federal funds rate’,
Journal of Banking and Finance, 35(5), 1087-1096.
Adediran, O., Matthew, O., Olopade, B.C. and Adegboye, F.B. (2017), ‘Monetary policy shocks and
inclusive growth in Nigeria: A VAR approach’, The International Journal Of Humanities and Social
Studies, 5(2), 173-179.
Agoba, A.M., Sare, Y.A. and Bugri-Anarfo, E. (2017), ‘Financial inclusion and monetary policy: A review
of recent studies’, Ghana Journal of Development Studies, 14(1), 231-254.
Allen, F., Demirguc-Kunt, A., Klapper, L. and Peria, M.S.M. (2016), ‘The foundations of financial inclusion:
Understanding ownership and use of formal accounts’, Journal of Financial Intermediation, 27, 1-30.
Alliance for Financial Inclusion (2012), The first G20 Global Partnership for Financial Inclusion (GPFI)
forum: Forum Report, from
Ambarkhane, D., Singh, A. S., & Venkataramani, B. (2016), ‘Measuring Financial Inclusion of Indian
States’, International Journal of Rural Management, 12 (1), 1-29.
Amidžić, G., Massara, M.A. and Mialou, A. (2014), ‘Assessing countries’ financial inclusion standing − A
new composite index’, Working paper WP 14/36, International Monetary Fund.
Bean, C., Paustian, M., Penalver, A. and Taylor, T. (2010), ‘Monetary policy after the fall’, Economic Policy
Symposium-Jackson Hole Proceedings, Federal Reserve Bank of Kansas City, Wyoming, 267-328.
Begg, D.K.H., Fischer, S. and Dornbusch, R.W. (2008), Economics, 9th Edition, McGraw-Hill Higher
Education.
Bernanke, B. S., & Gertler, M. (1995), ‘Inside the black box: the credit channel of monetary policy
transmission’, Journal of Economic perspectives, 9(4), 27-48.
Berument, H., Konac, N. and Senay, O. (2007), ‘Openness and the effectiveness of monetary policy: A
cross-country analysis’, International Economic Journal, 21(4), 577-591.
Journal of Economics and Development
20
Vol. 20, No.2, August 2018
Camara, N. and Tuesta, D. (2014), ‘Measuring financial inclusion: a multidimensional index, Working
paper No. 14/26, BBVA Bank, Economic Research Department.
Cecchetti, S.G. and Krause, S. (2002), ‘Central bank structure, policy efficiency, and macroeconomic
performance: exploring empirical relationships’, Review-Federal Reserve Bank of Saint Louis, 84(4),
47-60.
Chakravarty, S.R. and Pal, R. (2013), ‘Financial inclusion in India: An axiomatic approach’, Journal of
Policy Modeling, 35(5), 813-837.
Chibba, M. (2009), ‘Financial inclusion, poverty reduction and the millennium development goals’, The
European Journal of Development Research, 21(2), 213-230.
Clarida, R., Gali, J. and Gertler, M. (1998), ‘Monetary policy rules and macroeconomic stability: Evidence
and some theory’, Working paper w6442, National Bureau of Economic Research.
De Koker, L. and Jentzsch, N. (2013), ‘Financial inclusion and financial integrity: Aligned incentives?’,
World Development, 44, 267-280.
Demirguc-Kunt, A. and Klapper, L. (2012), ‘Measuring financial inclusion: The global findex database’,
Policy Research Working Paper No. 6025, The World Bank.
Evans, O. (2016), ‘The effectiveness of monetary policy in africa: modeling the impact of financial
inclusion’, Iranian Economic Review, 20(3), 327-337.
Gali, J., López-Salido, J. D., and Vallés, J. (2004), ‘Rule-of-Thumb Consumers and the Design of Interest
Rate Rules’, Journal of Money, Credit and Banking, 36(4), 739-763.
Garcia, M.J. (2016), ‘Can financial inclusion and financial stability go hand in hand?’, Economic Issues
Journal Articles, 21(2), 81-103.
Ghosh, S. and Vinod, D. (2017), ‘What constrains financial inclusion for women? Evidence from Indian
micro data’, World Development, 92, 60-81.
Gupte, R., Venkataramani, B. and Gupta, D. (2012), ‘Computation of financial inclusion index for India’,
Procedia-Social and Behavioral Sciences, 37, 133-149.
Gwalani, H. and Parkhi, S. (2014), ‘Financial inclusion–building a success model in the Indian context’,
Procedia-Social and Behavioral Sciences, 133, 372-378.
Hamilton, J.D. and Wu, J.C. (2012), ‘The effectiveness of alternative monetary policy tools in a zero lower
bound environment’, Journal of Money, Credit and Banking, 44(1), 3-46.
Han, R. and Melecky, M. (2013), ‘Financial inclusion for financial stability: access to bank deposits and
the growth of deposits in the Global Financial Crisis’, Policy Research Working Paper No. 6577, The
World Bank.
Hannig, A. and Jansen, S. (2010), ‘Financial inclusion and financial stability: Current policy issues’, ADBI
Working Paper 259, Tokyo: Asian Development Bank Institute.
Johal, S. (2016), ‘Tackling Poverty and inequality through financial inclusion: A case study of India’,
presentation at Third ISA Forum of Sociology, Vienna, Australia.
Joshi, V.K., Singh, M.R. and Jain, S. (2014), Financial inclusion for sustainable development
through Pradhan Mantri Jan-Dhan Yojana, from < www.professionalpanorama.in/wp-content/
uploads/2015/02/14sonal-ji.pdf>.
Keynes, J.M. (1936), The general theory of employment interest and money, New York: Macmillan
Cambridge University Press.
Khan, H.R. (2011), ‘Financial inclusion and financial stability: are they two sides of the same coin?’,
presentation at BANCON 2011, the Indian Bankers Association and Indian Overseas Bank, Chennai,
November 4th 2011.
Lapukeni, A.F. (2015), ‘The impact of financial inclusion on monetary policy effectiveness: the case of
Journal of Economics and Development
21
Vol. 20, No.2, August 2018
Malawi’, International Journal of Monetary Economics and Finance, 8(4), 360-384.
Lenka, S.K. and Bairwa, A.K. (2016), ‘Does financial inclusion affect monetary policy in SAARC
countries?’, Cogent Economics and Finance, 4(1), 1-8.
Manji, A. (2010), ‘Eliminating poverty? ‘Financial inclusion’, access to land, and gender equality in
international development’, The Modern Law Review, 73(6), 985-1004.
Mehrotra, A. and Nadhanael, G.V. (2016), ‘Financial Inclusion and Monetary Policy in Emerging Asia’, in
Financial Inclusion in Asia, Aaron Mehrotra and Nadhanael, G.V. (eds.), Palgrave Macmillan, UK,
93-127.
Mehrotra, A. and Yetman, J. (2014), ‘Financial inclusion and optimal monetary policy’, BIS Working Paper
No. 476, BIS Basel.
Mehrotra, A. and Yetman, J. (2015), ‘Financial inclusion–issues for central banks’, BIS Quarterly Review
March 2015, BIS, 83-96.
Mishkin, F.S. (1996), ‘The channels of monetary transmission: lessons for monetary policy’, Working
paper w5464, National Bureau of Economic Research.
Morgan, P. and Pontines, V. (2014), ‘Financial Stability and Financial Inclusion’, ADBI Working Paper
Series No. 488, Asian Development Bank Institute.
Park, C.Y. and Mercado, R. (2015), ‘Financial inclusion, poverty, and income inequality in developing
Asia’, ADB Economics Working paper series No. 426, Asian Development Bank.
Rangarajan, C. (2008), Report of the committee on financial inclusion, Ministry of Finance, Government
of India.
Rogoff, K. (1985), ‘The optimal degree of commitment to an intermediate monetary target’, The Quarterly
Journal of Economics, 100(4), 1169-1189.
Sarma, M. (2008), ‘Index of Financial Inclusion’, Working Paper No. 215, Indian Council for Research on
International Economic Relations.
Sethy, S.K. (2016), ‘Developing a financial inclusion index and inclusive growth in India’, Theoretical and
Applied Economics, 2(607), 187-206.
Sharma, D. (2016), ‘Nexus between financial inclusion and economic growth: Evidence from the emerging
Indian economy’, Journal of Financial Economic Policy, 8(1), 13-36.
Shimizu, S. (2014), ‘ASEAN financial and capital markets: Policies and prospects of regional integration’,
Pacific Business and Industries, 14(54), 1-36.
Subbarao, D. (2009), ‘Financial inclusion: Challenges and opportunities’, presentation at The Bankers
Club, Kolkata, December 9th 2009.
Journal of Economics and Development
22
Vol. 20, No.2, August 2018