Profit warning announcements and the security prices of companies listed on the nairobi securities exchange, Kenya
Bạn đang xem bản rút gọn của tài liệu. Xem và tải ngay bản đầy đủ của tài liệu tại đây (213.71 KB, 10 trang )
Journal of Finance and Accounting, 2019, Vol. 7, No. 1, 12-21
Available online at />Published by Science and Education Publishing
DOI:10.12691/jfa-7-1-3
Profit Warning Announcements and the Security Prices
of Companies Listed on the Nairobi Securities
Exchange, Kenya
Raude John O. Messo*, Charles Yugi Tibbs
Department of Finance and Accounting
*Corresponding author:
Received July 26, 2019; Revised August 27, 2019; Accepted September 08, 2019
Abstract Business plays a significant role in prosperity in society and creates resources that permit social
development and welfare. The market price of its securities measures the worth of business. Thus, security prices
show how a company, through its commercial operations, actively contribute to progress in an economy. However,
this is not the case for NSE N20 share index, which, in 2015, 2016 and January 2017 experienced price declines,
prompting this study investigated the effect of Profit Warning Announcements on the Security Prices of companies
listed on the NSE, Kenya. The study applied the Signaling Theory, the Efficient Market Hypothesis, and the Market
Expectation Theory. It used the Event Study Methodology that employed a mixed Research Design and
Longitudinal Research and administered a questionnaire and interview schedules to collect data from ten listed
companies. The study used parametric statistical techniques - the ANOVA and to analyze data and test the
hypothesis. The study concluded that Profit warning Announcements did not affect the performance of Securities
Prices of companies listed on the NSE, Kenya. This study will guide the market activities and provide a better
understanding of how Profit warning Announcements affect returns. It will enable the policymakers to assess and
evaluate the current status and, provide a platform for making reviews, designs, and formulate policies to regulate
and control trading activities on the financial markets, contribute to knowledge and strengthen the foundation for
further research. Future research should investigate the effects of Profit warning Announcements on the performance
of security prices of specific companies that were affected by the price declines.
Keywords: profit warning, performance, security price
Cite This Article: Raude John O. Messo, and Charles Yugi Tibbs, “Profit Warning Announcements and the
Security Prices of Companies Listed on the Nairobi Securities Exchange, Kenya.” Journal of Finance and
Accounting, vol. 7, no. 1 (2019): 12-21. doi: 10.12691/jfa-7-1-3.
1. Introduction
Business plays a significant role in prosperity in society
and creates resources that permit social development and
welfare. The market price of its securities measures
the worth of business. Thus, security prices show
how a company, through its commercial operations,
actively contribute to progress in an economy. Security
price-performance keeps changing upward and downward
depending on market behavior. Boyes, [1] argues that a
rice in security price indicates that the market expectations
are revised upward, and, demand for company's securities
will be high resulting into more investors wanting to buy
the company's securities, and fewer will want to sell them.
Similarly, a fall in security price indicates that the market
expectations are revised downward, and, fewer investors
will want to buy the company's securities, and more will
want to sell the same. Brown [2] argument that even a
great set of results can actually see a stock trading lower if
those results were below expectations and a poor set of
results could see a stock trading higher if they weren’t as
bad as the market was expecting.
Security Performance according to Schwert [3], plays a
vital role in the economy through various means, such as,
the security exchange which is considered a general
measure of the state of the economy, through which
security prices affect the real economy. According to
Modigliani [4], proposition, a permanent increase in
security prices increases the individual's wealth holdings,
and therefore in the higher stable income. Modigliani's [4]
proposition is supported by Bernanke and Gertler, [5] and
Kiyotaki and Moores' [6] arguments of the financial
accelerator by which stock prices impact output which,
refers to the impact that stock prices have on firms'
financial statements.
In theory, the value of a company is its market
capitalization, which is the security price multiplied by the
number of securities outstanding at any point in time.
Further, security price reflects a company's current value
and also reflects the growth that investors expect in the
future. Therefore, changes in security price resulting from
events impacts on the value of the firm. Uduak,
Journal of Finance and Accounting
Emmanuel and Sunny [7] concluded that, firms’ value is a
function of events and developments in the firms and the
environment.
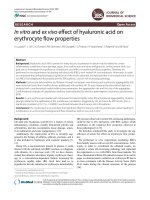
However, this is contrary to the happenings on the
Nairobi Securities Exchange, Kenya whose N20
share index, according to the NSE Handbook (2017),
experienced declines in 2015 and 2016 and January 2017
by 21 percent, 21 percent and 12 percent respectively as
shown in Figure 1. According to Schwert’s [8] statement
on security exchange and the general measure of the state
of the economy, the decline is of great concern to
investors, firms, and the economy as a whole, as it affects
the firm's market capitalization, their total value and the
country's economy. Schwert's [8] statement is supported
the Pearce's [9] observation where a significant economic
recovery followed an increase in security prices in the
United States. Therefore, the poor performance on the
NSEs N20 raises the question; is the decline in the NSE,
Kenya N20 share index result from Profit warning
Announcements? This study answered the question by
investigating the effect of Profit Warning Announcements
on the Performance of the Security Prices of 10 companies
listed on the NSE, Kenya.
1.1. Statement of Problem
Security Price plays a vital role in determining the
value of the firm, also known as Firm Value (FV). In
theory, security price is an economic concept that reflects
the value of a business. However, this is not the case with
NSE, Kenya N20 index which in 2015, 2016 and January
2017, experienced declines in security prices by 21
percent 21, percent and 12 percent in 2015, 2016 and
January 2017 respectively. These declines are of great
concern to investors, the government, and the public at
large since a decline in security prices reduces the value of
the firm hence the economy. Thus, the concerns prompted
this study investigated the cause of the declines by
13
investigating the effect of Profit warning Announcements
on the Performance of Security Prices of 10 companies
listed on the NSE, Kenya.
1.2. Objective of the Study
The objective of the study was to investigate the effect
of Profit warning Announcements on the Performance of
Security Prices of companies listed on the NSE, Kenya.
1.3. Research Hypotheses
The study formulated and tested a null hypothesis that:
H0: Profit warning Announcements has no significant
effect on the Performance of Security
Prices of the company listed on the NSE, Kenya.
1.4. Significance of the Study
Findings of this study are expected to be of significance
to various groups of people: first, to the market players
(financial institutions, securities markets, brokers, financial
analysts, economists, and investors) to guide the market
activities and provide a better understanding of how to
optimize returns. Policymakers (Capital Markets Authorities,
Securities Exchanges, Central Banks, and other financial
regulatory agencies) to enable them to assess and evaluate
the current status and, provide a platform for making
meaningful reviews, design, and formulate policies to
regulate and control trading activities on the financial
markets. Finally, to add knowledge (scholars, researchers,
and learners). The ideas presented in this study will
complement the existing studies and will serve as
reference data in conducting new studies or testing the
validity of other studies in this area. Further, the ideas will
serve as a cross-reference that would give a background or
an overview of future studies, contribute to knowledge,
and strengthen the foundation for further research.
6000.00
5024.25
5000.00
4776.88
4598.59
4000.00
3549.67
3495.19
2016
2017
3000.00
2000.00
1000.00
0.00
2013
2014
2015
Figure 1. NSE N20 Share Index Decline Curve (Source: NSE Handbook (2017))
14
Journal of Finance and Accounting
1.5. Limitation of the Study
This study encountered the following limitations: only
ten companies issued Profit warning to its members,
missing documents, lack or missing data, security prices
were not continuous, documents approvals/announcements
were not dated and non-response to questionnaires. Thus,
the researcher removed from the list companies whose
documents were not dated and those with missing or the
data were not continuous. Missing documents were
overcome by using the internet to obtain data of the
missing documents.
1.6. Assumptions of the Study
The study made assumptions that the data collected
were correct and accurate. Besides, this study assumes that
the finding of this study will be a representative of the
whole.
2. Literature Review and Empirical
Studies
2.1. Literature Review
2.1.1. Signaling Theory
The Signaling Theory can be traced way back to 1961
when Modigliani and Miller [10] claimed that firms
increase dividends to convey positive information about
earnings prospects. The theory was, however, brought
forward by Stephen Ross in 1977 who argued that in an
inefficient market, management could use dividend
payment to signal important information to the market
which is only known to them. If management increases the
dividend, it signals expected a high profit, and therefore
share prices will rise. Ross further argued that dividend
decisions were relevant, and a firm that paid a higher
dividend had a higher value.
Earlier in 1973, Ross Watts published an article "The
information content of dividends." In this article, Ross
concluded that dividends contain weak to no information.
Three years later, in 1976, Richardson Pettit carried a
similar study which concluded in favor of the Signaling
Theory. According to Pettit [11], the difference between
reported earnings and real long-term earnings power was
significant enough, for dividends to be able to contain
information about future earnings. Aharony and Swary,
[12] after analyzing quarterly dividend and earnings
announcements, concluded that dividends and earnings
were strong support for the Signaling Theory.
Fifth Schedule of Capital Markets (Securities) (2002)
requires public companies listed on the securities
exchange to disclose to their stakeholders, the public, and
the shareholders in particular information about their
earnings. In compliance, all company listed frequently
declare to their shareholders the progress of their earnings.
Thus, the disclosure calls for public announcements by a
listed company of their performance in the form of Profit
warnings Announcements.
This study critiques Signaling Theory from the
Modigliani and Miller hypothesis (1959) that dividend
reduction conveys information that future earnings will be
reduced and vice-versa and the Gordon's [13] Dividend
Irrelevance Model, which states that the dividend is
expected to grow when earnings are retained. The
discussion of Signaling Theory is that announcement of an
increase in dividend payout is taken very positively in the
market and helps to build a very positive image of the
company regarding the growth prospects and stability in
the future and vice-versa. Therefore, positive earnings
announcements should be associated with good and
positive expectation, while a negative earnings announcement
is expected to generate bad and negative expectation. Thus,
a neutral earnings announcement is expected not to
influence perceived value-maximizing investors' positive
and negative expectation, hence the abnormal return to
being generated during the earnings.
However, the findings of Modigliani and Miller [10],
Ross [14], Aharony and Swary [12], Pettit [11], and
Gordon's [13] Model give contradicting arguments
about the Signaling Theory, indicating that the theory
has not adequately dealt with in the Profit warning
Announcements and the Performance of Security Prices.
Modigliani and Miller hypothesis and Gordon's [13]
Model may be true for their models. However, it may not
be true in general and for the assumptions put forward.
Earnings and Dividend announcements are based on a
firm's earnings and dividend policy. Therefore, Profit
warning Announcement has an adverse effect the earnings
and the dividend. Thus, as stated in Gordon's [13]
Dividend Irrelevance Model, the dividend is expected to
grow when earnings are retained since the retained
earnings are invested in profitable projects.
This theory is important in this study because it
provides a signal and an in-depth understanding of the
behavior of security prices upon public announcements of
Earnings, Dividend, and Profit Warnings by a company.
2.1.2. Efficient Market Hypothesis
The event study is founded on the principle of the
Efficient Market Hypothesis. Efficient Market Hypothesis
according to Regnault [15] states that security price at all
times fully reflect all available information, and therefore,
it is not possible for an investor to outperform the security
market since prices follow a random walk. Efficient
Market Hypothesis, according to Fama et al., [16], was
developed by Fama in 1960s from the earlier theoretical
developments of Regnault [15]. According to Regnault
[15], prices can only change when there is new
information in the market. The premise of the Efficient
Market Hypothesis is that the price of the security has
intrinsic value, and is calculated by obtaining the present
values of streams of future cash flows expected from
a firm's assets. This, at any time, reflect all available
information about the firm's current and future earnings.
The prices follow a random walk; hence, investors can
only earn normal returns, determined by market models
such as the Capital Asset Pricing Model. The speed at
which any new information resulting from an unexpected
event is reflected in the price of a security is a reliable
indicator of market efficiency.
Rao [17] states that the concept of EMH, which is
based on the reflection of relevant information in market
prices of the securities, was introduced by Fama in 1960s.
Journal of Finance and Accounting
This concept relates intense competition in the capital
market to fair pricing of debt and equity securities. As
such, the concept of weak-form efficient markets should
reflect only past information; semi-strong form efficient
markets should reflect both past and present information;
and strong-form efficient markets should reflect both past,
present, and future information. Therefore, the market is
efficient in weak-form if investors cannot obtain abnormal
returns by analyzing relevant historical information about
the securities, rendering investment tools like filter
strategy, technical analysis to be ineffective. Hence,
fundamental analysis will be the only effective approach
for investment management.
The market is efficient in the semi-strong form if
analysis of relevant historical and current information is of
no use for gaining abnormal returns, rendering filter
strategy, technical analysis, and fundamental analysis not
to be effective for investment management. Finally, the
market is efficient in strong-form if analysis of all
information; past, present, and future is of no use to gain
abnormal returns. For market efficiency, the following are
pre-requisite: Rationality. This is the assumption that
investors in the market are deemed rational to adjust
their estimates of securities prices of the company when
new information is released into the market. Others
pre-requisites are independent deviation and arbitrage.
Independent deviation assumes that the released
information to the market is incomplete; hence, the
irrational investor may rely on projected future sales
above rational while arbitrage is the act of exploiting
situations of pricing. According to Poitras [18], "When the
estimated value is sufficiently above the market price,
then this provides a potentially profitable buying
opportunity, or, if the estimated value is sufficiently below
the market price, this is a selling opportunity." When
securities are underpriced, arbitrageurs buy them in large
quantities thus bringing the prices to equilibrium and short
selling overpriced substitute securities, hence obeying the
law that states that at any point of time the securities will
be correctly priced. These are the pillars of an Efficient
Market.
Although the Efficient Market Hypothesis was
formulated in the 1960s, studies are still being carried out
to test the market efficiency in various securities
exchanges. In one of the recent studies, Kelikume [19],
tested the efficiency of the Nigerian Stock Market, using a
wavelet unit root test with different lags and other
traditional random walk testing procedures, on monthly
average stock price index over the sample period 1985 to
2015. The study found that the Nigerian Stock Market was
efficient and followed the random walk behavior. EMH is
however criticized mainly on the market crash of October
1987. Moreover, the interpretation that the hypothesis
implies that returns should be unpredictable is highly
misleading.
2.1.3. Market Expectation Theory
Whereas the Expectation Theory has been well used to
explain the term structure of interest rates, the theory can
also be used in this study. As such, the theory is of great
importance in understanding the behavior of securities
prices upon making public Announcements of Earnings,
Dividends, and Profit warnings. Market Expectation
15
Theory according to Aswath [20], postulates that it is not
the magnitude of the earnings change that matter, but the
"surprise" in the earnings, measured as the earnings
change relative to expectations. As such, when a company
announces its earnings, markets will react to the "news" in
the announcement, but the way we measure the news has
to be relative to expectations. This theory has rarely been
used.
Boyes [1], states that shareholders' value will reflect the
current and expected future economic earnings of the
company. Thus, it is the market expectations (buyers and
sellers) of the future firm's performance that determines
the price of a security. Once determined, and nothing
changes, the security price will not change. The revision
of expectation is what causes a rise or fall in price.
According to Boyes [1], using the Feltham and Ohlson's
[21] Abnormal Net Income Model, the market value of a
firm is its book value (the current security holders' equity),
plus the present value of economic profits expected to be
earned in the future:
=
P0 CBV + PV [ EP ]
(1)
Where P0 is the current security price and, PV[EP] is the
present value of economic profits expected in the future.
According to Boyes [1], this model indicates that the
market value goes up when the expectation of the future
net income rise, that is when announced earnings exceed
expectations of the future, triggering an increase in net
income expectation going forward and vice versa.
Thus, Security Prices tend to rise when earnings results
exceed market expectations and decline when earnings
results are below market expectation. For example, a
company may announce earnings, which are higher than
the previous period by say 10 percent. This is improved
performance compared to previous earnings but may
trigger a negative price reaction since the market
expectation was, say 15 percent. Thus, according to
Aswath [20], a company that reports that its earnings went
up by 30 percent may be seen as delivering bad news, if
investors were expecting an increase of 40 percent, and a
firm that announces earnings decline of 30 percent may be
providing positive information, if the expectation was that
earnings would decline by 40 percent. Bajkowski, [22]
argues that positive earnings surprises occur when actual
reported earnings are significantly above the forecasted
earnings per share while negative earnings surprises occur
when reported earnings per share are significantly below
the earnings expectations. Brown [2], argues that one of
the hardest lessons to learn in the market is that it’s
about expectations rather than reality. According to
Brown [2], even a great set of results can actually see
a stock trading lower if those results were below
expectations. Inversely, a poor set of results could see a
stock trading higher if they weren’t as bad as the market
was expecting.
The market expectations can be measured using reverse
DCF valuation, Asset Valuation, and Reverse Earnings
Valuation. Another method widely used is the consensus
between the stockbrokers on earnings estimates made by
research analysts in the market. Since there are few or
studies on Market Expectation Theory, this study argues
that one of the obstacles of the theory is to determine the
market expectation.
16
Journal of Finance and Accounting
2.2. Empirical Literature
Profit Warning Announcement is made by a company
to advise its security holders that the company's earnings
will decline and therefore not meet their expectation.
According to Tserendash, Xiaojing and Lions [23], the
disclosure of the profit warning is one approach for the
companies to deliver the company's information to the
public, thereby reducing the information asymmetry and
increasing company information transparency. The
modern theory of Profit states that "the entrepreneur as a
business enterprise itself and Profits as his net income,
profits are his (the entrepreneur) reward of and are
governed by the demand for and supply of entrepreneur."
In theory, Profit Warnings are adjustments to the publicly
available expected results of a listed company. Profit
Warnings are intended adjustment to earnings estimates to
align them with the earnings achieved during the period.
Profit Warnings are price-sensitive and therefore require
companies to inform investors at the earliest possible. The
practice is to make Profit Warning announcement a few
weeks before the release of new earnings.
Profit Warning affects security prices negatively. The
security holders are also affected as the announcement
completely changes their expectation, increases risk to
their investments, and creates a state of uncertainty.
According to Cockroach Theory (a market theory), when a
company reveals bad news to the public, there may be
much more related negative events that have yet to be
revealed. This theory comes from the common belief that
seeing one cockroach is usually evidence that there are
much more not seen. In theory, Profit Warnings and the
Cockroach can have a devastating effect on the company,
the market, and the industry, for example, Healy and
Krishna [24]; Enron case. Investors can withdraw their
securities in panic hence making security prices to drop
drastically.
Benabdennbi and Atrakouti [25] studied the impact of
the of Profit warnings Announcement on their stock prices
of Moroccan companies using 71 Profit warnings from 35
companies listed in the Casablanca Stock Market. The
study used the market model from the simple event study
methodology in order to look at the fluctuations of
companies’ abnormal returns, cumulative abnormal
returns using a regression model and a t-test technique.
The study found abnormal return happened at the exact
day of the announcement of the profit warning (t=0) and
that CAR showed that the abnormal returns spread
throughout the eight following days after the profit
warnings announcement. Benabdennbi and Atrakouti’s
[25] study contrasts the findings of this study. This study
accounts for the contrast based on the areas of the studies
(Morocco vis a vis Kenya), the techniques used (t-test vis
a vis ANOVA) and the period of the study 10 years vis a
vis 5 years).
Shuxing, Khelifa, Abdelhafid, and Brahim [26] investigated
the role of time-varying betas, event-induced variance,
and conditional heteroskedasticity in the estimation of
abnormal returns around important news announcements
using event study methodology. The study was based on
the stock price reaction to profit warnings on firms listed
on the Hong Kong Stock Exchange. The study found the
presence of price reversal patterns following both positive
and negative warning and statistical significance of some
post-positive-warning cumulative abnormal returns to
disappear and their magnitude to drop to the extent that
minor transaction costs would eliminate the profitability
of the contrarian strategy.
Maarten [27], in a study on how the market reacts to
a Profit Warning Announcement in the short and
medium-term examined117 first-time profit warnings
issued by firms listed on Euronext Amsterdam from 2001
and 2007, using Event Study Methodology, t-Test and
Univariate / Multivariate Regression Analysis. The study
found that significant negative abnormal returns followed
profit warnings in the short-term while in the medium-term,
abnormal returns continued to drift downward for
the entire twelve months post-event period. Kiminda,
Githinji, and Riro [28] examined share returns following
unexpected corporate profit warnings announcements. The
study tested whether there were abnormal returns on share
prices after the announcement of profit warnings on 510
companies quoted on the Nairobi Securities Exchange
(NSE), using the event study on one hundred- and
fifty-days event window. The study found that profit
warning had an impact on the stock return in the NSE and
the impact was negative and significant for the period of
pre-warning and post warning and on the day of the actual
announcement. There were also indications of information
leakages where there were negative abnormal returns days
before the profit warning announcements. In a review of
the studies, the proposed study suggests that the former
would have utilized or included the panel data analysis in
their methodology due to its robustness in efficiency
improvement and elimination of the impact of omitted
variables.
3. Research Methodology
This chapter presents the methodological base for this
study. Thus, a Philosophical Perspective, Research Design,
Target Population, Census, Study Area, Data Collection,
and Data Analysis are discussed.
3.1. Philosophical Perspective
According to Crotty [29], research philosophy is a
system of beliefs and assumptions about the development
of knowledge. It is what the researcher is doing when
carrying out research. Research philosophy includes
assumptions about human knowledge, the realities a
researcher encounters in his/her research, and the extent
and ways a researcher’s values influence his/her research
process.
This study is anchored on positivism research
philosophy founded by Auguste Comte (1798 - 1857)
since it used quantifiable data and statistical analytical
technique in the analysis of data. Positivism research
philosophy was appropriate to achieve its objectives.
Macionis and Gerber [30], state that Positivism is a
philosophical theory and that certain ("positive")
knowledge is based on natural phenomena and their
properties and relations.
Journal of Finance and Accounting
17
3.2. Research Design
3.5. Data Collection Procedure
This study employed a mixed research design (a
Descriptive Survey Research Design, a Causal Design and
Longitudinal Research Design). A Descriptive Survey
Research Design, according to Trochim [31], provides the
glue that holds the research projects together. Also, it used
to structure the research, show parts of the research
project, the samples or groups, measurement, treatments
or programs, and methods of assignment work together to
try to address the central research questions". Descriptive
Survey Research Design was appropriate to this study
since it reported summary data of central tendency and
dispersion, namely the mean and deviation.
The inferential statistic was appropriate to this study to
make inferences about the population based on the census,
that is a hypothesis and significance testing.
Primary data was collected from 10 companies listed on
the NSE by administering a questionnaire and obtaining
collaborating information by examining records held by
the company. The questionnaire used structured questions
consisting of 12 questions divided into six parts; ‘A,’ ‘B,’
‘C,’ ‘D’ ‘E.’ and ‘F’. Part A of the questionnaire consisted
of four questions on the general information of the
company. This provided the study with the general
background information of the company/respondent.
Part B of the questionnaire consisted of one question
that collected data on the Earnings Announcements
by the companies/respondents and, the date of the
Announcements. This provided this study with the dates
Profit warning Announcements were made public by the
companies. Part C and D of the questionnaire consisted of
two questions that collected data on the Performance of
Security Prices. This part provided this study with data on
the security prices. Part E of the questionnaire consisted of
two questions that collected data on the Market Factor of
the company. This provided this study with data on
Market share and the Age of the company during the study
period. Finally, Part F of the questionnaire consisted
of two questions on the securities held by the
companies/respondents. This provided the study with
information about the types of securities held by the
companies during the study period and information which
was used to collaborate the finding of the study.
Secondary data were collected from the NSE, Kenya,
using schedules. The schedules had two parts. Part A
consisted of general information of the respondent
/company while Part B consisted of information relating
to Security Prices and Trade Volumes. This provided the
study with pre-event, Event, and post-event data on the
Performance of the Security Prices.
3.3. Target Population
This study targeted ten companies listed on the NSE,
Kenya that met the requirements of the study. That is a
company must have had its securities traded on the NSE,
Kenya for a complete year(s) uninterrupted during the
study period; two, a company must have had its securities
traded on NSE, Kenya continuously during the event in
question; and finally, a company must have issued Profit
warning public announcement(s) and must have been
trading at the time of announcement.
Table 1. Companies Listed on the NSE, Kenya
County
Sector /Industry
Nairobi
Banking
Insurance
Energy
Commercial
Manufacturing
Investment
Agricultural
Automobile
Construction
Telecommunication
Real Estate
Exchange Trade
Manufacturing
Manufacturing
Agricultural
Agricultural
Manufacturing
Total
Mombasa
Machakos
Kiambu
Kericho
Kakamega
Companies
listed on the
NSE
11
6
5
11
6
6
4
2
5
1
1
1
1
1
1
2
1
65
Companies that met
the requirement of the
study
2
2
1
3
1
1
10
Source: NSE Handbook (2017).
3.4. Census
Since the target population was small, this study used
census of ten companies.
Study Area
This study was conducted in three counties in Kenya,
namely; Mombasa County, Nairobi County, and Kakamega
County.
3.6. Data Collection Procedure
Data collection was carried out by delivering questionnaires
to the respondents. After fourteen days, the research
assistants visited the respondents to collect the filled
questionnaires. Where the respondent was unable to fill
the questionnaires or part thereof, the research assistant
assisted. This study triangulated the data using questionnaire,
schedules, and interviews. The researcher then visited the
NSE, Kenya, to collect data on the movement of security
Prices and Trade Volumes using schedules. Further, the
researcher used the internet online electronic platform to
collect missing data, corporate actions, and to collaborate
data collected using questionnaires. The unforeseen data
collection problems were minimized by using the internet
to obtain the missing data, validity checks, quality checks,
and testing the assumptions.
3.7. Validity and Reliability of Research
Instruments
This study subjected the instrument for primary data
collection to Karl Pearson's Product Moment correlation
coefficient formula below.
18
Journal of Finance and Accounting
r=
(
n ( ∑ XY − ∑ X ∑Y )
)(
)
√ n ∑ X 2 − ( ∑ X )2 n ∑Y 2 − ( ∑Y )2
(2)
Where: r = reliability coefficient
n = number of respondents
X = total score of the test administration
Y = total score of the retest administration.
Reliability was expressed as a coefficient with values
between zero and one; where zero indicates no reliability
and one indicates perfect reliability. The reliability test
revealed a coefficient of 0.7, implying reliability was
strong.
However, this study did not validate the instrument for
secondary data since they are already published. Instead,
the study validated data by checking the consistency of the
datasets and by evaluating: the data provider's purpose, the
data collector, time when the data was collected, how the
data was collected, the type of data collected and whether
the data relates to the area of study. Besides, the
researcher made a judgment of a good fit between the
research objectives and the dataset. According to Sunjoo
and Erika [32], a sound conceptualization of the research
questions and a good fit between the research questions
and the dataset are prerequisites to yielding valuable
results.
3.8. Data Analysis and Presentation
This study analyzed data using the Analysis of Variance
(ANOVA) technique and presented the results using tables
and graphs. Before analyzing data, this study checked the
six assumptions of ANOVA by running normality and
homogeneity of variances tests in addition to observing
the other four assumptions namely; the dependent
variables assumption, the independent variables assumption,
the independence of observations and no significant
outliers' assumptions. Finally, the study carried out null
hypotheses significance tests to infer the results and to
draw conclusions.
Further, this study used the Event Study Methodology.
In applying Event Study Methodology, this study first
identified the exact dates of the event announcements.
This exercise was done by examining records, publications,
and the financial statements of the companies and
collaborated by using internet online electronic platform
and information obtained from the respondents. This was
followed by dropping confounding Events to remove
noise by, excluding all events that occurred together with
the defined event. This study then composed the event list
and retrieved assets. The event list in this study was
designed to include information from the company
relating to the event date, the company's name, and the
company identifier. The company identifier enabled this
study to retrieve asset price data from the companies to
run the event study and identify the normal market
reaction to the determined events. Thus, this study
determined: the estimation window to 200 trading days
ending 20 days before event day, the event day and
estimation window to 41 trading days (-20+20) and the
post-event window to 200 days preceding the event day.
This study then computed the returns, the mean returns,
the expected market mean returns using the CAPM model,
and abnormal returns from the collected data. The study
then ran significant tests to determine whether the
announcements triggered reactions in the security prices at
5 percent significant level. Thus p-value above .05 implies
that the effect of the announcement was insignificant
while p-value less than .05 meant that the effect of the
announcement was significant.
i) Abnormal Returns
Abnormal return is the unexpected excess return
brought about by a particular event. This study calculated
abnormal returns as a crucial measure that isolate the
effects of the events from other general market factors,
using the following formula:
ii) Security return
R=
P1 − P0
P0
(3)
Where:
R is the return of company at time T
Pi, is the actual price of company at time T1
P0 is the actual price of company at time T0.
iii) The Capital Asset Pricing Model
This study applied the Capital Asset Pricing Model
(CAPM). According to Treynor and Jack [33], CAPM was
formulated by Treynor in 1961 and 1962, Sharpe in 1964,
Lintner in 1965 and Mossin in 1966 to calculate the
expected returns E[R]. This model was built on the earlier
work of Harry Markowitz on diversification and modern
portfolio theory. It is a two-factor model; security and
market risks and benchmarked by the risk-free rate of
return.
iv)
[ R] =
(4)
R ft (1 − β j ) + β j Rmt + ε jt
Where:
E[R] is the return for security j during period t
Rft is the risk-free rate of return during period t
βj is the systematic risk of security j to the market
Rmt is the return on the market index during period t
εjt is the residual of the equation.
v) Standard Deviation
( Rm,τ − Rm, Est )
(5)
2
Estmax
( Rm,τ − RM , Est )
∑ Estmin
2
S ( AR=
i ) σˆ ARi 1 +
1
+
Mi
Where:
Rm,T is the Market return at time T
Rm, Est is the Market return estimated
vi) Abnormal Return
RAB = R – E [ R ].
(6)
3.9. Observation of Ethical Standards
According to Resnick [34], Research ethics are
essential for the reasons that; one, they promote the aims
of research; two, they support the values required for
collaborative work since the researchers are held
accountable for their actions; three, they ensure that the
public can trust research and four, they support important
social and moral values. Thus, in compliance with
ethical consideration, this study obtained consent from
Journal of Finance and Accounting
respondent and research participants, minimized the risk
of harm to participants, protected the anonymity of the
respondents, ensured confidentiality of the information
obtained, avoided using deceptive practices, gave the
respondents and the participants the right to withdraw
from the research and finally, obtained a permit from
NACOSTI.
4 Results and Discussions
4.1. Introduction
This chapter presents results and discussions of
the Effects of Profit warning Announcements on the
Performance of Security prices of companies listed on the
NSE, Kenya.
4.2. Descriptive Statistics
In order to test the effect of Profit warning
Announcements on the Performance of Security Prices on
the NSE, Kenya, this study computed the means before
and after the announcements and compared them to
determine whether there were changes. In addition, this
study calculated the standard deviations to establish the
spreads from the means.
Kenya was not significant. Table 4 presents the results of
ANOVA conducted to compare the difference in group
means on the effect of Profit warnings Announcements on
the Performance of Security Prices. The results show
F (1,598) = 0.370 and p-value = 0.543. These results
indicate that the Profit warning Announcements was
within the market expectation; therefore, did not trigger
price changes. According to Aswath [20], it is not the
magnitude of the earnings change that matter, but the
“surprise” in the earnings, measured as the earnings
change relative to expectations. As such, when a company
announce earnings, markets will react to the “news” in the
announcement, but the way the news is measured has to
be relative to expectations. Under the Market Expectation
Theory, security prices tend to rise when earnings results
exceed market expectations and decline when earnings
results are below market expectation. Brown, [2] states
that a great set of results can see a stock trading lower if
those results were below expectations while a poor set of
results could see a stock trading higher if they were not as
bad as the market was expecting.
Table 2. Descriptive Statistics
Before
Mean abnormal
return
After
% Change
0.00
0.00
0
Standard
Deviation
Before After % Change
0.04
0.04
0.00
Descriptive Statistics Table 2 presents the mean
abnormal return and standard deviation results before and
after the Profit Warning Announcements. The results
show zero percent (from 0.00 (SD = 0.04) to 0.00
(SD = 0.04)) upon Profit Warning Announcement. The no
change in mean imply the market efficiency efficient at
the informational level while low standard deviation
suggests that the spread was around the mean.
Figure 2. Normality Test (Source: Researcher (2019))
Table 3. Homogeneity Test
Levene Statistic
df1
df2
p-value
.023
1
598
.880
Table 3 presents the results of the Homogeneity of
variances on the Effect of Profit Warning Announcements
on the Performance of Security prices of the companies
listed on the NSE, Kenya, using Levene's test. The
results show variances were equal, F (1,598) = .023,
p-value = .880. Since the p-value is greater than 0.05 level,
the Homogeneity assumption is confirmed.
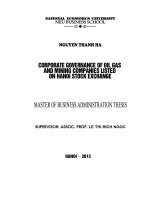
Figure 1 and Figure 2 presents the results of the test for
Normality on the effect of Profit warning Announcements
on the Performance of Security prices of companies
listed on the NSE, Kenya. The Histograms appear to be
bell-shaped, thus confirming Normality.
This study formulated null-hypothesis Ho that the
Effect of Profit warnings Announcements on the
Performance of Securities of companies listed on the NSE,
19
Figure 3. Normality Test (Source: Researcher (2019))
20
Journal of Finance and Accounting
Table 4. Significance Test
Sum of Squares
df Mean Square
Between Groups
.001
1
.001
Within Groups
.821
598
.001
Total
.822
599
F
p-value
.370
.543
Similarly, statistical insignificance, according to
Regnault [15], may be attributed to the market being
efficient in weak-form. According to Regnault [15], the
market is efficient in weak-form if investors cannot obtain
abnormal returns by analyzing relevant historical
information about the securities, rendering investment
tools like filter strategy, technical analysis to be
ineffective. These results show that all information was
incorporated in the security prices at the time of the Profit
warning Announcements.
The finding of this study is inconsistent with the
findings of Benabdennbi and Atrakouti [25] study on the
impact of the of Profit warnings Announcement on their
stock prices of Moroccan companies using 71 Profit
warnings from 35 companies listed in the Casablanca
Stock Market. The study used the market model from the
simple event study methodology in order to look at the
fluctuations of companies’ abnormal returns, cumulative
abnormal returns using a regression model and a t-test
technique. The study found abnormal return happened at
the exact day of the announcement of the profit warning
(t=0) and that CAR showed that the abnormal returns
spread throughout the eight following days after the profit
warnings announcement. The inconsistency between
Benabdennbi and Atrakouti’s [25] study, and this study is
on account o, location of the studies, and the techniques
used (regression analysis vis a vis ANOVA). Shuxing,
Khelifa, Abdelhafid, and Brahim [26] investigated the role
of time-varying betas, event-induced variance, and
conditional heteroskedasticity in the estimation of
abnormal returns around important news announcements
using event study methodology. The study was based on
the stock price reaction to profit warnings on firms listed
on the Hong Kong Stock Exchange. The study found the
presence of price reversal patterns following both positive
and negative warning and statistical significance of some
post-positive-warning cumulative abnormal returns to
disappear and their magnitude to drop to the extent that
minor transaction costs would eliminate the profitability
of the contrarian strategy. The inconsistency between
Shuxing, Khelifa, Abdelhafid, and Brahim’s [25] study,
and this study is on account of the location of the studies,
the topic of the studies and the techniques used.
Maarten, [27] in a study on how the market reacts
to a Profit warning Announcement in the short and
medium-term examined 117 first-time profit warnings
issued by firms listed on Euronext Amsterdam using Event
Study Methodology, t-Test, and Univariate/Multivariate
Regression Analysis. Maarten’s [27] study found that
substantial negative abnormal returns followed profit
warnings in the short-term while in the medium-term,
abnormal returns continued to drift downward for the
entire twelve months post-event period. The inconsistency
between Maarten’s [27] study and this study may be due
to techniques used and the size of the sample; Kiminda,
Githinji, and Riro [35] examined share returns following
unexpected corporate profit warnings announcements. The
study tested whether there were abnormal returns on share
prices after the announcement of profit warnings on 510
companies quoted on the Nairobi Securities Exchange
(NSE), using the event study on one hundred- and
fifty-days event window. The study found that profit
warning had an impact on the stock return in the NSE and
the impact was negative and significant for the period of
pre-warning and post warning and on the day of
the actual announcement. There were also indications of
information leakages where there were negative abnormal
returns days before the profit warning announcements.
The inconsistency between Kiminda, Githinji, and Riro’s
[28] study and this study may be due to the number of
days on the window. Whereas Kiminda, Githinji, and
Riro’s [28] study used 150 days, this study used 41 days.
5. Summary and Conclusions
5.1. Summary of the Findings
This study investigated the effect of Profit warning
Announcements on the Performance of Securities Prices
of companies listed on the Nairobi Securities Exchange,
Kenya. The study collected data from 10 companies listed
on the Nairobi Securities Exchange, Kenya analyzed using
the Event Study Methodology and the ANOVA technique.
The study revealed insignificant result
5.2. Findings
This study formulated a hypothesis that the “Profit
warning Announcements has no significant effect on the
Performance of Security Prices of company listed on the
NSE, Kenya.” The Study tested the hypothesis and found
that the effect of Profit warning Announcements on the
Performance of Security Prices did not have significant
effect on the Performance of Security Prices. The Study
was conducted at 5 percent significant level, and gave
p-value of .543.
5.3. Conclusions
Based on the findings of the study, the study concludes
that Profit warning Announcement did not have effects on
the Performances of Security Prices. This is demonstrated
by significance tests yielding p-values greater than 5
percent significant level.
These results could be due to the number of companies
studied, the estimation of the event window or the
technique used. Since the study objectives did not yield
statistically significant results, this study concludes that
the Null hypothesis was, in fact, true. The study was
conducted for ten companies listed on the NSE, Kenya.
The test for significance was done through the null
hypothesis using ANOVA. The null hypothesis was that
the Announcements did not have significant effects on the
performance of securities and the alternative hypotheses
was that Announcements did have significant effects on
the performance of securities. The estimation period was
200 days, whereas the event period was 41 days for the
study period (January 2013 to December 2017).
Journal of Finance and Accounting
21
5.4. Recommendations
[13] Gordon, Myron J. (1962). The investment, Financing and
Based on the data, the factors, and the methodology used
in this study, and since there are many prior studies in this
area, the finding of this study indicates possible directions
for future research. As the study has revealed, there are
some similarities, differences, and results that may not
have been covered, and, which may be useful for companies
listed or not listed on the NSE, Kenya. Future research
should investigate specific companies that were affected
by the decline in security prices and companies listed on
other security exchanges in order to generalize the findings.
Further, this study recommends companies listed on the
NSE, Kenya, to be encouraged to date their financial
statements and other documents. Dating records and the
financial statements will provide the regulators, investors,
the market players, and the public with the date when the
financial statements were approved, and corporate action
made. Finally, the regulator should strengthen regulations.
Strengthen regulations will ensure compliance with insider
trading laws by market players hence improve market
efficiency, and build investors and public confidence,
establish relevant policies to enhance the efficiency of the
securities exchange.
[14] Ross, S. A. (1977). The Determination of Financial Structure: The
Valuation of Corporation. Richard D. Irvin.
[15]
[16]
[17]
[18]
[19]
[20]
[21]
[22]
[23]
References
[1]
Boyes, W. (2011). Managerial Economics: Market and the Firm.
2 ed. Cengage Learning. South –Western.
/>[2] Brown, S. (2019). How market expectations can move stock prices.
/>[3] Schwert G. W. (1981) Using Financial Data to Measure Effects of
Regulation. Journal of Law and Economics, 24 (April 1981) 121-158.
[4] Modigliani, F. (1971), “Monetary Policy and Consumption:
Linkages via Interest Rate and Wealth Effects in the FMP Model,
Consumer Spending and Monetary Policy: The Linkages”, Federal
Reserve Bank of Boston Conference Series, Conference Series
No. 5, June 1971.
[5] Bernanke, B. and Gertler, M. (1989). Agency Costs, Net Worth,
and Business Fluctuations. The American Economic Review,
Vol. 79, No. 1 (Mar., 1989), pp. 14-31.
[6] Kiyotaki and Moore, (1997). Credit Cycles. Journal of Political
Economy. Vol. 105, No. 2 (April 1997), pp. 211-248.
[7] Uduak B. U., Emmanuel I. M., Sunny O A (2017). Stock Price
Movements and the Value of Firms in Nigeria: Theoretical and
Empirical Realities. IOSR Journal of Business and Management
(IOSR-JBM) e-ISSN: 2278-487X, p-ISSN: 2319-7668. Volume 19,
Issue 2. Ver. II (Feb. 2017), PP 45-54.
[8] Schwert, G. W. (1990). Stock Returns and Real Activity: A
Century of Evidence. The Journal of Finance Vol. 45, No. 4 (Sep.,
1990), pp. 1237-1257.
[9] Pearce, D. K., (1983). Stock Prices and the Economy. Economic
Review – Federal Reserve Bank of Kansas City. November 1983.
[10] Modigliani, F. and Miller Merton H., (1961). Dividend Policy,
Growth and Valuation of the Shares. Journal of Business. Vol.
XXIV (October 1961), pp. 411-33.
[11] Pettit, R. R. (1976). The Impact of Dividend and Earnings
Announcements: A Reconciliation. The Journal of Business, 1976,
vol. 49, issue 1, 86-96.
[12] Aharony, J. and Swary, I. (1980), "Quarterly Dividend and
Earnings Announcements and Stockholders’ Return: An Empirical
Analysis”, The Journal of Finance, vol. 35, no.1, pp. 1-12.
[24]
[25]
[26]
[27]
[28]
[29]
[30]
[31]
[32]
[33]
[34]
[35]
Incentive-Signaling Approach. Bell Journal of Economics, Vol. 8,
No. 1. (Spring, 1977), pp. 23-40.
Regnault, J. (1863). Calcul des Chances et Philosophie de la
Bourse, Mallet-Bachelier et Castel, Paris.
/>Fama, E. F., Fisher, L., Jensen, M. C. and Roll, R. (1969). The
Adjustment of Stock Prices to New Information. International
Economic Review, 10, 1-21.
Rao S. N. (2010). Limitations of the Efficient Market Hypothesis.
/>Poitras, G. (2011). Valuation of Securities: Philosophy, History
and Application. World Scientific Publishing Co. Singapore.
Kelikume, I., (2016). New evidence from the efficient market
hypothesis for the Nigerian stock index using the wavelet unit root
test approach. The Journal of Developing Areas Volume 50,
Number 5, 2016 (Special Issue). pp. 185-197.
Aswath, D., (2012). Investment Valuation: Tools and Techniques
for determining the Value of Any Asset. 3rd Ed. John Wiley and
Sons.
Feltham, G. A., and J. A. Ohlson, (1995). Valuation and clean
surplus accounting for operating and financial activities,
Contemporary Accounting Research. 11, 689-731.
Bajkowski, J. (2016). Are All Earnings Surprises Equal?
American Association of Individual Investors Journal.
/>Tserendash T, Xiaojing W. and Catherine L., (2010). The
relationship between the rofit warning and stock returns:
Empirical evidence in EU markets
http//umu.divaportal.org/smash/get/diva2:394405/FULLTEXT01.pdf.
Healy P. M. and Krishna, G. P., (2003). The Fall of Enron.
Journal of Economic Perspectives— Volume 17, Number 2, Spring
2003 Pp 3-26.
Benabdennbi, Y. and Atrakouti, A. (2019). The Impact of Profit
Warnings on Casablanca Stock Market. Journal of Stock & Forex
Trading. 7: 1.
Shuxing Y., Khelifa M., Abdelhafid B. and Brahim S (2017).
Stock price reaction to profit warnings: the role of time-varying
betas. Review of Quantitative Finance and Accounting.
Maarten H., (2011). Stock Returns Following Profit Warnings:
Evidence from the Dutch Stock Market.
/>Kiminda, R.W. Githinji, C. K., and Riro G. K., (2014). Effects of
Profit Warnings on the Announcement on Performance of Stocks
in the Nairobi Securities Exchange. European Journal of Business
and Social Sciences, Vol. 3, No. 3, pp 150-168, June 2014.
P.P. 150-168.
Crotty, M. (1998). The Foundations of Social Research. London:
Sage.
Macionis, J. J. and Gerber, L. M., (2010). Sociology, Seventh
Canadian Edition, Pearson Education, Canada.
Trochim W. M.K. (2006). The Research Methods Knowledge
Base? />Sunjoo, B. and Erika, S F. (2013). Secondary analysis of national
survey datasets. Japan Journal of Nursing Science. (2013) 10,
130-135.
Treynor, Jack L. 2012. Treynor on Institutional Investing:
"Toward a Theory of Market Value of Risky Assets".
Resnick, D. B. (2015). What is Ethics in Research and Why is it
Important?
/>Kiremu K. G., Galo N, Wagala A and Mutegi J. K. (2013). Stock
Price and Volumes Reaction to Annual Earnings Announcement:
A Case of the Nairobi Securities Exchange. International Journal
of Business, Humanities and Technology.Vol. 3 No. 2; February
2013.
© The Author(s) 2019. This article is an open access article distributed under the terms and conditions of the Creative Commons
Attribution (CC BY) license ( />