Price-volume granger causality tests in the egyptian stock exchange (EGX)
Bạn đang xem bản rút gọn của tài liệu. Xem và tải ngay bản đầy đủ của tài liệu tại đây (298.16 KB, 13 trang )
Accounting and Finance Research
Vol. 8, No. 3; 2019
Price-Volume Granger Causality Tests
in the Egyptian Stock Exchange (EGX)
Kobana Abukari1 & Tov Assogbavi1
1
Laurentian University, Sudbury, Canada
Correspondence: Kobana Abukari, Laurentian University, Sudbury, Canada
Received: June 5, 2019
doi:10.5430/afr.v8n3p48
Accepted: June 27, 2019
Online Published: June 28, 2019
URL: />
Abstract
The Egyptian stock exchange (EGX) has undertaken a number of initiatives over the years to help improve its
microstructure. This has motivated us to use Granger causality tests to examine the effects that some of these initiatives
may have had on the information dissemination environment of the EGX. We hypothesize that following the
implementation of these initiatives, there would be improvements in information dissemination, which should lead to
improvements in the contemporaneous relation between stock returns and trading volume. Additionally, since the EGX
is an emerging stock market, we conjecture that there would be Granger causality between stock returns and trading
volume. Using weekly EGX data on the 34 most active companies stretching from 2011 to 2017, this study finds that
price changes Granger cause trading volume up to 8 weeks (lags), supporting the sequential information arrival model
in the EGX. We also find a robust contemporaneously positive asymmetric relationship between price change and
trading volume. The results confirm our hypotheses, two well-documented characteristics of the price-volume
relationship as well as two major adages of Wall Street, namely, it takes volume to move prices and volume in bull
markets is heavier than volume in bear markets. Overall, our results imply that although there is some sequential
diffusion of information, the EGX’s efforts at improving its microstructure through initiatives such as the 2009
Presidential Degree on structure and governance, appear to have helped in improving access to information – as
exemplified by our evidence of strong contemporaneous positive price-volume relationship.
Keywords: stock returns, trading volume, emerging stock market, price-volume relationship, Granger causality tests
1. Introduction
As the second largest stock market in Africa (Omran, 2007) and the regional hub market of the North Africa and
Maghreb region (Hearn et al., 2010), the Egyptian stock exchange (EGX) is one of the premier stock exchanges in
Africa and the leading stock exchange in North Africa. Desirous of improving its trading infrastructure in order to
appeal to investors (including foreign investors and institutional investors), the EGX, according to Girard and Omran
(2009), has, since May 2001, been implementing a number of initiatives including the introduction of automated
trading system, establishment of the Egypt Information Dissemination Company to disseminate information and
increase transparency, etc. Girard and Omran (2009) examined the effects of the earlier initiatives implemented by the
EGX and find that over the 1998 to 2005 period, the initiatives have led to some improvements in trading efficiency
and information dissemination. However, the EGX has continued its path of improvements including, notably, the
2009 enactment of Presidential Decree No. 191 on the structure and governance of the EGX (see history of the EGX at
/>Given the continued attempts at improving the microstructure of the EGX, it is crucial to establish whether or not the
recent initiatives (including Presidential Decree No. 191) have improved the information dissemination environment
of the EGX. And yet, no study, to the best of our knowledge, has examined the information architecture of the EGX
since the study by Girard and Omran (2009) which covered the 1998 to 2005 period. Our study therefore attempts to fill
this gap by examining the price-volume relationship in the EGX, with the hope of establishing whether the recent
initiatives have helped enhance the information architecture of the EGX.
While there are several approaches to examining the structure of financial markets (including analyzing the
price-volatility link as in Girard and Omran, 2009), the predominant view in the literature seems to be that the stock
price change-trading volume analytic approach is perhaps one of the most robust approaches. As Karpoff (1987), for
instance observed, the relationship between price change and trading volume provides some of the best insights into
Published by Sciedu Press
48
ISSN 1927-5986
E-ISSN 1927-5994
Accounting and Finance Research
Vol. 8, No. 3; 2019
the structure of financial markets. Following this rationalization, several authors have used the price-volume
relationship to investigate the structure of financial markets, including Hiemstra and Jones (1994), Assogbavi et al.
(1995), Saatcioglu and Starks (1998), Lee and Rui (2002), Chen (2012) and Sampath and Garg (2018). We follow this
strand of literature and use the price-volume relationship to investigate the hypothesis that stock returns and trading
volume have a positive contemporaneous relationship as well as the hypothesis that there exist causal relationships
between stock price changes and trading volume in the Egyptian stock exchange.
Using data on the 34 heavily traded stocks listed on the EGX from 2011 to 2017, we find strong evidence that price
changes Granger cause trading volume up to 8 weeks (lags), which supports the notion of some sequential information
dissemination in the EGX. We also find strong evidence that trading volume is positively and contemporaneously
related to price changes and this relationship is asymmetrically positive (i.e., positive price changes lead to heavier
volume than negative price changes). This strong and robust contemporaneous relationship implies that the recent
EGX improvement initiatives may have had positive effects on the instantaneous incorporation of information into
stock prices and trading volume, leading to the strong contemporaneous relationship between stock price changes and
trading volume. As well, these results are consistent with our hypotheses and with previous studies (e.g., Chen, 2012;
Li et al., 2016; Sampath and Garg 2018) that document a significant contemporaneous relationship between the two
variables. The results also support two Wall Street adages: “it takes volume to move prices” and “volume is heavier in
bull markets than in bear markets”. It should, however, be noted that the significant unidirectional Granger causality
(from stock price changes to trading volume) with longer causal lags (of 8 weeks) that we find suggests that the EGX is
still maturing, as far as its information dissemination architecture is concerned. Our Granger causality results also
highlight the possibility that noise traders are using past stock price changes to inform their trading decisions, leading
to past stock price changes Granger causing trading volume. While our study is similar to Girard and Omran (2009)
because it also provides insights on the structure of the EGX, it differs from their study in a couple of important ways.
First, we analyzed the price-volume relationship while they studied the price-volatility relationship. Second, while
their study covered the 1998-2005 period, our study covers the recent 2011-2017 period.
The remainder of this paper is organized as follows. The relevant literature review is presented in section two; the
hypothesis, data and methodology are discussed in section three; our results are analyzed and discussed in section four;
and, section five concludes the paper.
2. Prior Literature
The importance of understanding the relationship between price change and trading volume was first articulated by
Karpoff (1987). Among other reasons, the price-volume relationship helps discriminate between competing theories
on information dissemination in financial markets; helps in analyzing the validity of information content of event
studies; helps in assessing the distribution of stock returns (e.g., Epps and Epps, 1976); and, finally, it can help to better
understand technical analysis (see Blume et al., 1994). In addition, the price-volume relationship can help establish the
validity of two important Wall Street folklore related to stock prices and trading volume, viz.: “it takes volume to make
prices move” and that “volume is heavier in bull markets than in bear markets” (Karpoff, 1988). The important role that
the relationship between price change and volume plays in helping us understand the structure of financial markets has
motivated several authors, over the last four decades, to offer theoretical expositions and/or empirical evidence on the
subject matter. It has been established, from both the theoretical and empirical literatures, that price change has a
positive correlation with trading volume (e.g., Karpoff, 1987; Hiemstra and Jones, 1994).
Theoretically, Copeland’s (1976) landmark paper on the sequential information arrival model, which has been
extended by Jennings et al. (1981), suggests that stock price changes are positively associated with trading volume
because of the expectation that market participants’ demand will be continuously sequentially adjusted as new
information is received, until the new information is fully received by all market participants and a final equilibrium is
established. Karpoff (1987) discusses other theoretical models that hypothesize a positive correlation between returns
and volume including the mixture of distributions model and the conjecture that the volume-return nexus is facilitated
by its link to systematic risk. Noise trader models and tax- as well as non-tax-related motives also suggest a positive
association between stock returns and trading volume (Hiemstra and Jones, 1994).
On the empirical front, many studies have confirmed the presence of a positive relationship between stock price change
and trading volume in different markets. Starting from the 1960s to about 1990, price-volume relationship studies were
mainly conducted on advanced stock markets. However, in recent years, with growing and better structured emerging
markets, numerous empirical results using data on emerging economies such as South America, China and India have
started surfacing. Karpoff (1987) concludes, after reviewing the earlier studies, that volume is positively linked to the
magnitude of price change and to price change per se in equity markets.
Published by Sciedu Press
49
ISSN 1927-5986
E-ISSN 1927-5994
Accounting and Finance Research
Vol. 8, No. 3; 2019
The price-volume empirical literature continues to grow over time and an increasing number of studies continue to
investigate the price-volume relationship in developed as well as in emerging markets. Hiemstra and Jones (1994) use
U.S. data to examine the dynamic relation between stock returns and trading volume and find, on the one hand, the
presence of a unidirectional causality from stock returns to percentage volume changes when they use linear Granger
causality tests. However, they find the presence of a bidirectional relationship, on the other hand, when they use
nonlinear Granger causality tests. Assogbavi et al. (1995) use Canadian data and validate the positive asymmetric
price-volume relationship. The authors demonstrate that positive price changes are associated with higher trading
volume than negative price changes. Brailsford (1996) use Australian stock market data and finds support for the
asymmetric price-volume relationship. In emerging markets, Saatcioglu and Starks (1998) also find a positive
relationship between trading volume and both the magnitude of price change and price change per se – in support of
asymmetry; but they do not find strong evidence supporting the contention that stock prices Granger-cause trading
volume. Lee and Rui (2002) document evidence of a contemporaneously positive relationship between trading volume
and stock returns in the U.S., U.K. and Japanese stock markets but they do not find evidence of any causality between
trading volume and stock returns. Using S&P 500 price index data, Chen (2012) finds strong evidence of asymmetric
contemporaneous relationship between returns and volume. The author also finds that stock returns have a
contemporaneously negative correlation with trading volume (i.e., negative asymmetry) in bear markets but are
contemporaneously positively correlated with volume (i.e., positive asymmetry) in bull markets. Chen’s (2012)
findings also support the presence of unidirectional Granger causality in the S&P 500, with past stock returns
predicting trading volume in both bear and bull markets but past trading volume having a weaker ability to predict
returns. Gold et al. (2013) analyze the Dow Jones Industrial Average component stocks and find, consistent with the
tax-loss hypothesis, positive average abnormal daily December trading volume for depressed stocks (i.e., stocks whose
prices have declined) and negative average abnormal daily December trading volume for other stocks. Cook and
Watson (2017) use different definitions of price change and find strong contemporaneous and bidirectional causal
relationship between price change (calculated using daily FTSE 100 high values) and trading volume in the U.K. Kao
et al. (2019) use U.S. data and find that contemporaneous and lagged trading volume positively influence stock returns,
leading them to conclude that there is an asymmetric correlation between price change and trading volume.
The recent literature continues to support the contemporaneous and causal price-volume relationship in not only
developed markets but in emerging markets as well. For instance, Li et al. (2016) find, using nonlinear Granger tests, a
bidirectional causality between stock price changes and trading volume in China. Hsu et al. (2016) examine the
price-volume relationship around stock price reversals and rebounds in Taiwan and find asymmetric effects on the
price-volume relationship around price increases as well as price decreases. As well, the findings of Gupta et al. (2018)
indicate that lagged stock returns Granger cause trading volume in the long run in both China and India, while the
findings of Sampath and Garg (2018) do not only indicate strong evidence of a positive association between stock
returns and trading volume in India but also indicate a lead-lag relation with strong evidence of Granger causality from
stock returns to trading volume. Abdelzaher (2019) finds the January 25, 2011 Arab Spring revolution in Egypt
significantly negatively affected trading volume in the one-year pre- and post-event periods. Girard and Omran (2009)
find that earlier initiatives undertaken by the EGX to improve its information environment have led to some
improvements in trading efficiency and information dissemination over the 1998 to 2005 period.
The price-volume relationship has also been documented in markets other than equity markets. In the foreign exchange
market, Kumar (2017) finds a contemporaneous relationship between currency futures price changes and trading
volume; the author also finds a one-way Granger causality running from currency futures price changes to trading
volume. In the bitcoin market, El Alaoui et al. (2018) find a positive association between bit coin price changes and
trading volume. In the real estate market, while Tsai (2019) finds that price and volume efficiently react to information
with no lead-lag relationships under normal conditions, the author reports that during boom periods or busts periods in
the U.S. housing market, there is a lead-lag relationship between price and volume.
However, it is important to mention that not all of the price-volume relationship studies find evidence of a positive
relationship between stock returns and trading volume. For example, Saatcioglu and Starks (1998) find that the
well-documented contemporaneous association between returns and volume is insignificant in Mexico and that the
contemporaneous relation between absolute returns and volume is insignificant in Brazil. Wang et al. (2018) also find
that out-of-sample, the price-volume relationship has a weak predictive power.
So far in the literature, there is a dearth of empirical evidence on the price-volume relationship in African stock markets.
However, with the Africa continent becoming an important economic player (Leke and Yeboah-Amankwah, 2018;
Leke et al., 2018) and African financial markets beginning to appeal to global investors who look to diversify their
portfolios, there is an increasing need to investigate the price-volume relationship in the major African stock markets.
Published by Sciedu Press
50
ISSN 1927-5986
E-ISSN 1927-5994
Accounting and Finance Research
Vol. 8, No. 3; 2019
This study is an attempt to provide the much-needed evidence on the price-volume relation in Africa.
3. Hypothesis, Data and Methodology
3.1 Hypothesis
Since the EGX has undertaken several initiatives in recent years to improve the information environment of the market
and Girard and Omran (2009) find earlier initiatives to have led to some improvements, we contend that the recent
initiatives would also lead to some improvements in information flow in the EGX. As a result, we expect to find a
strong contemporaneously positive relationship between price change and trading volume. Therefore, we hypothesize
that:
H1: The magnitude of stock returns would be contemporaneously positively related to trading volume in the EGX.
H2: Stock returns per se would be contemporaneously positively related to trading volume in the EGX.
However, since the EGX is still an emerging market with evolving market microstructure, we expect to find some level
of market inefficiency – as it is the case for most emerging markets. As a result, past trading volume and past stock
price changes would potentially have some influence on current trading volume and stock returns. Consequently, we
hypothesize that:
H3: Stock returns would Granger-cause trading volume in the EGX.
H4: Trading volume would Granger-cause stock returns in the EGX.
3.2 Data and Sample
The EGX data used in this paper come from DataStream. They are weekly data covering our study period that stretches
from 2011 to 2017 and comprise closing stock prices, volume traded, market capitalization and number of shares
outstanding. Since the variables needed to test our hypotheses are stock returns and trading volume, we calculate them
using the DataStream data. Stock return/price change is calculated as the natural log of the current week’s price divided
by the natural log of the previous week’s price. Trading volume is calculated as volume traded divided by shares
outstanding. To avoid common problems related to missing data in the analysis, only corporations with weekly data
covering at least 95% of the entire study period are selected. Out of the about 167 EGX listed firms that have some data
in the DataStream database at the end of our sample period in 2017, only 34 are eligible for inclusion in our analysis.
The descriptive statistics about the sampled companies are presented in Table 1.
Published by Sciedu Press
51
ISSN 1927-5986
E-ISSN 1927-5994
Accounting and Finance Research
Vol. 8, No. 3; 2019
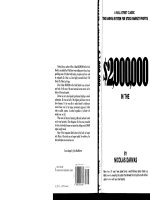
Table 1. Descriptive Statistics
Trading
Volume
Market Cap (EGP
Millions)
Average
Average
Stock Returns
Mean
ALEXANDRIA MRL.OILS
Median
Std Dev
Skewness
Kurtosis
0.0030
0.0000
0.0491
0.8292
11.9527
0.0065
5,781.02
-0.0024
0.0000
0.0702
-0.0011
3.8828
0.0094
2,722.17
0.0005
0.0000
0.0700
0.5524
6.7617
0.0133
1,016.72
ARABIA INVS.DEV.FIN.
-0.0009
0.0000
0.0662
0.2279
6.0685
0.0132
487.44
ASEK COMPANY FOR MINING
-0.0005
0.0000
0.0670
0.3468
6.1371
0.0026
364.00
CITADEL CAPITAL
-0.0055
-0.0076
0.0687
-0.0609
4.6818
0.0098
COML.INTL.BANK (EGYPT)
0.0032
0.0005
0.0453
-0.0649
5.1908
0.0013
EFG HERMES HDG.
0.0004
0.0000
0.0622
0.3366
5.6866
0.0039
7,979.44
-0.0011
0.0000
0.0687
-0.1091
4.6124
0.0075
1,170.71
0.0006
-0.0024
0.0781
0.7641
7.8015
0.0018
3,898.62
EGYPTIAN CHEMICAL IND
-0.0010
0.0000
0.0793
0.5240
8.5386
0.0029
2,726.60
EGYPTIAN ELECTRIC CABLE
-0.0002
0.0000
0.0567
-0.0257
4.2779
0.0068
469.98
EGYPTIAN FINL.& INDL.
-0.0002
-0.0040
0.0536
0.3754
3.9545
0.0038
751.45
EGYPTIAN KUWAITI HOLDING
-0.0019
0.0000
0.0472
-0.0654
8.1047
0.0008
787.10
EGYPTIANS ABROAD INVS.
-0.0009
-0.0025
0.0698
-0.2893
5.7629
0.0071
179.55
EGYPTIANS HOUSING DEV.
-0.0003
-0.0033
0.0702
-0.0515
6.0731
0.0044
334.79
EL AHLI INV.& DEV.
-0.0006
0.0000
0.0712
-0.0309
5.3814
0.0056
174.36
ELSAEED CONTRACT AND REAL ESTATE
0.0003
0.0000
0.0587
-0.0274
4.9961
0.0167
552.84
EXTRACTED OILS DERIVATRE
0.0008
0.0000
0.0599
-0.0396
5.9255
0.0074
152.53
GIZA GENERAL CONTRACTING
0.0008
0.0000
0.0645
-0.1597
5.4004
0.0857
281.37
HELIOPOLIS HOUSING
0.0047
0.0003
0.0617
0.3026
5.4226
0.0046
-0.0055
0.0000
0.0520
-0.0378
7.9924
0.0009
0.0033
0.0005
0.0573
0.4337
6.4743
0.0082
-0.0018
0.0000
0.0656
0.1126
7.0530
0.0057
NATIONAL DEV.BANK
0.0024
0.0012
0.0589
0.2162
5.6211
0.0019
1,286.00
PALM HILLS DEVS.SAE
-0.0005
0.0000
0.0708
-0.0349
5.4333
0.0082
4,489.63
PIONEERS HOLDING
0.0032
0.0000
0.0726
0.1641
4.2999
0.0039
4,202.26
SIDI KERIR PETROCHEM.
0.0015
0.0000
0.0395
0.0550
5.1311
0.0004
7,850.35
SIX OF OCT.DEV.& INV.
0.0008
-0.0013
0.0721
0.4619
7.1363
0.0072
3,119.06
-0.0001
-0.0021
0.0568
-0.1981
4.6855
0.0013
2,346.84
0.0005
0.0000
0.0596
-0.2239
5.5968
0.0017
13,573.42
-0.0010
0.0007
0.0423
-0.5255
4.4741
0.0004
20,954.50
UNITED ARAB SHIPPING
0.0005
0.0000
0.0739
0.1619
5.4543
0.0131
180.60
UNITED HOUSING & DEV.
0.0019
-0.0008
0.0573
-0.0054
5.7181
0.0038
942.24
Overall Average
0.0001
0.0000
0.0630
0.1541
6.5180
0.0080
4,209.34
AMER GROUP
ARAB COTTON GINNING
EGYP.FOR TOURISM RSTS.
EGYPT IRON & STEEL
MARIDIVE & OIL SERVICES
MEDINET NASR HOUSING
MENA TOURISM & RLST.INV.
SOUTH VALLEY CEMENT
TALAAT MOUSTAFA GROUP
TELECOM EGYPT
2,589.21
40,976.51
5,080.04
350.56
5,217.57
128.20
Presented in Table 1 are descriptive statistics (i.e., mean, median, standard deviation, skewness and kurtosis) on stock returns as well as average
volume and average market capitalization for the 34 sampled EGX firms over the 2011 to 2017 sample period.
Published by Sciedu Press
52
ISSN 1927-5986
E-ISSN 1927-5994
Accounting and Finance Research
Vol. 8, No. 3; 2019
Table 1 demonstrates that the 34 companies cut across the size spectrum – from small- to medium- to large-sized firms.
While the average market capitalization is about 4.2 billion EGP, market capitalization of the sampled firms ranges
from a minimum of 128.2 million EGP to a maximum of 41.0 billion EGP over the sample period. Sampling firms
across the size spectrum is beneficial because the results of the study would be generalizable to a broad range of
companies including small, medium and large companies. The average weekly stock return is about 0.01% and average
weekly trading volume is about 0.8%.
3.3 Methodology
Before investigating the stock price change-trading volume causality question, we first analyze the two
contemporaneous characteristics of the price-volume relationship in the EGX. Since the vector autoregressive (VAR)
model is the predominant methodology used to examine the return-volume relation in the literature, we follow the
literature and use the same approach in this study. For the causality relationship tests, we follow Chen (2012) and use
Granger causality tests.
3.3.1 Estimating Contemporaneous Price-Volume Relationship
To explore the contemporaneous correlation between stock returns and trading volume, we follow Karpoff (1988) and
estimate the following regression equations:
where 𝑉𝑡 =
𝑅𝑡 = ln(
𝑉𝑡 =∝ +𝛽1 |𝑅𝑡 | + 𝜀𝑡
(1)
𝑉𝑡 =∝ +𝛽1 𝑅𝑡 + 𝜀𝑡
(2)
𝑉𝑜𝑙𝑢𝑚𝑒 𝑇𝑟𝑎𝑑𝑒𝑑𝑡
𝑁𝑢𝑚𝑏𝑒𝑟 𝑜𝑓 𝑆ℎ𝑎𝑟𝑒𝑠 𝑂𝑢𝑡𝑠𝑡𝑎𝑛𝑑𝑖𝑛𝑔𝑡
𝐶𝑙𝑜𝑠𝑖𝑛𝑔 𝑃𝑟𝑖𝑐𝑒𝑡
𝐶𝑙𝑜𝑠𝑖𝑛𝑔 𝑃𝑟𝑖𝑐𝑒𝑡−1
and
).
We estimate Equation 1 for each of the sampled companies using the ordinary least squares (OLS) regression
technique to first test the cotemporaneous positive relationship between the magnitude of price change and trading
volume (H1). Then, still using the same OLS regression technique, we analyze the asymmetric nature of the
relationship by regressing the returns per se on volume as formulated in Equation 2 (H2). To investigate the relationship
at the aggregate portfolio level for the combined 34 sampled companies, we pool the data for the companies and use the
panel data with firm fixed effects regression technique to estimate Equation 1 and Equation 2 for the pooled data.
3.3.2 Estimating Price-Volume Causal Relationship
The causal relationships between stock price change and trading volume (H3 and H4) are analyzed in this paper by
following the extant literature and estimating the following VAR models:
𝑗
𝑉𝑡 =∝ + ∑𝑖=1 𝛽𝑖 𝑉𝑡−𝑖 + ∑𝑘𝑖=1 𝛾𝑖 |𝑅𝑡−𝑖 | + 𝜀𝑡
|𝑅𝑡 | =∝
𝑗
+ ∑𝑖=1 𝛾𝑖 |𝑅𝑡−𝑖 |
+
∑𝑘𝑖=1 𝛽𝑖 𝑉𝑡−𝑖
(3)
+ 𝜀𝑡
(4)
where j and k are the number of lags.
The estimation of VAR models requires the specification of the number of lags to use. To help determine the ideal
number of lags (j and k) for the VAR models, we use Akaike's (1974) information criterion (AIC). Saatcioglu and
Starks (1998) highlighted the possibility of autocorrelation in Granger causality tests. Consequently, we use the
Durbin-Watson as well as the Breush-Godfrey statistics to test for serial correlation. We then use the Cochrane-Orcut
and Prais-Winsten estimation approach to correct for first-order serial correlation in all the VAR regressions.
To validate the conjecture of sequential dissemination of information, we lean on Hiemstra and Jones’ (1994) emphasis
on the important role of tests of causality to help establish whether knowledge of past stock price (trading volume)
movements help improve predictions of contemporaneous and future movements in volume (stock prices). Hence, we
use Granger Causality tests (following Hiemstra and Jones, 1994) to ascertain whether or not there is a unidirectional
or bidirectional causal relationship between stock price change/returns and trading volume.
We use the block exogeneity F test to test for Granger causality. A standard block exogeneity F test of the significance
or otherwise of the 𝛾𝑖 coefficients in Equation 3, will indicate whether or not returns Granger-cause volume (H3). To
determine whether or not volume Granger-cause returns (H4), the significance or otherwise of the block exogeneity F
test for the 𝛽𝑖 coefficients (in Equation 4) is used. If returns Granger-cause volume, then the inclusion of past
returns (in addition to past volume) in the VAR regressions would lead to improved forecasts of future volume.
Likewise, if trading volume Granger-cause stock returns, then the inclusion of past volume (in addition to past
returns) in the VAR models would lead to improved predictions of future stock returns.
Published by Sciedu Press
53
ISSN 1927-5986
E-ISSN 1927-5994
Accounting and Finance Research
Vol. 8, No. 3; 2019
4. Results
4.1 Stock Returns and Trading Volume Relationship
We used a two-pronged approach to analyze the contemporaneous relationship between stock returns and trading
volume. In our first approach, which is aimed at testing hypotheses 1 and 2 for the portfolio of 34 Egyptian Stock
Exchange listed firms, we estimate Equation 1 and Equation 2 by pooling the weekly data for the firms and controlling
for firm fixed effects. The results of the firm fixed effects regressions for the portfolio of 34 Egyptian stocks are
reported in Table 2.
Table 2. Contemporaneous Price-Volume Relation using Pooled Data and Controlling for Firm Fixed Effects
Volume
Volume
0.0511***
-
(7.14)
-
-
0.0487***
-
(9.95)
0.0049***
0.0063***
(2.70)
(3.50)
Yes
Yes
10,964
10,964
R
0.1632
0.1668
F
62.68***
64.36***
Absolute Stock Returns
Stock Returns
Constant
Firm Fixed Effects
N
2
Results of the firm fixed effects regressions that regress trading volume on absolute stock returns and signed stock returns for the pooled sample of
34 EGX firms over the 2011 to 2017 sample period are reported in Table 2. The results for Equation 1 (𝑉𝑡 =∝ +𝛽1 |𝑅𝑡 | + 𝜀𝑡 ) are presented in column
2 while column 3 presents the results for Equation 2 (𝑉𝑡 =∝ +𝛽1 𝑅𝑡 + 𝜀𝑡 ). The symbols ***, ** and * indicate statistical significance at the 1%, 5%
and 10% levels, respectively. (t statistics are in parentheses)
Consistent with prior literature, the results from Table 2 indicate a strong positive contemporaneous relationship
between stock returns and trading volume. The results of the estimates of Equation 1 (Table 2 column 2) support our
first hypothesis (H1) and indicate that there is a strong positive relationship between the magnitude of price change and
trading volume. This finding is also well documented in the literature (e.g., Saatcioglu and Starks, 1998) and lends
support to the Wall Street adage that “it takes volume to make prices move”. In fact, regressing trading volume on
absolute stock returns yields a positive coefficient which is significant at the 1% level. This connotes that in the
Egyptian context, there is strong evidence of a contemporaneously positive relationship between absolute price change
and trading volume.
The results of the firm fixed effects regression that regresses trading volume on stock returns per se (Equation 2) are
reported in Table 2 column 3. The coefficient of the independent variable, the stock returns per se, is positive (as
expected) and statistically significant at the 1% level. The significant positive relationship supports our second
hypothesis (H2) and implies that there is heavy trading volume associated with positive stock returns than negative
stock returns. The strong positive association between returns and volume are not only consistent with prior literature
(e.g., Karpoff, 1987; Hiemstra and Jones, 1994; Lee and Rui, 2002; Sampath and Garg, 2018) but also confirm the
validity of another important Wall Street adage in the Egyptian stock market, that “volume is relatively heavy in bull
markets and light in bear markets”. With R2s that are greater than 15% for both regression models, we conclude that the
price-volume models also fit the data well.
While our first approach involved estimating the contemporaneous price-volume relationship for the pooled portfolio
of 34 companies, our second approach to establishing the extent to which trading volume and stock returns are
contemporaneously correlated involves re-estimating Equations 1 and 2 for each of the 34 individual firms. The results
of regressing absolute trading volume on stock returns (Equation 1) for each company are presented in Table 3.
Published by Sciedu Press
54
ISSN 1927-5986
E-ISSN 1927-5994
Accounting and Finance Research
Vol. 8, No. 3; 2019
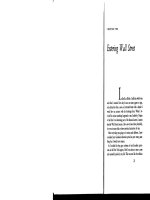
Table 3. Firm Level Absolute Price Change-Volume Relationship
Company
∝
t
𝛽1
t
N
Model F
R2
ALEXANDRIA MRL.OILS
0.0033***
4.56
0.1029***
7.12
322
50.64***
0.1366
AMER GROUP
0.0048***
6.08
0.0860***
7.61
323
57.87***
0.1527
ARAB COTTON GINNING
0.0108***
11.64
0.0508***
3.92
323
15.33***
0.0456
ARABIA INVS.DEV.FIN.
0.0093***
9.75
0.0821***
5.84
321
34.14***
0.0967
ASEK COMPANY FOR MINING
0.0015***
3.91
0.0223***
4.07
323
16.60***
0.0492
CITADEL CAPITAL
0.0070***
7.65
0.0525***
3.95
323
15.63***
0.0464
COML.INTL.BANK (EGYPT)
0.0007***
5.78
0.0175***
6.35
323
40.38***
0.1117
EFG HERMES HDG.
0.0024***
8.06
0.0306***
6.36
322
40.44***
0.1122
EGYP.FOR TOURISM RSTS.
0.0051***
6.45
0.0464***
4.09
323
16.71***
0.0495
EGYPT IRON & STEEL
0.0014***
8.10
0.0072***
3.37
321
11.35***
0.0343
EGYPTIAN CHEMICAL IND
0.0018***
3.82
0.0200***
3.28
321
10.73***
0.0325
EGYPTIAN ELECTRIC CABLE
0.0038***
5.18
0.0702***
5.38
323
28.99***
0.0828
EGYPTIAN FINL.& INDL.
0.0017***
4.23
0.0516***
6.99
323
48.91***
0.1322
EGYPTIAN KUWAITI HOLDING
0.0005**
1.98
0.0098*
1.96
323
3.83*
0.0118
EGYPTIANS ABROAD INVS.
0.0052***
8.03
0.0361***
3.82
323
14.62***
0.0435
EGYPTIANS HOUSING DEV.
0.0032***
7.97
0.0219***
3.81
323
14.49***
0.0432
EL AHLI INV.& DEV.
0.0041***
7.98
0.0282***
3.85
323
14.80***
0.0441
ELSAEED CONTRACT AND REAL ESTATE
0.0109***
7.20
0.1332***
5.20
323
27.04***
0.0777
EXTRACTED OILS DERIVATRE
0.0033***
4.22
0.0921***
6.99
322
48.83***
0.1324
GIZA GENERAL CONTRACTING
0.0714***
4.66
0.2961
1.24
323
1.54
0.0048
HELIOPOLIS HOUSING
0.0019***
4.09
0.0599***
8.14
323
66.33***
0.1712
MARIDIVE & OIL SERVICES
0.0005***
5.47
0.0117***
6.80
323
46.24***
0.1259
MEDINET NASR HOUSING
0.0075***
3.04
0.0159
0.37
322
0.14
0.0004
MENA TOURISM & RLST.INV.
0.0030***
3.68
0.0576***
4.63
323
21.45***
0.0626
NATIONAL DEV.BANK
0.0012***
6.88
0.0167***
5.80
322
33.67***
0.0952
PALM HILLS DEVS.SAE
0.0064***
12.90
0.0340***
4.90
322
24.02***
0.0698
PIONEERS HOLDING
0.0028***
8.15
0.0208***
4.49
321
20.12***
0.0593
SIDI KERIR PETROCHEM.
0.0001***
2.99
0.0100***
8.58
323
73.67***
0.1867
SIX OF OCT.DEV.& INV.
0.0033***
4.81
0.0750***
7.91
323
62.53***
0.1630
SOUTH VALLEY CEMENT
0.0008***
4.73
0.0114***
3.76
323
14.17***
0.0423
TALAAT MOUSTAFA GROUP
0.0004**
2.32
0.0282***
9.02
323
81.28***
0.2021
TELECOM EGYPT
0.0002***
7.36
0.0057***
7.33
323
53.78***
0.1435
UNITED ARAB SHIPPING
0.0094***
8.52
0.0703***
4.71
321
22.22***
0.0651
UNITED HOUSING & DEV.
0.0017***
2.86
0.0501***
4.71
321
22.18***
0.0650
For each of the 34 EGX firms over the 2011 to 2017 sample period, Table 3 presents the Equation 1 (𝑉𝑡 =∝ +𝛽1 |𝑅𝑡 | + 𝜀𝑡 ) OLS regressions’ results
regressing trading volume on absolute stock returns. The symbols ***, ** and * indicate statistical significance at the 1%, 5% and 10% levels,
respectively.
The results of the individual firm level regressions in Table 3 are consistent with the pooled results and corroborate the
strong positive relationship between absolute stock returns and trading volume. As shown in Table 3, a significantly
positive relationship between trading volume and absolute stock returns is documented for 32 firms out of the 34 firms.
Published by Sciedu Press
55
ISSN 1927-5986
E-ISSN 1927-5994
Accounting and Finance Research
Vol. 8, No. 3; 2019
As well, the positive relationship is significant at the 1% level for 31 firms and only 1 firm has a significantly positive
association between absolute price change and trading volume at the 10% level. The firm level results in Table 3 also
support hypothesis 1.
The firm level regressions that regress trading volume on stock returns per se (Equation 2) are reported in Table 4.
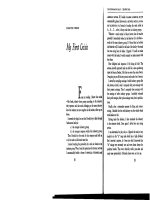
Table 4. Price-Volume Relationship at the Firm Level
Company
∝
t
𝛽1
t
N
Model F
R2
ALEXANDRIA MRL.OILS
0.0063***
10.72
0.0598***
5.11
322
26.09***
0.0754
AMER GROUP
0.0095***
17.96
0.0554***
7.35
323
54.02***
0.1440
ARAB COTTON GINNING
0.0132***
21.47
0.0672***
7.77
323
60.30***
0.1581
ARABIA INVS.DEV.FIN.
0.0132***
20.66
0.0707***
7.46
321
55.71***
0.1487
ASEK COMPANY FOR MINING
0.0026***
10.30
0.0158***
4.29
323
18.42***
0.0543
CITADEL CAPITAL
0.0100***
16.62
0.0437***
5.02
323
25.25***
0.0729
COML.INTL.BANK (EGYPT)
0.0013***
14.17
0.0037*
1.86
323
3.47*
0.0107
EFG HERMES HDG.
0.0039***
18.03
0.0039
1.15
322
1.32
0.0041
EGYP.FOR TOURISM RSTS.
0.0075***
14.30
0.0282***
3.72
323
13.85***
0.0414
EGYPT IRON & STEEL
0.0018***
15.11
0.0096***
6.52
321
42.57***
0.1177
EGYPTIAN CHEMICAL IND
0.0029***
8.48
0.0111**
2.54
321
6.44**
0.0198
EGYPTIAN ELECTRIC CABLE
0.0068***
13.52
0.0466***
5.28
323
27.83***
0.0798
EGYPTIAN FINL.& INDL.
0.0038***
14.70
0.0349***
7.29
323
53.13***
0.1420
EGYPTIAN KUWAITI HOLDING
0.0008***
4.40
-0.0022
-0.57
323
0.33
0.0010
EGYPTIANS ABROAD INVS.
0.0071***
17.10
0.0385***
6.37
323
40.59***
0.1122
EGYPTIANS HOUSING DEV.
0.0043***
17.22
0.0270***
7.49
323
56.04***
0.1486
EL AHLI INV.& DEV.
0.0057***
18.03
0.0395***
8.89
323
78.97***
0.1974
ELSAEED CONTRACT AND REAL ESTATE
0.0167***
17.46
0.1262***
7.79
323
60.71***
0.1590
EXTRACTED OILS DERIVATRE
0.0072***
14.15
0.0764***
8.89
322
79.11***
0.1982
GIZA GENERAL CONTRACTING
0.0851***
8.57
0.5351***
3.45
323
11.93***
0.0358
HELIOPOLIS HOUSING
0.0045***
14.00
0.0322***
6.25
323
39.10***
0.1086
MARIDIVE & OIL SERVICES
0.0009***
13.54
0.0064***
4.86
323
23.60***
0.0685
MEDINET NASR HOUSING
0.0081***
4.85
0.0178
0.61
322
0.38
0.0012
MENA TOURISM & RLST.INV.
0.0058***
10.89
0.0508***
6.20
323
38.48***
0.1070
NATIONAL DEV.BANK
0.0019***
15.45
0.0098***
4.85
322
23.51***
0.0684
PALM HILLS DEVS.SAE
0.0083***
24.84
0.0315***
6.83
322
46.71***
0.1274
PIONEERS HOLDING
0.0038***
17.34
0.0173***
5.69
321
32.37***
0.0921
SIDI KERIR PETROCHEM.
0.0004***
11.97
0.0028***
3.19
323
10.19***
0.0308
SIX OF OCT.DEV.& INV.
0.0072***
13.82
0.0187***
2.61
323
6.79***
0.0207
SOUTH VALLEY CEMENT
0.0013***
11.64
0.0098***
5.01
323
25.11***
0.0725
TALAAT MOUSTAFA GROUP
0.0017***
11.76
-0.0040*
-1.67
323
2.80*
0.0086
TELECOM EGYPT
0.0004***
17.79
0.0019***
3.38
323
11.44***
0.0344
UNITED ARAB SHIPPING
0.0131***
17.48
0.0675***
6.66
321
44.42***
0.1222
UNITED HOUSING & DEV.
0.0037***
8.77
0.0297***
3.97
321
15.77***
0.0471
This table reports the Equation 2 (𝑉𝑡 =∝ +𝛽1 𝑅𝑡 + 𝜀𝑡 ) OLS regressions’ results regressing trading volume on stock returns for each of the 34 EGX
firms over the 2011 to 2017 period. The symbols ***, ** and * indicate statistical significance at the 1%, 5% and 10% levels, respectively.
The results of the individual firm level regressions in Table 4 support hypothesis 2 and confirm the strong positive
relationship between price change and volume documented at the pooled portfolio level. Out of the 34 companies, the
relationship between stock returns and trading volume is statistically significant for 31 companies (i.e., more than 90%
of the companies). Out of the 31 significant results, the relationship is significantly positive for 30 companies (i.e., 97%
Published by Sciedu Press
56
ISSN 1927-5986
E-ISSN 1927-5994
Accounting and Finance Research
Vol. 8, No. 3; 2019
of the companies) and only one company has stock returns that are weakly significantly negatively related to trading
volume (at the 10% level). Of the significant results, over 90% (28 out of 31) are significantly positive at the 1% level
while 1 out of 31 is significant at the 5% level and 2 out of 31 (including the one case of a negative relationship) are
significant at the 10% level.
Overall, the hypotheses that stock returns are contemporaneously and asymmetrically positively related to trading
volume (H1 and H2) are confirmed by the results reported in Tables 2 to 4. The strong positive price-volume
relationship suggests that the recent initiatives undertaken by the EGX may have helped to improve the information
flow and efficiency of the market. Specifically, we conjecture that as new information arrives in the Egyptian stock
exchange (as proxied by trading volume), it is instantaneously incorporated into stock prices – suggesting some
improved level of market efficiency. These results are also consistent with prior studies documenting a positive
relationship between returns and trading volume and additionally support two Wall Street adages. Thus, similar to
Girard and Omran’s (2009) conclusion that earlier initiatives undertaken by the EGX helped in improving information
flow, we also conclude that the recent initiatives undertaken by the EGX to improve its structure and information
transparency appear to be positively impacting the information environment as new information (proxied by trading
volume) is contemporaneously impounded into stock prices, leading to the strong positive contemporaneous
price-volume relationship.
4.2 Price-Volume Granger Causality Tests
To further investigate the price-volume relationship, the paper attempts to test hypothesis 3 and hypothesis 4 in order to
ascertain whether there are causal relationships between stock price change and trading volume. As pervasively done
in the literature, we examine the question of causal links between returns and volume by estimating the Equation 3 and
Equation 4 vector autoregressive (VAR) models and then performing Granger causality tests. Since the VAR
regressions require the specification of lags, we leverage Akaika’s (1974) information criteria (AIC) to determine the
ideal number of lags to use in the VAR regressions. We summarize the optimal number of lags suggested by AIC in
Table 5.
Table 5. Best number of Lags for Granger Causality Tests
AIC Recommended Lags
Number of Companies
% of Companies
Cumulative %
0
1
2.9%
2.9%
1
8
23.5%
26.5%
2
5
14.7%
41.2%
3
7
20.6%
61.8%
4
6
17.6%
79.4%
5
1
2.9%
82.4%
6
1
2.9%
85.3%
7
0
0.0%
85.3%
8
5
14.7%
100.0%
We use Akaike’s (1974) information criteria (AIC) to determine the optimal number of lags and report the count statistics for the 34 EGX firms in
Table 5.
From Table 5, AIC recommends lags of 0 to 3 for two-thirds of the sampled firms and lags of 0 to 4 for almost 80% of
the 34 firms. Indeed, for all the firms, AIC recommends lags of no more than 8, suggesting that it may take up to 8
weeks for past technical information on price and volume to be fully reflected in current prices and volume. This
gradual incorporation of lagged values, leading to a slightly longer horizon (of 8 weeks) over which past technical
information on price and volume are incorporated into current stock prices and trading volume, potentially signals
some level of market inefficiency. Thus, since it takes about 2 months for lag values to be fully incorporated into
current stock prices and trading volume, we surmise that the Egyptian stock market is slightly less efficient compared
to stock markets in advanced countries.
Since the AIC information in Table 5 suggests that lags of 0 to 8 are appropriate for all companies, we use 8 lags to run
the VAR regressions and to perform Granger causality tests. Hiemstra and Jones (1994) also note that 8 lags is one of
the most commonly used lags in the literature. We pooled the portfolio of 34 firms and run the VAR regressions and
Granger causality tests on the pooled data, controlling for firm fixed effects and correcting for first order serial
correlation.
Published by Sciedu Press
57
ISSN 1927-5986
E-ISSN 1927-5994
Accounting and Finance Research
Vol. 8, No. 3; 2019
Table 6. Pooled VAR (with Firm Fixed Effects) and Granger Causality Tests
Volume
t
Absolute Stock Returns
t
Volume Lag 1
0.5269***
37.75
0.0192
0.57
Volume Lag 2
-0.0742***
-7.26
0.0018
0.08
Volume Lag 3
-0.0088
-0.88
0.0343
1.34
Volume Lag 4
0.1565***
16.29
-0.0464*
-1.89
Volume Lag 5
0.0295**
2.08
-0.0025
-0.10
Volume Lag 6
0.0096
0.61
0.0220
0.63
Volume Lag 7
0.1607***
10.00
0.0108
0.27
Volume Lag 8
0.0115
0.83
0.0019
0.06
-0.0060
-1.06
0.4647***
33.09
Absolute Stock Returns Lag 2
0.0098*
1.65
-0.1485***
-10.07
Absolute Stock Returns Lag 3
0.0122**
2.12
0.1059***
7.29
Absolute Stock Returns Lag 4
-0.0116**
-2.09
0.0261*
1.87
Absolute Stock Returns Lag 5
0.0051
0.89
-0.0172
-1.23
Absolute Stock Returns Lag 1
Absolute Stock Returns Lag 6
0.0003
0.05
0.0088
0.61
Absolute Stock Returns Lag 7
-0.0088
-1.53
-0.0167
-1.16
Absolute Stock Returns Lag 8
0.0108*
1.90
0.0594***
4.49
0.0013
1.13
0.0150***
5.61
Constant
Firm Fixed Effects
Yes
Yes
N
4,222
4,797
R2
0.6488
0.2465
157.31***
31.70***
2.29**
-
-
0.90
Model F
Absolute Stock Returns Lags Block F
Volume Lags Block F
This Table documents results of pooled VAR regressions with firm fixed effects and Granger causality tests. Equation 3 results are reported in
column 2 where trading volume is regressed on the first 8 lags of volume and the first 8 lags of absolute stock returns. The t statistics for Equation 3
are reported in column 3. Equation 4 results are presented in column 4 where absolute stock return is regressed on the first 8 lags of volume and the
first 8 lags of absolute stock returns. The t statistics for Equation 4 are reported in column 5. We correct the VAR regressions for first order
autocorrelation in the data. The symbols ***, ** and * indicate statistical significance at the 1%, 5% and 10% levels, respectively.
Results of Equation 3 are reported in column 2 of Table 6. The block exogeneity F test rejects the null hypothesis that
the 8 lags of stock returns are statistically indistinguishable from zero. The statistically significant block exogeneity F
tests for the lags of stock returns indicate that past stock returns significantly Granger-cause trading volume at the 5%
conventional level of significance. This supports hypothesis 3. Also, consistent with the sequential information arrival
hypothesis espoused by Copeland (1976), our results imply that trading interests created by changes in prices are not
spontaneously cleared until about two months (i.e., 8 weeks or 8 lags) later. This suggests that in the Egyptian stock
market, some investors are late in the information queue and it could take up to two months (8 weeks) for the
information content of past returns to be impounded in stock trading. It should be noted that this is not out of the
ordinary, especially for emerging/frontier financial markets, since the information architecture of these markets are
still developing.
On the question of whether trading volume Granger-cause stock returns (hypothesis 4), however, we are unable to
reject the null hypothesis since the block exogeneity F statistic is statistically indistinguishable from zero.
Consequently, we conclude that in the Egyptian context, trading volume does not Granger-cause stock returns. Our
results do not support hypothesis 4.
All in all, our Granger causality tests show that in the Egyptian stock market, there is a unidirectional Granger
causality from stock returns to trading volume but not from trading volume to stock returns. Given that the EGX is
an emerging financial market, the unidirectional causality may also suggest that noise traders using prior price
change information as the basis for their trading decisions may be driving up volume, leading to stock returns
Granger causing trading volume. The results of the Granger causality tests of this study are similar to the results of
Published by Sciedu Press
58
ISSN 1927-5986
E-ISSN 1927-5994
Accounting and Finance Research
Vol. 8, No. 3; 2019
Chen (2012) and Sampath and Garg (2018), who find strong evidence of causality from returns to volume but not from
volume to returns.
5. Conclusion
Using data on a portfolio of 34 most active stocks from 2011 to 2017, this paper investigates the price-volume
relationship in the EGX, one of the growing emerging stock markets in Africa. Our findings are, in general, consistent
with prior studies on the price-volume relationship (e.g., Saatcioglu and Starks, 1998; Chen, 2012). Our results
confirm that stock price changes are positively related to trading volume both at the individual firm level and the
portfolio level. As for the nature of the relationship, our results indicate that the price-volume relationship is
asymmetric. These findings support the two oldest Wall Street adages related to price and volume. The strong positive
contemporaneous relationship also suggests that the various initiatives undertaken by the EGX may be having a
positive effect in improving the information dissemination environment of the exchange. Additionally, when we
investigate causal relationships, our results support only a unidirectional relationship that price change Granger causes
trading volume (with lags extending up to 8 weeks) but not the other way around. This finding leads us to conclude that
in the EGX, the information is sequentially distributed, thus impinging on the ability of investors at the end of the
information queue to react rapidly. This delay in information dissemination and the absence of volume Granger
causing price could be a source of some inefficiency in the EGX.
Overall, our findings are consistent with prior studies on the price-volume relation in other jurisdictions. Given the
continuing development of African financial markets and their potential attractiveness to global investors from a
portfolio diversification perspective, we believe that our study is beneficial to not only the academic world but to
practitioners, including investors who might be interested in implementing investment strategies like momentum in the
EGX. Since momentum and other investment strategies’ performance may be influenced by the information
environment and microstructure of the EGX, the empirical results we present in this study may be beneficial to
investors. A potential limitation of our study relates to the use of weekly data. Although the use of weekly data is the
predominant approach in the literature, Karpoff (1987) raised the possibility that the price-volume relationship could
be affected by the data measurement frequency. Consequently, our results could be driven by the use of weekly data.
We therefore suggest that future research analyze the price-volume relationship in the EGX using other data
frequencies such as monthly data, quarterly data or annual data.
References
Abdelzaher, M.A. (2019). The impact of January events on stock performance in the Egyptian stock market.
Accounting and Finance Research, 8(1), 174–182. />Akaike, H. (1974). A new look at the statistical model identification. IEEE Transactions on Automatic Control, 19,
716–723. />Assogbavi, T., Khoury, N., & Yourougou, P. (1995). Short interest and the asymmetry of the price-volume relationship
in the Canadian Stock market. Journal of Banking and Finance, 19, 1341–1358.
/>Başci, E., Özyildirim, S., & Aydoǧan, K. (1996). A note on price-volume dynamics in an emerging stock market.
Journal of Banking and Finance, 20(2), 389–400. />Blume, L., Easley, D., & O'Hara, M. (1994). Market statistics and technical analysis: The role of volume. Journal
Finance, 49(1), 153–181. />Brailsford, T.J. (1996). The empirical relationship between trading volume, returns and volatility. Accounting and
Finance, 36(1), 89–111. />Chen, S.-S. (2012). Revisiting the empirical linkages between stock returns and trading volume. Journal of Banking
and Finance, 36, 1781–1788. />Cook, S., & Watson, D. (2017). Revisiting the returns-volume relationship: time variation, alternative measures and
the financial crisis. Physica A, 470, 228–235. />Copeland, T. (1976). A model of asset trading under the assumption of sequential information arrival. Journal of
Finance, 31, 135–155. />El Alaoui, M., Bouri, E., & Roubaud, D. (2018). Bitcoin price-volume: a multifractal cross-correlation approach.
Finance Research Letters, in press. />Epps, T.W., & Epps, M.L. (1976). The stochastic dependence of security price changes and transaction volume
Published by Sciedu Press
59
ISSN 1927-5986
E-ISSN 1927-5994
implications for the mixture
/>
Accounting and Finance Research
of
distributions
hypothesis.
Vol. 8, No. 3; 2019
Econometrica,
44(2),
305–321.
Girard, E., & Omran, M. (2009). On the relationship between trading volume and stock price volatility in CASE.
International Journal of Managerial Finance, 5(1), 110–134. />Gold, M., Levere, J., & Smith, G. (2013). Tax-loss selling and the year-end behavior of Dow Jones stocks. Accounting
and Finance Research, 2(1), 40–46. />Gupta, S., Das, D., Hasim, H., & Tiwari, A.K. (2018). The dynamic relationship between stock returns and trading
volume revisited: A MODWT-VAR approach. Finance Research Letters, 27, 91–98.
/>Hearn, B., Piesse, J., & Strange, R. (2010). Market liquidity and stock size premia in emerging financial markets: The
implications
for
foreign
investment.
International
Business
Review,
19(5),
489–501.
/>Hiemstra, C., & Jones, J.D. (1994). Testing for linear and nonlinear Granger causality in the stock price-volume
relation. Journal of Finance, 49(5), 1639–1664. />Hsu, H., Wu, T.-C., Wu, G. S., & Chang, Y.-H. (2016). Heterogeneity of trading information and the price-volume
relationship: Theory and evidence. Accounting and Finance Research, 5(1), 232–246.
/>Jennings, R., Starks, L., & Fellingham, J. (1981). An equilibrium model of asset trading with sequential information
arrival. Journal of Finance, 36, 143–161. />Kao, Y.-S., Chuang, H.-L., & Ku, Y.C. (2019). The empirical linkages among market returns, return volatility, and
trading volume: evidence from the S&P 500 VIX futures. North American Journal of Economics and Finance, in
press. />Karpoff, J.M. (1987). The relation between price changes and trading volume: A survey. Journal of Financial and
Quantitative Analysis, 22, 109–126. />Karpoff, J.M. (1988). Costly short sales and the correlation of returns with volume. Journal of Financial Research,
51(3), 173–188. />Kumar, S. (2017). Revisiting the price-volume relationship: A cross-currency evidence. International Journal of
Managerial Finance, 13(1), 91–104. />Lee, C. F., & Rue, M. O. (2002). The dynamic relationship between stock return and trading volume: Domestic and
cross-country
evidence.
Journal
of
Banking
and
Finance,
26,
51–78.
/>Leke, A., Chironga, M., & Desvaux, G. (2018). Africa's business revolution: How to succeed in the world's next big
growth market. Boston, MA: Harvard Business Review Press.
Leke A., & Yeboah-Amankwah, S. (2018). Africa: A crucible for creativity. Harvard Business Review,
November–December, 116–126.
Li, H., Zhong, W., & Park, S.Y. (2016). Generalized cross-spectral test for nonlinear granger causality with
applications to money-output and price-volume relations. Economic Modelling, 52, 661–671.
/>Omran, M.F. (2007). An analysis of the capital asset pricing model in the Egyptian stock market. Quarterly Review of
Economics and Finance 46(5), 801–812. />Saatcioglu, K., & Starks, L.T. (1998). The stock price-volume relationship in emerging stock markets: The case of
Latin
America.
International
Journal
of
Forecasting,
14(2),
215–225.
/>Sampath, A., & Garg, P. (2018). Contemporaneous and causal relationship between returns and volumes: Evidence
from nifty futures. International Review of Finance, 1–12. />Tsai, I.C. (2019). Dynamic price-volume causality in the American housing market: a signal of market conditions.
North American Journal of Economics and Finance, 48, 385–400. />Wang, Z., Qian, Y., & Wang, S. (2018). Dynamic trading volume and stock return relation: Does it hold out of sample?
International Review of Financial Analysis, 58, 195–210. />Published by Sciedu Press
60
ISSN 1927-5986
E-ISSN 1927-5994