Dissertation summary: Study on correlation of autoantibody tsh receptor and some biological parameters to the result of treatment graves disease by methimazole in children
Bạn đang xem bản rút gọn của tài liệu. Xem và tải ngay bản đầy đủ của tài liệu tại đây (543 KB, 29 trang )
MINISTERY OF EDUCATION AND TRAINING MINISTERY OF HEATH
HA NOI MEDICAL UNIVERSITY
**********
HUNG NGUYEN MINH
STUDY ON CORRELATION OF
AUTOANTIBODY TSH RECEPTOR AND
SOME BIOLOGICAL PARAMETERS TO THE
RESULT OF TREATMENT GRAVES DISEASE BY
METHIMAZOLE IN CHILDREN
Departement: Pediatric
Code: 62.72.01.35
Abstract thesis of Doctor of Philosophy
HA NOI – 2015
The work was completed at:
Hanoi Medical University
Scientific instructor:
1. Associate Professor PhD. Dat Nguyen Phu
2. PhD. Uoc Hoang Kim
Objection 1:
Objection 2:
Objection 3:
The dissertation will be defended at the Council meeting spot at
the school level thesis
Hanoi Medical University.
In return: hour day on month 2015
The thesis can be found at:
National Library
Library Hanoi Medical University
Library Central Medical Information
INTRODUCTION
Hyperthyroidism in children mostly Graves' disease,
which is an autoimmune disease, caused by TSH receptor
autoantibodies (TRAb) stimulates thyroid cells increase the
synthesis and release of thyroid hormones in the blood, causing
symptoms thyrotoxicosis does.
Through the effects of TRAb on thyroid cells and some
other organizations, autoantibodies TRAb decided the synthesis
and release of thyroid hormones in the blood, causing an
autoimmune manifestations clinically characterized as ocular
signs, consistent posting... affect the severity, the disease
lightly. TRAb increase in 95100% Graves' disease patients at
the time of diagnosis.
Children growing body both physically and mentally,
they are suffer from Graves’ disease, suffer growth disorders
and psychiatric díorders affect the health and learning of
children, however they are good response to internal treatment,
so it is preferred to use internal medical therapy with anti
thyroid drugs. Internal treatment is less likely to cause
prolonged hypothyroidism so should be little impact on the
development of physical and intellectual young. United State
Food and Drug Administration recommends using methimazole
therapy for children who have indication with internal
treatment, not use Propilthiouracil (PTU) for the initial
treatment of children because: Methimazole effects 10 folds
more potent than PTU, prolonged halflife, just use once time
per day, improve patient compliance. Methimazole has fewer
side effects and quickly take the children euthyroid state than
PTU.
Antithyroid drugs have immunosuppressive effect,
inhibiting autoantibody production TRAb but not completely
inhibit the production of autoantibodies TRAb, so the relapse
rate after treatment discontinuation is quite high 5060 %.
Some other biological parameters such as age disease,
thyroid volume, disease severity, autoimmune manifestations,
treatment compliance of patient... also affect the result of
treatment and relapse rate in children.
Worldwide, many studies in various aspects of Graves's
disease as well as the role of TRAb and biological parameters
to treatment result and relapse were conducted. In Vietnam, in
the field of Pediatrics have no studies on the association
between autoantibodies TRAb and some biological parameters
to treatmen result and relapse in children who get internal
treatment. So we studied the subject with the following aims:
1.Describe the clinical and subclinical characteristics in
patients with Graves’ disease.
2. Evaluation of Graves' disease treatment in children by anti
thyroid drug methimazole group synthesis.
3. Survey and evaluate change TRAb levels and some clinical
parameters, subclinical concerning treatment outcome and
recurrence in children with Graves’ disease.
NEW CONTRIBUTION OF THE STUDY
The study described the clinical characteristics,
subclinical and TRAb concentrations in children with
Graves's disease, duration of treatment necessary to attack
the child in euthyroid and recurrence rate after 1 year
follow up.
The study identified an association between
concentrations of TRAb at the time of diagnosis with
relapse. Especially TRAb levels at the end of therapy with
recurrence.
Identify some biological parameters such as age at
diagnosis, thyroid volume, concentration... T3 at diagnosis
related to treatment outcome and recurrence in children
with Graves..
STRUCTURE OF THE THESIS
The thesis including 99 pages (not including appendices
and references) consists of 6 parts: Introduction 3 pages,
overview 30 pages, object and method of the study 14 pages,
results of study 24 pages, discussions 25 pages, conclusions
3 pages) and recommendations 1 page. the thesis has eight
appendices, 33 tables, 8 charts and 82 references, of which
10 Vietnamese references and 72 English references.
Chapter 1. OVERVIEW
1.1. Definitions, nomenclature, epidemiology
Definition: Graves’s disease is an autoimmune disease
caused by autoantibodies stimulate the thyroid follicular cells
increases the synthesis and release of thyroid hormones in the
blood causes thyrotoxicosis manifest clinically.
Nomenclature: The Englishspeaking countries known
as Graves' disease, while in other countries in Europe known as
Graves's disease, Vietnam called "Graves’s disease".
Epidemiology: The disease is rare in children under
5 year old, the prevalance of the Graves’s disease increases
with age, women are more likely to meet than man.
1.2. Pathogenesis
1.2.1. Immune theory
Due to appear selfantigens HLADR group 2 on the
thyroid cell membrane, stimulating the production of
autoantibodies TRAb, TRAb attached TSH receptor on the
thyroid cell membrane stimulating thyroid cells similar as TSH
enhances synthesis and release of thyroid hormones in the
blood causes thyrotoxicosis expression and manifestations of
autoimmune.
Mediated immune cells:
Characterized reducing the number and function of Ts
cells in the thyroid gland, making specific Th cells are released
to stimulate mononuclear cells increased IFNγ synthesis.
IFNγ stimulates thyroid cells do express HLA group 2 on their
membranes. Th cells also stimulate lymphocytes B increases
TRAb autoantibody production.
1.2.2. The pathogenesis of the disease ophtalmia Graves
Graves disease eye illness common in the pathogenesis
of Graves’ disease, independent of the appearance of clinical
symptoms. It uses staging NO SPECS2 to assess the degree of
eye damage in Graves’ disease.
1.2.3. Other factors
Genetic factor: If one identical twins suffer from
Gravess’ disease, the other increased risk of 20% 30% to
suffer from Graves's disease.
Stress: play an important role in the onset and
maintenance of the diseases.
Age: The prevalence of Grave’ disease increases with
age, the highest in the age of prepuberty and puberty.
Gender: the prevalence of Grave’ disease in girls are
higher than boys.
Iodine and drugs containing iodine: may promote or
cause relapse in susceptible individuals.
1.3. Clinical, paraclinical and diagnosis
1.3.1. Clinical
Clinical symptoms have some differences compared to
adults: growth disorders, mood changes, or kissing, of eye
manifestations are less frequent and usually mild, consistent
posting before tibia or to the extremities very rare, rare
cardiovascular complications, respond well to medical therapy.
Medical treatment is less likely to cause prolonged
hypothyroidism, so most of the Pediatric Endocrinology have
priority use of medical treatment for children with Graves.
1.3.2. Paraclinical
Hormone: TSH decrease, T3, FT4 increase.
Autoantibody examination: TRAb increase.
Ultrasound: thyroid gland, irregular hypoechoic
Thyroid ultrasound doppler: angiogenesis, increase
the flow velocity, increasing resistance index.
. ECG: tachycardia, atrial fibrilation, arrhythmia and
or bundle block...
Others test: CBC, transaminase (GOT, GPT), glucose
fasting, electrolyte...
1.3.4. Diagnosis
Based on clinical, laboratory valuable decision:
Serum concentration ò TSH decrease < 0,1 µUI/mL,
FT4 increase > 25 pmol/L and/or T3 increase > 3 nmol/L
Serum concentration of TRAb increase.
1.3.5. Treament
1.3.5.1. Advantages and disadvantages of the method of
treatments
Internal treatment with Antithyroid drug: It is the first
choice in children, rarely causes persistent hypothyroidism
Disadvantages: prolong duration of therapy, high
relapse rate as high as 50 60%, may be the unwanted effects
caused by medications.
Radioiodine therapy: It is the second choice in children more
than 10 years old, good control hyperthyroidism, safe, avoiding
the risk of heart complications.
Disadvantages: high rate of persistent hypothyroidism.
Near total thyroidectomy: Rapid control of hyperthyroidism,
suitable for younger children, there is no internal treatment
conditions.
Disadvantages: risk of persistent hypothyroidism, or
relapse, surgical complications
1.3.5.2. Antithyroid drug therapy in children
Mechanism of action: medicine KGTH actively
transported into the thyroid gland, where thay inhibit TPO
enzyme so inhibit all stages in the synthesis of thyroid
hormones.
Treatment duration:
Prolonged treatment increased the odds of remission,
Many studies recommended prolonged treatment to improve
remission rate and decrease the risk of relapse.
Remission rate and relapse:
Permanent remission by internal therapy is high rate
(90 100%) at the end of treatment. The percentage of children
still euthyroid after 1 year changes 25 65 %.
1.4. TRAb and biological parameters with treatment result
1.4.1. TRAb and its changes during treatment
Antithyroid drug reduces self disclosure group 2 HLA
antigens, inhibits the immune system and reduce autoantibodiy
production TRAb, therefore TRAb concentration will decline
after treatment with antithyroid drugs. TRAb are the most
important biological factors in predicting relapse Graves's
disease. High TRAb concentration at the time of diagnosis or
even increased at the end of treatment, the children increased
the risk of relapse after stopping medication.
1.4.2. Some other biological parameters with treatment result
1.4.2.1. Concentrations of T3, T4 and ratio T3/T4
TRAb stimulate increased synthesis and release T3, T4
into the blood stream, making the ratio of T3 / T4 increases
(> 20). The ratio T3/T4 increased similarities with increased
levels TRAb and increased risk of recurrence.
1.4.2.2. Ophthalmopathy with treatment result.
Children with severe ophthalmopathy have high TRAb
concentration and high risk of relapse after internal therapy.
1.4.2.3. Cardiac manifestations with treatment result
The degree of clinical manifestations of
cardiovascular homologous with hormone levels and TRAb
levels. Children with severe cardiovascular manifestations
often have high levels of TRAb and increased risk of
recurrence.
1.4.2.4. Goiter with treatment result
TRAb stimulates thyroid cell proliferation cause goiter.
children have large goiter with high TRAb concentration and
increased risk of relapse.
1.5. Several studies in our country on the relationship between
TRAb and treatment results Graves’ disease
Bui Thanh Huyen study in 2002 about the change of
TRAb concentrations in adult patients with Graves before and
after treatment I131 concluded: TRAb levels were significantly
reduced in euthyroid group or sill hyperthyroidism after
treatment with I131.
Research by Phan Huy Anh Vu 2008 TRAb quantitative
value in the diagnosis and monitoring of recurrence after
medical therapy in adult patients with Graves's disease
conclusions: at the time of diagnosis of high average levels of
TRAb ( 36,4 ± 65,9 U/L). TRAb concentrations ≥ 4,05 U / L at
the end of treatment with recurrence predictive value was
78,8% sensitivity and 79,8% specificity.
Ngo Thi Phuong' research in 2008 at the Military
Medical Academy in concentration TRAb, TPOAb, TGAb in
adult patients with Graves's disease medical treatment with
PTU concluded: TRAb concentrations in patients with
pathologies eye Higher patients without eye pathology. TRAb
concentrations increased in parallel with the thyroid volume
and decreased markedly at the end of treatment.
Chapter 2. SUBJECTS AND METHODS
2.1. Subjects
2.1.1. Subject and location of study: all patients were diagnosed
identify Graves’s disease between ages 18 and under to
examination and treatment in National Hospital of
Endocrinology, has appointed internal treatment.
2.1.2. Study duration: January 01st, 2010 to June 01st, 2014
2.1.3. Selection criteria: The patient was diagnosed with
Graves's disease have specified medical treatment:
There are clinical signs of thyrotoxicosis
Tests valuable diagnostic decision: TSH decreased
< 0,1 μUI/mL, FT4 increased > 25 pmol/L and/or T3
increases > 3 nmol / L, autoantibodies TRAb increased.
2.1.4. Exclusion criteria:
Graves severe, cardiac complications, thyrotoxicosis
not by Graves, pathology combined as liver failure, with
other chronic diseases...
2.2. Methods: using the methodology of clinical trials are
not controlled. Sample size calculation formula is as
followed:
n
2
z1 α/2λ0 z1 β λa / λ0 λa
2
n = 108. To avoid loss of sample, sample size increased
about 50%. The total sample size for this study is 158.
2.3. The variables studies
2.3.1. Variables evaluated clinical characteristics,
paraclinical
Age, sex, time from onset of first symptoms until
diagnosis.
Reason for visit, the clinical signs.
The paraclinical signs
2.3.2. Variables evaluates treatment results
Duration of attack treatment, duration of treatment
with Methimazole, the dose attack treatment
Consolidate dose before stopping drugs, side effects of
Methimazole
Relapse rate in 12 months follow up
2.3.3. Variables on the relationship between TRAb and some
biological parameters with treatment outcomes.
TRAb concentration at diagnosis and at stopping drugs
Age at diagnosis, gender.
The duration of treatment
Goiter (Grade, volume, nature)
Ocular manifestations, cardiac manifestations.
Serum T3, FT4 concentrations
Process monitoring during treatment:
Depending on the stage of treatment: children up
appointments periodic clinical, laboratory T3, FT4, TSH and
other necessary tests to assess disease progression.
Early detection of unwanted effect of methimazole:
immediately notify your doctor if these effects appear
undesirable.
2.4. Assess treatment outcomes and related factors
+ The percentage of children with Graves’ disease
stabilization when stop the medications, both clinical and
laboratory.
+ The rate of relapse during followup
+ The relationship between TRAb and some biological
index with treatment outcomes
2.5. Data processing
The data is processed by the algorithm's basic statistical
software SPSS 19.0. Reviewed by univariate analysis
algorithms, multivariate regression analysis.
Chapter 3. RESULTS
3.1. Features of clinical and subclinical study subjects
162 children are diagnosed with Graves's disease were
treated and relapse monitoring at the National Hospital of
Endocrinology. Their characteristics of age, sex are shown as
followed
Sơ đồ 2.1. Sơ đồ nghiên cứu
Tiếp tục điều trị
Table 3.1. Age and gender of the subjects studies
Age group
(year)
Gender
Male
Female
n
%
n
%
0
0
1
0,6
2
1,3
15
9,4
10
5,6
49
30,0
< 5 years old
5-9 years old
10- 14 years
old
15-18
years 13
8,1
72
45,0
old
Total
25
15,0
137
85,0
Average
16,3 ± 4,1
Table 3.2. The frequency of functional symptoms
Functional expression
Tired
Susoense
Trembling hands
More sweat
Eat more
Weight loss
Drink lots
Sleeping less
Menstrual disorders
n
(162)
151
159
141
114
117
114
103
80
52
Payoffs
(%)
0,6
10,7
35,6
53,1
100
Proportio
n
(%)
94,4
94,4
87,6
71,3
73,1
71,3
64,8
50,6
33,1
Table 3.3. The volume of thyroid ultrasonography in
the study subjects compared with normal thyroid
volume under Gutertkunst
Age
(year)
normal thyroid
n
volume for age (161
(cm3)
)
6
7
8
9
10
11
12
13
14
15
16
17
3,5
4
4,5
5
6
7
8
9
10,5
12
14
16
1
2
6
8
12
11
4
6
26
12
11
62
The volume of
thyroid median
age in the study
subjects (cm3)
12,5
12,3
13,4
19,6
21,3
25,1
20,6
22
22
22
22
22
p
< 0,05
< 0,05
< 0,05
<0,05
< 0,01
< 0,01
< 0,01
< 0,01
< 0,01
< 0,05
< 0,05
< 0,05
Table 3.4. Thyroid hormone levels and TRAb at
diagnosis
Index
TSH
(µUI/L)
FT4
Norm
al
0,35-5
9-24
Results
n
minimu
m value
maximu
m value
Average
16
2
16
- (*)
- (*)
- (*)
27,4
143,2
69,3 ±
(pmol/L)
T3
(nmol/L)
TRAb
(U/L)
1-3
< 1,58
2
16
2
16
2
3,2
91,0
1,30
40,0
27,5
7,9 ±
7,2
28,9
±11,2
3.2. Results of Methimazole treatment
Table 3.5. Treatment time attack
Time (week)
4-6
7 - 12
Total
Average
n
157
5
162
Proportion %
96,9
3,1
100
6,4 ± 1,1 weels
Table 3.6. Methimazole dose treatment phase attack
Methimazole
n
Min
dose (mg/kg/day)
< 9 year
18
0,33
10 14 year
57
0,32
15 18 year
85
0,22
Total
162
0,22
Table 3.7. Side effects of methimazole
Max
Mean
1,32
0,96
0,87
1,32
0,86 ± 0,25
0,58 ± 0,16
0,60 ± 0,14
0,64 ± 0,20
Side effects
n
Percentage (%)
Yes
11
6,8
No
151
93,2
Total
162
100
Table 3.8. Duration treatment with Methimazole
Time of treament (month)
n
Percentage
(%)
< 18 months
18 30 months
> 30 months
Total
Mean duration treatment
Duration treatment shortest
Duration treatment longest
15
9,3
93
57,4
54
33,3
162
100
27,57 ± 8,78 (month)
17 (month)
42 (month)
Table 3.9. Methimazole dose befere before cessation drugs
Methimazole
n
Min
Max
Mean
dose (mg/day)
< 9 year
18
2,5
5,0
3,67 ± 1,89
10 14 year
57
2,5
5,0
3,34 ± 1,43
15 18 year
85
2,5
5,0
3,91 ± 1,23
Total
162
2,5
5,0
3,69 ± 1,62
P > 0,05
Table 3.10. Relapse rate
Time
Relapse
n
%
< 3 months
18
162
11,1
3 6 months
30
144
20,8
7 9 months
22
114
19,3
10 12 months
21
92
22,8
Total
91
162
56,2
3.3. Relationship between TRAb concentration and some
biological parameters with treatment result
Table 3.11. The change of TRAb concentrations before and
after treatment
Time
Mean serum
Diference
p
Diagnosis
TRAb (U/L)
28,9 ± 11,2
(U/L)
20
< 0,05
End of treament
8,9 ± 6,9
Table 3.12. TRAb concentrations at diagnosis with relapse
Relapse
Yes
No
Mean serum
TRAb (U/L)
32,2 ± 9,9
24,8 ± 11,3
p
< 0,05
Table 3.13. TRAb concenstrations at cessation of treatmnet
with relapse
Relapse
Mean serum
p
TRAb (U/L)
Yes
10,8 ± 7,6
< 0,05
No
6,6 ± 5,3
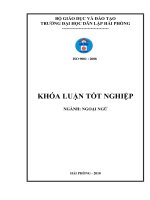
69,1%
Figure 3.1. ROC (Reciver Operating Characteristic)TRAb
concentration at diagnosis with relapse
Table 3.14. ROC TRAb at diagnosis with relapse
Serum
TRAb
At
diagnosis
AUC
(%)
69,1
Cut
off
31,8
39,8
Se
(%)
62,6
46,2
Sp
(%)
65,5
82,0
PPV
p
63,9
< 0,001
68,5
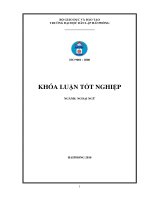
Figure 3.2. ROC TRAb concentration at cessation of
treatment with relapse
Table 3.15. ROC TRAb at cessation of treatment with relapse
Serum
AUC Cut
Se
Sp
PPV
p
TRAb
(%)
off
(%)
(%)
Cessation of
5,19
72,5
59,2
68,5
63,7 < 0,001
10,7
38,5
90,0
treatment
Table 3.16. Relationship between TRAb concentration at
diagnosis according to the ROC curve cut off point with
relapse
Serum TRAb
Relapse
(U/L)
Yes
No
n
Percentage
n
Percentage
(%)
(%)
≥ 39,8
42
76,4
13
23,6
< 39,8
Total
49
45,8
58
91
56,2
71
ỎR = 2,29 (1,38 3,80); p < 0,01
54,2
43,8
Table 3.17. Relationship between TRAb concentration at
cessation of treatment according to the ROC curve cut off point
with relapse
Serum TRAb
Relapse
(U/L)
Yes
No
n
Percentage
n
Percentage
(%)
(%)
≥ 10,7
35
81,4
8
18,6
< 10,7
56
47,1
63
52,9
Total
91
56,2
71
43,8
ỎR = 2,85 (1,49 5,43); p < 0,01
Table 3.18. Age group at diagnosis with relapse
Age (year)
Relapse
Yes
No
n
Percentage
n
Percentage
(%)
(%)
< 12
27
73,0
10
27,0
≥ 12
64
51,2
61
48,8
Total
91
56,2
71
43,8
OR = 2,57 (1,15 – 5,76); p < 0,05
Table 3.19. Relationship between duration treatment with
relapse
Treatment duration
Relapse
Yes
No
n
(91)
Percentage n
(%)
(71
)
< 18 months (n = 15)
10
66,7
5
18 30 months (n = 93) 54
58,1
39
> 30 months (n = 54)
27
50
27
χ 2 = 1,64 , p < 0,05
Percentage
(%)
33,3
41,9
50
Table 3.20. Grade of goiter at diagnosis with relapse
Grade of
goiter
Relapse
Yes
No
n
Pecentage (%)
n
Pecentage (%)
Grade 2
53
65,4
28
34,6
Grade 1
38
46,9
43
53,1
Total
91
56,2
71
43,8
OR = 1,54 (1,07 – 2,20); p < 0,05
Table 3.21. Thyroid volume at diagnosis with relapse
Thyroid patient
Relapse
volumes compared
Yes
Pecentage n
with normal thyroid n
(%)
volume for age
≥ 2,5 folds
66
77,6
19
< 2,5 folds
25
32,5
52
Total
91
56,2
71
OR = 7,22 (3,59 – 14,53); p < 0,01
No
Pecentage
(%)
22,4
67,5
43,8
Table 3.22. High T3 concentration at diagnosis with relalpse
Serum T3
(nmol/L)
> 9
≤ 9
Total
Relapse
Yes
No
n
Pecentage
n
Pecentage
(%)
(%)
47
62,7
28
37,3
44
50,5
43
49,5
91
56,2
71
43,8
OR = 1,32 (0,92 – 1,90); p < 0,05
Table 3.23. T3 concentration at the cessation of treatment with
relapse
Relapse
Mean serum T3
p
(nmol/L)
Yes
2,51 ± 2,31
< 0,05
No
2,42 ± 2,90
Table 324. TRAb concentration at diagnosis and some
biological parameters with relapse
Variant
p
Partial Eta
Squared
General model
> 0,05
0,094
Serum TRAb at diagnosis
< 0,05
0,045
Age < 12 and ≥ 12
> 0,05
0,011
Time of treament
> 0,05
0,017
Volume of thyroid
> 0,05
0,005
Note: Partial Eta Squared coefficient partial Eta squared (Level
sunshine of variables in the model)
Table 3.21. TRAb concentration at end of treatment and some
parameters with relapse
Variant
p
Partial Eta
Squared
General model
< 0,05
0,176
Serum TRAb at
end of treament
< 0,05
0,097
Time of treament
> 0,05
0,009
Chapter 4. DISCUSSION
4.1. Clinical and subclinical characteristics
The study was conducted on 162 children with Graves's
disease treatment monitoring in National Hospital of
Endrocinology from 2010 to 2014 compliance since diagnosis
were follow up until a stable treatment and cessation drug,
continue to follow up and evaluate relapse.
Infected age: Incidence increases with age, the
highest in the age group 1518 years old accounted for
53,1%, and women suffer more than men, the proportion of
male/female 1/5,75.
Most children has signs Graves’ disease increases
metabolism, stimulate the sympathetic nervous, mood changes,
100% have goitre mainly of 1b and grade 2, 97,5% had diffuse
goiter and 2,5% there's goiter. Most cases hae fast circuit with
age.
The concentration of T3, FT4, TSH and TRAb at the
time of diagnosis: findings at the time of diagnosis of TSH
concentration levels are not quantifiable levels (<0.03 IU / L),
medium FT4 levels average in the study subjects at the time of
diagnosis was 69,3 pmol / L, the average concentration of T3 in
the study subjects at the time of diagnosis was 7,9 nmol /L, the
concentration of average TRAb at the time of diagnosis was
28,9 IU /L (threshold value of 1,58 U / L), reflecting the body
in the state of intoxication under the action of TRAb.
4.2. The result of methimazole treatment
Grave’ disease medical treatment divided in 3 periods:
attack, maintain, consolidate, then cessation of treatment.
Methimazole dose attack period: Methimazole dose
attack period: no different by age, the average daily dose of
Methimazole was 0,64 mg/kg/day.
Treatment time attack: average of 6,4 weeks, 96,9 % of
patients with treatment duration about 4 6 weeks and 3,1 % of
patients with treatment attack duration about 7 12 weeks.
The side effects of methimazole: few and mild, the most
common side effects included rash, nausea, hair loss... which
were seen in 11/162 (6,8 %). No cases of severe side effects
such as hepatotoxicity, liver failure, agranulocytosis...
Duration of treatment: prolonged medical therapy
reduced the risk of relapse after cessation of therapy with
statistical significance at p < 0,05. Time children followed
medical treatment average of 27,5 months, of which 9,3% of
subjects treated < 18 months, 57,4 % of patients from 18 30
months of treatment and 33,3 % of patients treated > 30
months. Treatment duration was 17 months shortest and longest
was 42 months.
There are many factors related to treatment result and
relapse as the severity of the disease, autoimmune
manifestations, grade of goiter, treatment duration, the
compliance of the patients and their family... moreover,
antithyroid do not completely inhibit the autoimmune etiology
so the relapse rate after medical treatment is high. The study
results following 1 year after cessation drug showed relapse
rate increases with time, after 1 year has 56,2 % of patients
relapse.
4.3. Relationship between TRAb concentration and biological
parameters with treatment result and relapse.
The change in TRAb concentration before and after
treatment: results of study showed that TRAb concentration
before treatment was 28,9 U/L fell sharply at the cessation of
treatment was 8,9 IU/L differences were statistically significant
(p < 0,05).
TRAb concentration before treatment may predict
relapse: TRAb concentration at diagnosis in relapse group
(32,2 U/L) was higher than the nonrelapse group (24,8 U/L),
in time following (p < 0,05).
TRAb concentration at cessation treatment may predict
relapse: relapse patients group TRAb concentrations at the
higher cessation treatment, respectively 10,8U/L compared
with 6,5 U/L in patients group not relapse, (p < 0,05).
ROC curve value TRAb concentration at diagnosis has
prognostic significance recurrence: for ROC curve cut off
point was 39,8 U/L, the predictive value was 63,9 % relapse
with a sensitivity of 46,2 % and specificity was 82 %.
ROC curve value TRAb concentration at cessation
treatment with prognostic value of relapse: the cut off point
was 10,7 U/L, the predictive value was 63,7 % recurrence with
a sensitivity of 38,5 % and specificity was 90 %.
Infected age predictors of relapse: the infected children
aged smaller the risk of higher relapse after stopping
medication. The relapse rate in children < 12 years of age is
much higher than the group aged 12 and older (73 %
respectively and 51,2 %). Children < 12 years of age increases
the risk of relapse compared with 2,57 times higher for children
12 and older.
Prolonged treatment time increases the remission rate:
relapse rates in treatment groups < 18 months was 66,7 %,
58,1 % fell in the group with treatment duration of 1830
months and continued to decline 50 % in the group with
treatment duration of 30 months.
Large goiter increased risk of relapse: 65,4 % of
children grade goiter 2 relapse compared with 46,9 % of the
children grade goiter 1 relapse. The relapse rate in those with
thyroid volume at diagnosis big ≥ 2,5 times the normal thyroid
volume for age is much higher than the group with thyroid
volume big but < 2,5 times normal thyroid volume for age
(77,6 % respectively and 32,5 %).
T3 concentrations high at diagnosis increases the risk
of relapse: T3 concentrations at diagnosis on relapse group
> 9 nmol/L higher than the concentrations of T3 group
at diagnosis ≤ 9 nmol/L, respectively, 62,7 % and 50,5 %.
Multivariate analysis model TRAb concentration at
diagnosis: TRAb concentration at diagnosis in the group
≥ 39,8 U/L have a high risk of relapse with (p < 0,05).
Multivariate analysis model: TRAb concentration at
the end of treatment was associated with increased
recurrence of statistically significant at p <0,05.
CONCLUSIONS
1. The clinical, subclinical characteristics
The disease is rare in children under 5 traveling,
incidence increases with age, the highest in the age group of