Part 1 Modern labor economics - Theory and public policy (11th edition): Part 2
Bạn đang xem bản rút gọn của tài liệu. Xem và tải ngay bản đầy đủ của tài liệu tại đây (5.77 MB, 337 trang )
CHAPTER 10
Worker Mobility: Migration,
Immigration, and Turnover
W
hile the flow of workers across national borders is not a new
phenomenon—after all, it was responsible for the settlement of
Australia, Canada, and the United States—immigration over
the last two or three decades has significantly raised the share of the
foreign-born in Europe and North America. For example, the share of the
foreign-born in the European population rose from 6.9 percent in 1990
to 9.5 percent in 2010; in Canada, the share of the foreign-born rose from
16.2 percent to 21.3 percent over this period, while in the United States it
rose from 9.1 percent to 13.5 percent.1 The dramatic increase in the pres-
ence of immigrants, who frequently speak a different language and are
often from poorer countries, has stimulated some angry calls for stricter
limits or tighter “border-security” measures—particularly in the United
States, which shares a long border with a much poorer country (Mexico)
and attracts many workers who have not been able to secure an official
immigration visa. Proposals to impose stricter limits on immigration,
including those to expel immigrants without work visas, are frequently
justified with arguments that immigrants lower the wages of natives or
otherwise impose a financial burden on the “host” country.
In this chapter, we will use economic theory to analyze the decision to
emigrate and the labor-market effects of immigration. In the process, we will
1
United Nations, “International Migrant Stock: The 2008 Revision Population Database:
Country Profile,” at />
323
324
Chapter 10
Worker Mobility: Migration, Immigration, and Turnover
examine how immigrants are likely to differ from others in personal characteristics (age and future-orientation), and what factors influence whether immigration
raises the per-capita real income of the native-born in the host country. We begin
the chapter, however, with an analysis of the causes and consequences of worker
mobility—the larger category of which immigration is an important subset.
Worker mobility plays a critical role in market economies. Because the purpose of
any market is to promote voluntary exchange, society relies on the free movement
of workers among employers to allocate labor in a way that achieves maximum
satisfaction for both workers and consumers. The flow (either actual or threatened) of workers from lower-paying to higher-paying jobs, for example, is what
forces firms that are paying below-equilibrium wages to increase their wage
offers. The existence of compensating wage differentials, to take another example,
also depends on the ability of informed workers to exercise choice among
employment opportunities in the search for enhanced utility.
Mobility, however, is costly. Workers must take time to seek out information on other jobs, and for at least some workers, job search is most efficient if
they quit their current job first (to look for work in a new geographic area, for
example). Severing ties with the current employer means leaving friends and
familiar surroundings, and it may mean giving up valuable employee benefits
or the inside track on future promotions. Once a new job is found, workers may
well face monetary, and will almost certainly face psychic, costs of moving to
new surroundings—and in the case of immigration, the need to learn a new
language and adapt to a new culture makes these costs particularly burdensome. In short, workers who move to new employers bear costs in the near
term so that utility can be enhanced later on. Therefore, the human-capital
model introduced in chapter 9 can be used to analyze mobility investments by
workers.
The Determinants of Worker Mobility
The human-capital model views mobility as an investment in which costs are
borne in some early period in order to obtain returns over a longer period of time.
If the present value of the benefits associated with mobility exceeds the costs, both
monetary and psychic, we assume that people will decide to change jobs or move,
or both. If the discounted stream of benefits is not as large as the costs, then people will decide against such a change.
What determines the present value of the net benefits of mobility—that is,
the benefits minus the costs—determines the mobility decision. These factors can
be better identified by writing out the formula to use if we were to precisely calculate these net benefits:
T
Bt
Present Value of Net Benefits = a
t - C
t = 1 11 + r2
(10.1)
Geographic Mobility
325
where
Bt = the increased utility in year t derived from changing jobs
T = the length of time (in years) one expects to work at the new job
r = the rate of discount
C = the utility lost in the move itself (direct and psychic costs)
© = a summation—in this case, the summation of the yearly discounted net
benefits over a period running from year 1 to year T
Clearly, the present value of the net benefits of mobility will be larger the
greater is the utility derived from the new job, the less happy one is in the job of
origin, the smaller are the immediate costs associated with the change, and the
longer one expects to be in the new job or live in the new area (that is, the greater
T is). These observations lead to some clear-cut predictions about which groups
in society will be most mobile and about the patterns of mobility we would expect
to observe.
Geographic Mobility
Mobility of workers among countries, and among regions within a country, is an
important fact of economic life. We have seen that the foreign-born comprise 10
percent to 20 percent of the population of Europe and North America. Moreover,
migration within the United States is such that 1 of every 10 employees left their
state of residence in the five years between 2000 and 2005.2 Roughly one-third of
those moving among states stay with their current employers, but taking into
account those whose move is motivated by economic factors and who change
employers, about half of all interstate moves are precipitated by a change in
employment.3 This emphasis on job change suggests that human-capital theory
can help us understand which workers are most likely to undertake investments
in geographic mobility and the directions in which mobility flows will take place.
The Direction of Migratory Flows
Human-capital theory predicts that migration will flow from areas of relatively
poor earnings possibilities to places where opportunities are better. Studies of
migratory flows support this prediction. In general, the results of such studies
suggest that the pull of good opportunities in the areas of destination is stronger
2
U.S. Census Bureau, “Geographical Mobility: 2000–2005: Detailed Tables,” Table 9, at http://www
.census.gov/population/www/socdemo/migrate/cps2005-5yr.html.
3
Ann P. Bartel, “The Migration Decision: What Role Does Job-Mobility Play?” American Economic
Review 69 (December 1979): 775–786. See also Larry Schroeder, “Interrelatedness of Occupational and
Geographical Labor Mobility,” Industrial and Labor Relations Review 29 (April 1976): 405–411.
326
Chapter 10
Worker Mobility: Migration, Immigration, and Turnover
than the push of poor opportunities in the areas of origin. In other words, while
people are more attracted to places where earnings are expected to be better, they
do not necessarily come from areas where opportunities are poorest.
The most consistent finding in these detailed studies is that people are
attracted to areas where the real earnings of full-time workers are highest. Studies
find no consistent relationship, however, between unemployment and in-migration,
perhaps because the number of people moving with a job already in hand is three
times as large as the number moving to look for work. If one already has a job in a
particular field, the area’s unemployment rate is irrelevant.4
Most studies have found that contrary to what we might expect, the characteristics of the place of origin do not appear to have much net influence on migration. While those in the poorest places have the greatest incentives to move, the
very poorest areas also tend to have people with lower levels of wealth, education, and skills—the very people who seem least willing (or able) to move. To
understand this phenomenon, we must turn from the issue of where people go to
a discussion of who is most likely to move. (In addition, there is the issue of when
people move. See Example 10.1, which pulls together the issues of who, where,
and when in analyzing one of the most momentous internal migrations in the history of the United States—the Great Migration of blacks from the South to the
North in the first half of the twentieth century.)
Personal Characteristics of Movers
Migration is highly selective in the sense that it is not an activity in which all people
are equally likely to be engaged. To be specific, mobility is much higher among the
young and the better-educated, as human-capital theory would suggest.
Age Age is the single most important factor in determining who migrates.
Among Americans in their late twenties, 11.7 percent moved to another region
within the United States, or to another country, between 2000 and 2005; for those
in their late thirties and late forties, the corresponding percentages were 7.4 and
4.3 percent, respectively.5
There are two explanations for the fact that migration is an activity primarily for the young. First, the younger one is, the longer the period over which benefits from an investment can be obtained, and the larger the present value of these
benefits.
4
The level of new hires in an area appears to explain migration flows much better than the unemployment rate; see Gary Fields, “Place to Place Migration: Some New Evidence,” Review of Economics and
Statistics 61 (February 1979): 21–32. Robert H. Topel, “Local Labor Markets,” Journal of Political Economy
94, no. 3, pt. 2 (June 1986): S111–S143, contains an analysis of how permanent and transitory shifts in
an area’s demand affect migration and wages.
5
U.S. Census Bureau, “Geographical Mobility: 2000–2005: Detailed Tables,” Table 1, at http://www
.census.gov/population/www/socdemo/migrate/cps2005-5yr.html.
Geographic Mobility
327
EXAMPLE 10.1
The Great Migration: Southern Blacks Move North
Our model predicts that workers will move whenever
the present value of the net benefits of migration is
positive. After the Civil War and emancipation, a
huge wage gap opened up between the South and the
North, with northern wages often twice as high as
those in the South. Yet, black migration out of the
South was very low—only 68,000 during the 1870s.
During World War I, however, the Great Migration began, and over half a million blacks moved out
of the South in the 1910s. Black migration during the
1920s was almost twice this high, and it exceeded 1.5
million during the 1940s, so that by 1950, over 20
percent of southern-born blacks had left the region.
Why did this migration take so long to get going?
One important factor was low education levels,
which made obtaining information about outside
opportunities very difficult. In 1880, more than 75
percent of African Americans over age 10 were illiterate, but this figure fell to about 20 percent by
1930. One study finds that in 1900, literate adult
black males were three times more likely to have
migrated than those who were illiterate. In 1940,
blacks who had attended high school were twice as
likely to have migrated than those with zero to four
years of schooling. However, rising literacy alone
cannot explain the sudden burst of migration.
The outbreak of World War I seems to have triggered the migration in two ways. First, it caused labor
demand in northern industry to soar. Second, it
brought the collapse of immigration inflows from
abroad. Before World War I, growing northern industries had relied heavily on immigrants from Europe as
a source of labor. With the immigration flood slowing
to a trickle, employers began to hire black workers—
even sending agents to recruit in the South. Job
opportunities for blacks in the North finally opened
up, and many blacks responded by moving.
A study using census data from 1870 to 1950
finds that, as expected, northern states in which
wages were highest attracted more black migrants,
as did those in which manufacturing growth was
more rapid. Reduced European immigration seems
to have spurred black migration, and it is estimated
that if European immigration had been completely
restricted at the turn of the century, the Great Migration would have started much sooner.
Data from: William J. Collins, “When the Tide Turned:
Immigration and the Delay of the Great Black Migration,”
Journal of Economic History 57 (September 1997): 607–632;
Robert A. Margo, Race and Schooling in the South,
1880–1950 (Chicago: University of Chicago Press, 1990).
Second, a large part of the costs of migration is psychic—the losses associated with giving up friends, community ties, and the benefits of knowing one’s
way around. As we grow older, our ties to the community become stronger and
the losses associated with leaving loom larger.
Education While age is probably the best predictor of who will move, education
is the single best indicator of who will move within an age group. As can be seen
from Table 10.1, which presents U.S. migration rates for people aged 30–34, those
with college degrees are much more likely to make an out-of-state move.
One cost of migration is that of applying and interviewing for job offers. If
one’s occupation has a national (or international) labor market, as is the case for
many college graduates, recruiters visit college campuses, and arrangements
for interviews requiring fly-ins are commonplace—and often at the expense of
the employer. However, if the relevant labor market for one’s job is localized,
328
Chapter 10
Worker Mobility: Migration, Immigration, and Turnover
Ta b l e 1 0 . 1
U.S. Migration Rates for People Aged 30–34, by Educational Level,
2000–2005
Educational Level (in Years)
Moving out of State (%)
9–11
12
13–15
16
17 or more
14.7
11.9
13.2
17.6
27.3
Source: U.S. Census Bureau, “Geographical Mobility: 2000–2005: Detailed Tables,” Table 6, http://www
.census.gov/population/www/socdemo/migrate/cps2005-5yr.html.
the mechanisms for recruiting workers residing in distant areas are less likely to
exist, and workers looking for a job far from home will find it relatively costly to
interview.
The Role of Distance
Human-capital theory clearly predicts that as migration costs rise, the flow of
migrants will fall. The costs of moving increase with distance for two reasons.
First, acquiring trustworthy information (often from friends or colleagues) on
opportunities elsewhere is easier—especially for workers whose jobs are in
“local” labor markets—when employment prospects are closer to home. Second,
the time and money cost of a move and for trips back to see friends and relatives,
and hence the psychic costs of the move, rise with distance.
Interestingly, lack of education appears to be a bigger deterrent to longdistance migration than does age (other influences held constant), a fact that can
shed some light on whether information costs or psychic costs are the primary
deterrent. As suggested by our arguments in the previous section, the age deterrent
is closely related to psychic costs, while educational level and ease of access to
information are closely linked. The apparently larger deterrent of educational
level suggests that information costs may have more influence than psychic costs
on the relationship between migration and distance.6
The Earnings Distribution in Sending Countries
and International Migration
To this point, our examples of factors that influence geographic mobility have
related to domestic migration, but the influences of age, access to information,
the potential gains in earnings, and distance are all relevant to international
6
Aba Schwartz, “Interpreting the Effect of Distance on Migration,” Journal of Political Economy 81 (September/October 1973): 1153–1167.
Geographic Mobility
329
EXAMPLE 10.2
Migration and One’s Time Horizon
Economic theory suggests that those with longer
time horizons are more likely to make human-capital
investments. Can we see evidence of this theoretical implication in the horizons of people who are
most likely to migrate? A recent paper explores the
possibility that people who give greater weight to
the welfare of their children and grandchildren
have a higher propensity to bear the considerable
costs of immigration.
Before 1989, the Soviet Union made it difficult,
although not impossible, for Jews to emigrate.
Applying for emigration involved heavy fees; moreover, the applicant’s property was often confiscated
and his or her right to work was often suspended.
However, after the collapse of the Soviet Union in
1989, these hassles were eliminated. The monetary
benefits of migrating were approximately the same
before and after 1989, but the costs fell considerably.
How did migrants from the earlier period—who
were willing to bear the very high costs—differ
from those who emigrated only when the costs
were reduced? The study finds evidence that Jewish
women who migrated to Israel during the earlier
period brought with them larger families (on average, 0.4 to 0.8 more children) than otherwise similar migrants in the later period. This suggests that
the benefits of migration to children may have been
a decisive factor in the decision to migrate during
the pre-1989 period.
Likewise, a survey of women aged 51 to 61
shows that grandmothers who have immigrated to
the United States spend over 200 more hours per
year with their grandchildren than American-born
grandmothers. They are also more likely to report
that they consider it important to leave an inheritance (rather than spending all their wealth on
themselves).
Thus, there is evidence consistent with the theoretical implication that those who invest in immigration have longer time horizons (in the sense of
putting greater weight on the welfare of their children and grandchildren) than those who do not.
Data from: Eli Berman and Zaur Rzakhanov, “Fertility,
Migration and Altruism,” National Bureau of Economic
Research, working paper no. 7545 (February 2000).
migration as well. Additionally, because immigrants are self-selected and the
costs of immigration are so high, personal discount rates (or orientation toward
the future) are critical and likely to be very different for immigrants and nonmigrants. That is, as illustrated in Example 10.2, immigrants—like others who make significant investments in human capital—are more likely to have lower-than-average
personal discount rates.
One aspect of the potential gains from migration that is uniquely important
when analyzing international flows of labor is the distribution of earnings in the
sending as compared with the receiving country. The relative distribution of earnings can help us predict which skill groups within a sending country are most
likely to emigrate.7
Some countries have a more compressed (equal) earnings distribution than
is found in the United States. In these countries, the average earnings differential
7
The theory in this section is adapted from Andrew D. Roy, “Some Thoughts on the Distribution of
Earnings,” Oxford Economic Papers 3 (June 1951): 75–106; for a more thorough discussion of this issue,
see George J. Borjas, Friends or Strangers (New York: Basic Books, 1990), especially chapters 1 and 7.
330
Chapter 10
Worker Mobility: Migration, Immigration, and Turnover
between skilled and unskilled workers is smaller, implying that the returns to
human-capital investments are lower than in the United States. Skilled and professional workers from these countries (northern European countries are most
notable in this regard) have the most to gain from emigration to the United States.
Unskilled workers in countries with more equality of earnings are well paid compared with unskilled workers here and thus have less incentive to move. Immigrants to the United States from these countries, therefore, tend to be more skilled
than the average worker who does not emigrate.
In countries with a less equal distribution of earnings than is found in the
United States, skilled workers do relatively well, but there are large potential
gains to the unskilled from emigrating to the United States. These unskilled workers may be blocked from making human-capital investments within their own
countries (and thus from taking advantage of the high returns to such investments that are implied by the large earnings differentials). Instead, their humancapital investment may take the form of emigrating and seeking work in the
United States. Less-developed countries tend to have relatively unequal earnings
distributions, so it is to be expected that immigrants from these countries (and
especially Mexico, which is closest) will be disproportionately unskilled.
The Returns to International and Domestic Migration
We have seen that migrants generally move to places that allow them greater
earnings opportunities. How great these earnings increases are for individual
migrants depends on the reasons and preparation for the move.
Internal Migration for Economic Reasons The largest earnings increase from
migration can be expected among those whose move is motivated by a better job
offer and who have obtained this offer through a job-search process undertaken
before quitting their prior jobs. A study of men and women in their twenties who
were in this category found that for moves in the 1979–1985 period, earnings
increased 14 percent to 18 percent more than earnings of nonmigrants. Even those
who quit voluntarily and migrated for economic reasons without a prior job search
earned 6 percent to 9 percent more than if they had stayed put.8 The returns for
women and men who migrated for economic reasons were very similar.
Family Migration Most of us live in families, and if there is more than one
employed person in a family, the decision to migrate is likely to have different
earnings effects on the members. You will recall from chapter 7 that there is more
than one plausible model for how those who live together actually make joint
labor supply decisions, but with migration, a decision to move might well be
made if the family as a whole experiences a net increase in total earnings. Total
8
Kristen Keith and Abagail McWilliams, “The Returns to Mobility and Job Search by Gender,”
Industrial and Labor Relations Review 52 (April 1999): 460–477.
Geographic Mobility
331
family earnings, of course, could be increased even if one partner’s earnings were
to fall as a result of the move, as long as the other partner experienced relatively
large gains. Considering family migration decisions raises the issue of tied
movers—those who agree to move for family reasons, not necessarily because the
move improves their own earnings.
Among those in their twenties who migrated in the 1979–1985 period, quitting jobs and moving for family reasons caused earnings to decrease by an average of 10 percent to 15 percent—although searching for a new job before moving
apparently held wage losses to zero.9 Clearly, migrating as a tied mover can be
costly to an individual. Women move more often than men for family reasons, but
as more complete college or graduate school and enter careers, their willingness
to move for family reasons may fall. The growing preference among collegeeducated couples for living in large urban areas, where both people have access
to many alternative job opportunities without moving, reflects the costs of migrating as a tied mover.10
Returns to Immigration Comparing the earnings of international immigrants
with what they would have earned had they not emigrated is generally not feasible, owing to a lack of data on earnings in the home country—although a comparison of the wages received by Mexican immigrants in the United States with
those paid to comparable workers in Mexico suggests that the gain from crossing
the border was in the range of $9,000 to $16,000 per year in 2000 (a large percentage gain, given that the average per capita income in Mexico was $9,700 in that
year).11
Most studies of the returns to immigration have focused on comparisons of
immigrants’ earnings with those of native-born workers in the host country.
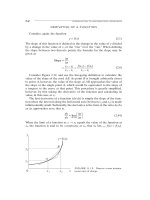
Figure 10.1 displays, for men who immigrated to the United States decades ago,
the path of their earnings relative to those of native-born Americans with similar
amounts of labor market experience. While not reflecting the experience of recent
immigrants, Figure 10.1 illustrates three generalizations about the relative earnings of immigrants over time. First, immigrants earn substantially less than their
native-born counterparts when they first arrive in the United States. Second, each
succeeding cohort of immigrants has done less well upon entry than its predecessor. Third, the relative earnings of immigrants rise over time, which means that
their earnings rise faster than those of natives, especially in the first 10 years after
immigration.
9
Keith and McWilliams, “The Returns to Mobility and Job Search by Gender.”
Dora L. Costa and Matthew E. Kahn, “Power Couples: Changes in the Locational Choice of the College Educated, 1940–1990,” Quarterly Journal of Economics 115 (November 2000): 1287–1315.
11
The wage comparisons are expressed in 2000 dollars and represent U.S.-Mexico wage differences for
workers of the same age and with the same education; see Gordon H. Hanson, “The Economic Consequences of the International Migration of Labor,” American Review of Economics 1 (September 2009):
179–208.
10
332
Chapter 10
Worker Mobility: Migration, Immigration, and Turnover
Figure 10.1
Male Immigrant
Earnings Relative to
Those of the NativeBorn with Similar
Labor-Market
Experience, by
Immigrant Cohort
Source: Adapted from
Darren Lubotsky, “Chutes
or Ladders? A Longitudinal Analysis of Immigrant Earnings,” working
paper no. 445, Industrial
Relations Section, Princeton University, August
2000, Figure 6.
Immigrant Earnings as a
% of Native Earnings
100%
1970–79
• • • • • • •
• •• •• • •• • • • • • • • • • •
•
•
• •
1960–69
• •• •• •• ••
•
• • • 1980–94
•• •• • •
•
• • •
• •
90%
80%
70%
60%
50%
•
0
(dates shown are dates of entry into the United States)
5
10
15
20
25
Years in the United States
Immigrants’ Initial Earnings That immigrants initially earn substantially less
than natives is hardly surprising. Even after controlling for the effects of education (the typical immigrant is less educated than the typical native), immigrants
earn less owing to their difficulties with English, their unfamiliarity with American employment opportunities, and their lack of an American work history (and
employers’ consequent uncertainties about their productivity).
The fall in the initial earnings of successive immigrant groups relative to
U.S. natives has been widely studied in recent years. It appears to reflect the fact
that immigrants to the United States are coming increasingly from countries with
relatively low levels of educational attainment, and they are therefore arriving in
the United States with less and less human capital.12
Immigrants Earnings Growth Earnings of immigrants rise relatively quickly,
which no doubt reflects their high rates of investment in human capital after
arrival. After entry, immigrants typically invest in themselves by acquiring work
experience and improved proficiency in English, and these investments raise the
wages they can command. For example, one study found that English fluency
raises immigrant earnings by an average of 17 percent in the United States, 12 percent in Canada, and 9 percent in Australia. Of course, not all immigrants have the
same incentives to become proficient in English. Those who live in enclaves
where business is conducted in their native tongue may have reduced incentives
12
George Borjas, “The Economics of Immigration,” Journal of Economic Literature 32 (December 1994):
1667–1717; and George Borjas, Heaven’s Door: Immigration Policy and the American Economy (Princeton,
N.J.: Princeton University Press, 1999).
Geographic Mobility
333
to learn English, while those who are not able to return to their native countries
have greater incentives to invest time and money in mastering English (political
refugees are in the latter group; for an analysis, see the Empirical Study at the end
of this chapter).13
Return Migration It is important to understand that the data underlying
Figure 10.1 are from immigrants who remained working in the United States for
at least 15 years after first entry. They are the ones for whom the investment in
immigration was successful enough that they remained. Many of those for whom
immigration does not yield the expected returns decide to return to their country
of origin; indeed, about 20 percent of all moves are back to one’s place of origin.14
One study found that those who are most likely to return are the ones who were
closest to the margin (expected the least net gains) when they first decided to
come.15 Return migration highlights another important fact: immigration, like
other human-capital investments, entails risk—and not all such investments work
out as hoped.
Policy Application: Restricting Immigration
Nowhere are the analytical tools of the economist more important than in the area
of immigration policy. Immigration has both economic and cultural consequences, and there is some evidence that people’s views on the desirability of
immigration may be based largely on their attitudes toward cultural diversity.16
However, the public debate about immigration is most often focused on claims
about its economic consequences, so it is important to use economic theory to
guide our analysis of these outcomes. After a brief outline of the history of U.S.
immigration policy, this section will analyze in detail the economic effects of a
13
Barry R. Chiswick and Paul W. Miller, “The Endogeneity between Language and Earnings: International Analyses,” Journal of Labor Economics 13 (April 1995): 246–288; Barry R. Chiswick and Paul
W. Miller, “Language Skills and Earnings among Legalized Aliens,” Journal of Population Economics 12
(February 1999): 63–91; Heather Antecol, Peter Kuhn, and Stephen J. Trejo, “Assimilation via Prices or
Quantities? Sources of Immigrant Earnings Growth in Australia, Canada, and the United States,”
Journal of Human Resources 41 (Fall 2006): 821–840; and Eli Berman, Kevin Lang, and Erez Siniver,
“Language-Skill Complementarity: Returns to Immigrant Language Acquisition,” Labour Economics 10
(June 2003): 265–290.
14
John Vanderkamp, “Migration Flows, Their Determinants and the Effects of Return Migration,”
Journal of Political Economy 79 (September/October 1971): 1012–1031; Fernando A. Ramos, “Outmigration and Return Migration of Puerto Ricans,” in Immigration and the Work Force, eds. George J. Borjas
and Richard B. Freeman (Chicago: University of Chicago Press, 1992); and Borjas, “The Economics of
Immigration,” 1691–1692.
15
George J. Borjas and Bernt Bratsberg, “Who Leaves? The Outmigration of the Foreign-Born,” Review
of Economics and Statistics 78 (February 1996): 165–176.
16
David Card, Christian Dustmann, and Ian Preston, “Immigration, Wages, and Compositional
Amenities,” National Bureau of Economic Research Working Paper No. 15521 (Cambridge, Mass.:
November 2009).
334
Chapter 10
Worker Mobility: Migration, Immigration, and Turnover
phenomenon that is currently attracting much discussion in the United States: the
immigration of workers whose immigration status is considered “unauthorized,”
because they do not have the documentation necessary to legally reside in the
country.
U.S. Immigration History
The United States is a rich country whose wealth and high standard of living
make it an attractive place for immigrants from nearly all parts of the world. For
the first 140 years of its history as an independent country, the United States followed a policy of essentially unrestricted immigration (the only major immigration restrictions were placed on Asians and on convicts). The flow of immigrants
was especially large after 1840, when U.S. industrialization and political and economic upheavals in Europe made immigration an attractive investment for millions. Officially recorded immigration peaked in the first decade of the twentieth
century, when the yearly flow of immigrants was more than 1 percent of the population (see Table 10.2).
Restrictions In 1921, Congress adopted the Quota Law, which set annual quotas on immigration on the basis of nationality. These quotas had the effect of
reducing immigration from eastern and southern Europe. This act was followed
by other laws in 1924 and 1929 that further restricted immigration from southeastern Europe. These various revisions in immigration policy were motivated, in
part, by widespread concern over the alleged adverse effect on native employment of the arrival of unskilled immigrants from eastern and southern Europe.
Ta b l e 1 0 . 2
Officially Recorded Immigration: 1901 to 2009
Period
1901–1910
1911–1920
1921–1930
1931–1940
1941–1950
1951–1960
1961–1970
1971–1980
1981–1990a
1991–2000a
a
Annual Rate
(per Thousand
Number
of U.S.
(in Thousands) Population)
8,795
5,736
4,107
528
1,035
2,515
3,322
4,389
7,338
9,082
10.4
5.7
3.5
0.4
0.7
1.5
1.7
2.0
3.1
3.4
Year
2001
2002
2003
2004
2005
2006
2007
2008
2009
Annual Rate
(per Thousand
Number
of U.S.
(in Thousands) Population)
1,059
1,059
704
958
1,122
1,266
1,052
1,107
1,131
3.7
3.7
2.4
3.3
3.8
4.2
3.5
3.6
3.7
Includes illegal immigrants granted amnesty under the Immigration Reform and Control Act of 1986.
Source: U.S. Immigration and Naturalization Service, Yearbook of Immigration Statistics: 2009, Table 1.
Geographic Mobility
335
In 1965, the passage of the Immigration and Nationality Act abolished the
quota system based on national origin that so heavily favored northern and western Europeans. Under this law, as amended in 1990, overall immigration is formally restricted, with most spots reserved for family-reunification purposes and
relatively few (roughly 20 percent) reserved for immigrants with special skills
who are admitted for employment purposes. Political refugees, who must meet
certain criteria relating to persecution in their home countries, are admitted without numerical limit. The fact that immigration to the United States is a very
worthwhile investment for many more people than can legally come, however,
has created incentives for people to live in the country without official approval.
Unauthorized Immigration Unauthorized immigration can be divided into two
categories of roughly equal size: immigrants who enter legally but overstay or
violate the provisions of their visas, and those who enter the country illegally.
Roughly 30 million people enter the United States each year under nonimmigrant
visas, usually as students or visitors. Once here, the foreigner can look for work,
although working at a job under a student’s or visitor’s visa is not authorized. If
the student or visitor is offered a job, he or she can apply for an “adjustment of
status” to legally become a permanent resident, although the chances for
approval as an employment-based immigrant are slim for the ordinary worker.
Many immigrants, however, enter the country without a visa. Immigrants
from the Caribbean often enter through Puerto Rico, whose residents are U.S. citizens and thus are allowed free entry to the mainland. Others walk across the Mexican border. Still others are smuggled into the United States or use false documents to
get through entry stations. Between 1990 and 2007, the yearly increase in the number of unauthorized immigrants was estimated to be in the range of 350,000 to
580,000; however, with the recession of 2008 and 2009, many apparently left. An
estimated population of 11.8 million unauthorized immigrants in 2007 was down
to 10.8 million (or some 3.5 percent of the overall U.S. population) in 2009.17
Almost three-quarters of all unauthorized immigrants are from Mexico (62 percent) and Central America (12 percent).
As of 2010, Americans were split over what to do about unauthorized immigration. There were calls for the enhancement of border security, especially along
the Mexican border, accompanied by assertions that such immigration was harmful to Americans as a whole—by increasing the population of unskilled workers,
reducing the wages of native-born workers, and putting greater demands on government spending than the unauthorized immigrants pay in taxes. On the other
side, there were assertions that undocumented immigrants are fulfilling a useful
economic function by performing tasks that Americans are increasingly less willing to do and that they should be given a path to achieve legal residency. Before
17
Gordon H. Hanson, “Illegal Migration from Mexico to the United States,” Journal of Economic Literature 44 (December 2006): 869–924; and Michael Hoefer, Nancy Rytina, and Bryan C. Baker, “Estimates
of the Unauthorized Immigrant Population Residing in the United States: January 2009,” U.S. Department of Homeland Security, Office of Immigration Statistics (Washington, D.C.: January 2010).
336
Chapter 10
Worker Mobility: Migration, Immigration, and Turnover
we turn to an economic analysis of the effects of immigration on the receiving
country, we will briefly describe the immigrants from Mexico, who are the focus
of the current debate.
Immigrants from Mexico Immigration to the United States from Mexico—both
authorized and unauthorized—is large, for two reasons: the huge differential in
income per capita between the two countries and the fact that they share a long
border. In 2007, when almost 12 million Mexican immigrants were living in the
United States, they constituted roughly one-third of the entire foreign-born population.18 Of the 12 million, about half were undocumented.
Earlier, we reviewed theory suggesting that for a country with a wider
distribution of earnings than is found in the United States, we would expect emigration to the United States to come largely from the lower end of its skill distribution. While the typical Mexican immigrant is less educated than the average
American, because educational levels are generally lower in Mexico, the most
recent immigrants from Mexico come from the middle of Mexico’s skill distribution, not the bottom. For example, let us focus on Mexican men between the ages
of 28 and 37. In Mexico, 23 percent of this group has between 10 and 15 years of
schooling; however, among recent immigrants to the United States, 40 percent
were in this educational group. In contrast, while in Mexico about two-thirds of
this age group have less than 10 years of schooling, only about half of those who
emigrate from Mexico have less than 10 years of education. Why is the middle of
the Mexican educational distribution overrepresented in the immigrant group,
not the lower level?
The cost of crossing the border is high, and it has become higher after the
United States increased border surveillance in 2002 and beyond. Surveys done in
areas of Mexico that are the source of much emigration to the United States suggest that between 80 and 95 percent of undocumented entrants use the services of
a smuggler (“coyote”), whom they pay—in advance—to facilitate their crossing.
The average fee charged by coyotes in 2004 was reported to be $1,680—a substantial fraction of the yearly per-capita income in Mexico. Furthermore, the chances
one will spend this money and still get caught (and returned to Mexico) are about
1 in 3. While estimates suggest that this investment can be recouped in 8–11 weeks
of work, the fee represents a significant credit constraint that the poorest Mexicans probably cannot overcome.
The policies people advocate are based on their beliefs about the consequences of immigration for employers, consumers, taxpayers, and workers of various skill levels and ethnicities. Nearly everyone with an opinion on this subject
has an economic model implicitly or explicitly in mind when addressing these
consequences; the purpose of the following sections is to make these economic
models explicit and to evaluate them.
18
U.S. Census Bureau, “Race and Hispanic Origin of the Foreign-Born Population in the United States:
2007,” American Community Survey Reports (Washington, D.C.: January 2010). Data in the remainder
of this section are from Hanson, “Illegal Migration from Mexico to the United States.”
Geographic Mobility
337
Naive Views of Immigration
There are two opposing views of illegal immigration that can be considered naive.
One view is that every employed illegal immigrant deprives a citizen or legal resident of a job. For example, a Department of Labor official told a House committee studying immigration: “I think it is logical to conclude that if they are actually
employed, they are taking a job away from one of our American citizens.” According to this view, if x illegal immigrants are deported and others kept out, the
number of unemployed Americans would decline by x.
At the opposite end of the policy spectrum is the equally naive argument
that the illegals perform jobs no American citizen would do: “You couldn’t conduct a hotel in New York, you couldn’t conduct a restaurant in New York . . . if
you didn’t have rough laborers. We haven’t got the rough laborers anymore. . . .
Where are we going to get the people to do that rough work?”19
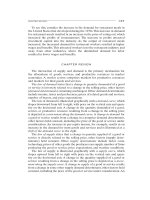
Both arguments are simplistic because they ignore the slopes of the demand
and supply curves. Consider, for example, the labor market for the job of “rough
laborer”—any job most American citizens find distasteful. Without illegal immigrants, the restricted supply of Americans to this market would imply a relatively
high wage (W1 in Figure 10.2). N1 citizens would be employed. If illegal immigrants entered the market, the supply curve would shift outward and perhaps
flatten (implying that immigrants were more responsive to wage increases for
Figure 10.2
Demand and Supply of Rough Laborers
Wages
Domestic Supply
A
Total Supply
(including
illegal aliens)
B
W1
C
D
W2
Demand
(marginal
revenue
product)
0
N3
N1
N2
Number of Workers
19
Both quotes in this section are from Elliott Abrams and Franklin S. Abrams, “Immigration Policy—
Who Gets In and Why?” Public Interest 38 (Winter 1975): 25–26.
338
Chapter 10
Worker Mobility: Migration, Immigration, and Turnover
rough laborers than citizens were). The influx of illegals would drive the wage
down to W2, but employment would increase to N2.
Are Americans unwilling to do the work of rough laborers? Clearly, at the
market wage of W2, many more immigrants are willing to work at the job than
U.S. citizens are. Only N3 citizens would want these jobs at this low wage, while
the remaining supply (N2 - N3) is made up entirely of immigrants. If there were
no immigrants, however, N1 Americans would be employed at wage W1 as rough
laborers. Wages would be higher, as would the prices of the goods or services produced with this labor, but the job would get done. The only shortage of American
citizens is at the low wage of W2; at W1, there is no shortage (review chapter 2 for
a discussion of labor shortages).
Would deporting those illegal immigrants working as rough laborers create
the same number of jobs for U.S. citizens? The answer is clearly no. If the N2 - N3
immigrants working as laborers at wage W2 were deported and all other illegal
immigrants were kept from the market, the number of Americans employed as
laborers would rise from N3 to N1 and their wages would rise from W2 to W1
(Figure 10.2). N2 - N1 jobs would be destroyed by the rising wage rate associated
with deportation. Thus, while deportation would increase the employment and
wage levels of Americans in the market for laborers, it would certainly not
increase employment on a one-for-one basis.20
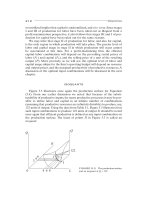
There is, however, one condition in which deportation would create jobs for
American citizens on a one-for-one basis: when the federal minimum wage law
creates a surplus of labor. Suppose, for example, that the supply of “native” laborers is represented by ABS1 in Figure 10.3 and the total supply is represented by
ACS2. Because an artificially high wage has created a surplus, only N of the N¿
workers willing to work at the minimum wage can actually find employment. If
some of them are illegal immigrants, deporting them—coupled with successful
efforts to deny other immigrants access to these jobs—would create jobs for a
comparable number of Americans. However, the demand curve would have to
intersect the domestic supply curve (ABS1) at or to the left of point B to prevent
the wage level from rising (and thus destroying jobs) after deportation.
The analyses above ignore the possibility that if low-wage immigrant labor
is prevented from coming to the jobs, employers may transfer the jobs to countries
with abundant supplies of low-wage labor. Thus, it may well be the case that
unskilled American workers are in competition with foreign unskilled workers
anyway, whether those workers are employed in the United States or elsewhere.
However, not all unskilled jobs can be moved abroad, because not all outputs can
be imported (most unskilled services, for example, must be performed at the
place of consumption); therefore, our analyses will continue to focus on situations
in which the “export” of unskilled jobs is infeasible or very costly.
20
For a study suggesting that for every five Vietnamese manicurists who immigrated to California, a
net of three new jobs were created, see Maya N. Federman, David E. Harrington, and Kathy J. Krynski, “Vietnamese Manicurists: Are Immigrants Displacing Natives or Finding New Nails to Polish?”
Industrial and Labor Relations Review 59 (January 2006): 302–318.
Geographic Mobility
339
Figure 10.3
Wages
S1
Demand
•
A
0
B
•
..............
Minimum
Wage
(Domestic
Supply)
S2
(Total
Supply)
C
•
...............
Demand and Supply of Rough Laborers with
a Minimum Wage
N
N′
Number of Workers
An Analysis of the Gainers and Losers
The claim that immigration is harmful to American workers is often based on a
single-market analysis like that contained in Figure 10.2, where only the effects on
the market for rough labor are examined. As far as it goes, the argument is plausible. When immigration increases the supply of rough laborers, both the wages
and the employment levels of American citizens working as laborers are reduced.
The total wage bill paid to American laborers falls from W10N1B in Figure 10.2 to
W20N3D. Some American workers leave the market in response to the reduced
wage, and those who stay earn less. Even if the immigration of unskilled labor
were to adversely affect domestic laborers, however, it would be a mistake to conclude that it is necessarily harmful to Americans as a whole.
Consumers Immigration of “cheap labor” clearly benefits consumers using the
output of this labor. As wages are reduced and employment increases, the goods
and services produced by this labor are increased in quantity and reduced in
price. Indeed, a recent study suggests that the influx of low-skilled immigrants
(who presumably provide household and childcare services) has made it easier
for American college-educated women to pursue careers while simultaneously
rearing children.21
21
Delia Furtado and Henrich Hock, “Low Skilled Immigration and Work-Fertility Tradeoffs Among
High Skilled US Natives,” American Economic Review: Papers and Proceedings 100 (May 2010): 224–228.
340
Chapter 10
Worker Mobility: Migration, Immigration, and Turnover
Employers Employers of rough labor (to continue our example) are obviously
benefited, at least in the short run. In Figure 10.2, profits are increased from W1AB
to W2AC. This rise in profitability will have two major effects. By raising the
returns to capital, it will serve as a signal for investors to increase investments in
plant and equipment. Increased profits will also induce more people to become
employers. The increases in capital and the number of employers will eventually
drive profits down to their normal level, but in the end, the country’s stock of capital is increased and opportunities are created for some workers to become owners.
Scale and Substitution Effects Our analysis of the market for laborers
assumed that the influx of immigrants had no effect on the demand curve (which
was held fixed in Figure 10.2). This is probably not a bad assumption when looking at just one market, because the fraction of earnings immigrant laborers spend
on the goods and services produced by rough labor may be small. However,
immigrants do increase the population of consumers in the United States, thereby
increasing the demand for mechanics, bus drivers, retail clerks, teachers, construction workers, and so forth (see Figure 10.4). Thus, workers who are not close
substitutes for unskilled immigrant labor may benefit from immigration because
of the increase in consumer demand.
Recall from chapter 3 that if the demand for skilled workers increases when
the wage of unskilled labor falls, the two grades of labor are gross complements.
Assuming skilled and unskilled labor are substitutes in the production process,
the only way they could be gross complements is if the scale effect of a decline in
the unskilled wage dominated the substitution effect. In the case of immigration,
Figure 10.4
Wages
Supply
. . . . . . . . . . . . .•
W1
. . . . . . . . . .•
0
.................
W2
.............
Market for All Labor Except Unskilled
N1 N2
Number of Workers
Post-Immigration
Demand
Pre-Immigration
Demand
Geographic Mobility
341
we may suppose the scale effect to be very large, because as the working population rises, aggregate demand is increased. While theoretical analysis cannot prove
that the demand for skilled workers is increased by the immigration of unskilled
labor if the two grades of labor are substitutes in the production process, it can
offer the above observation that an increase in demand for skilled workers
remains a distinct possibility. Of course, any type of labor that is complementary
with unskilled labor in the production process—supervisory workers, for example—
can expect to gain from an influx of unskilled immigrants.
Empirical Estimates of the Effects on Natives Because of the intense concern
about the effects of illegal immigration on American workers, much of the empirical work has focused on the effects of an influx of low-skilled immigrants on
those in the United States, especially in low-skilled sectors. Broadly speaking,
there are two general approaches taken by these studies.
One approach is to look at how the proportion of unskilled immigrants in
cities affects the wages of natives, especially less-skilled workers, in those cities.
In these studies, care must be taken to account for the likelihood that immigrants
will go to cities with the best opportunities. Once account is taken of this likelihood, most studies taking this approach find that the influx of low-skilled immigrants in the last two decades has had rather small (or even negligible) effects on
the wages of workers with a high school education or less.22 A variant of this
approach is summarized in Example 10.3.
Some economists argue, however, that estimating the effects of immigration
using cities as units of observation biases the estimated wage effects on natives
toward zero. They argue that many low-skilled natives respond to an influx of
immigrants (who compete with them for jobs) by leaving the city and that these
studies thus fail to measure the ultimate effects on their wages. Whether natives
respond to immigration in this way, and—if so—how quickly, is a factual issue
that has not been settled.23
The possibility that area-based studies produce biased results because
natives migrate in response to immigration has led to a second approach to estimating the effects of immigration on natives—a methodology that analyzes, at the
national level, how the wages in specific human-capital groups (defined by education and experience) are affected over time by changes in the immigrant composition of those groups. This approach requires making assumptions about (a) the
degree of substitutability between immigrants and natives within human-capital
groups and (b) the response of capital investments over time to changes in labor
supplies. The results using this second approach are highly affected by these
assumptions. One such study concluded that immigration between 1980 and 2000
22
For reviews of the literature on this topic, see Hanson, “The Economic Consequences of the International Migration of Labor,” and David Card, “Immigration and Inequality,” American Economic Review:
Papers and Proceedings 99 (May 2009): 1–21.
23
Card, “Immigration and Inequality.”
342
Chapter 10
Worker Mobility: Migration, Immigration, and Turnover
EXAMPLE 10.3
The Mariel Boatlift and Its Effects on Miami’s Wage
and Unemployment Rates
Between May and September of 1980, some 125,000
Cubans were allowed to emigrate to Miami from the
port of Mariel in Cuba. These immigrants, half of
whom permanently settled in Miami, increased
Miami’s overall labor force by 7 percent in under
half a year. Because two-thirds of “the Mariels” had
not completed high school, and because unskilled
workers made up about 30 percent of Miami’s
workforce, it is likely that the number of unskilled
workers in Miami increased by 16 percent or more
during this short period! Such a marked and rapid
increase in labor market size is highly unusual, but
it provides an interesting “natural experiment” on
the consequences of immigration for a host area.
If immigration has negative effects on wages in
the receiving areas, we would expect to observe that
the wages of Miami’s unskilled workers fell relative
to the wages of its skilled workers and relative to the
wages of unskilled workers in otherwise comparable
cities. Neither relative decline occurred; in fact, the
wages of unskilled black workers in Miami actually
rose relative to wages of unskilled blacks in four
comparison cities (Atlanta, Los Angeles, Houston,
and Tampa). Similarly, the unemployment rate
among low-skilled blacks in Miami improved, on
average, relative to that in other cities during the
five years following the boatlift. Among Hispanic
workers, there was an increase in Miami’s unemployment rate relative to that in the other cities
in 1981, but from 1982 to 1985, the Hispanic
unemployment rate in Miami fell faster than in the
comparison cities.
What accounts for the absence of adverse pressures on the wages and unemployment rates of
unskilled workers in the Miami area? First, concurrent rightward shifts in the demand curve for labor
probably tended to offset the rightward shifts in
labor supply curves.
Second, it also appears that some residents left
Miami in response to the influx of immigrants and
that other potential migrants went elsewhere; the rate
of Miami’s population growth after 1980 slowed considerably relative to that of the rest of Florida, so that
by 1986, its population was roughly equal to what it
was projected to be by 1986 before the boatlift. For
locational adjustments of residents and potential inmigrants to underlie the lack of wage and unemployment effects, these adjustments would have to have
been very rapid. Their presence reinforces the theoretical prediction, made earlier in this chapter, that
migration flows are sensitive to economic conditions
in both sending and receiving areas.
Data from: David Card, “The Impact of the Mariel Boatlift
on the Miami Labor Market,” Industrial and Labor Relations
Review 43 (January 1990): 245–257. For a recent study of
mass migration to Israel, with references to similar studies
for France and Portugal, see Sarit Cohen-Goldner and
M. Daniele Paserman, “Mass Migration to Israel and
Natives’ Employment Transitions,” Industrial and Labor
Relations Review 59 (July 2006): 630–652.
reduced the average wages of natives by less than half a percent in the short run,
and increased their wages by a similar magnitude in the long run; others have
found effects that are somewhat more negative but still can be characterized as
small.24 Researchers do agree, however, that the group of workers most likely to
24
Gianmarco I. P. Ottaviano and Giovanni Peri, “Immigration and National Wages: Clarifying the Theory and Empirics,” National Bureau of Economic Research Working Paper no. 14188 (Cambridge,
Mass.: July 2008); Hanson, “The Economic Consequences of the International Migration of Labor”;
Card, “Immigration and Inequality”; and Steven Raphael and Eugene Smolensky, “Immigration and
Poverty in the United States,” American Economic Review: Papers and Proceedings 99 (May 2009): 41–44.
Geographic Mobility
343
experience any negative wage effects from increased immigration are prior
immigrants (who are the closest substitutes for new immigrants).25
It seems fair to say, then, that it is not entirely clear how immigration of lessskilled workers to the United States has affected the wages, on average, of native
workers. There is general agreement among researchers that if there are negative
effects on the wages of natives, they will be felt mostly in the market for the lessskilled (those with high school educations or less)—that is, among those with
whom immigrants are most substitutable. The larger question about immigration,
however, is whether the losses of low-skilled native workers occur in the context of an overall gain to Americans as a whole. If so, as with the case of technological change
analyzed earlier (see the end of chapter 4), an important focus of immigration
policy should be on shifting some of the overall gains from immigration to those
who suffer economic losses because of it. We turn next to an analysis of the economic effects of immigration—especially unauthorized immigration—on society
as a whole.
Do the Overall Gains from Immigration Exceed the Losses?
So far, we have used economic theory to analyze the likely effects of immigration
on various groups of natives, including consumers, owners, and skilled and
unskilled workers. Theory suggests that some of these groups should be clear-cut
gainers; among these are owners, consumers, and workers who are complements
in production with immigrants. Workers whose labor is highly substitutable in
production with immigrant labor are the most likely losers from immigration,
while the gains or losses for other groups of native workers are theoretically
unpredictable, owing to potentially offsetting influences of the substitution and
scale effects.
In this section, we use economic theory to analyze a slightly different question: “What does economic theory say about the overall effects of immigration—
particularly unauthorized immigration—on the host country?” Put in the context
of the normative criteria presented in chapter 1, this section asks, “If there are both
gainers and losers from immigration among natives in the host country, is it likely
that the gainers would be able to compensate the losers and still feel better off?”
The answer to this question will be yes if immigration increases the aggregate
disposable income of natives.
What Do Immigrants Add? Immigrants, whether authorized or undocumented,
are both consumers and producers, so whether their influx makes those already
residing in the host country richer or poorer, in the aggregate, depends on how
much the immigrants add to overall production as compared with how much they
consume. Let us take a simple example of elderly immigrants allowed into the
25
Hanson, The Economic Consequences of the International Migration of Labor.”
344
Chapter 10
Worker Mobility: Migration, Immigration, and Turnover
country to reunite with their adult children. If these immigrants do not work, and
if they are dependent on their children or on American taxpayers for their
consumption, then clearly the overall per capita disposable income among
natives must fall. (This decline, of course, could well be offset by the increased
utility of the reunited families, in which case it would be a price the host country
might be willing to pay.)
If immigrants work after their arrival, our profit-maximizing models of
employer behavior suggest that they will be paid no more than the value of their
marginal revenue product. Thus, if they rely only on their own earnings to finance
their consumption, immigrants who work do not reduce the per capita disposable
income of natives in the host country. Moreover, if immigrant earnings are not
equal to the full value of the output they add to the host country, then the total
disposable income of natives will increase.
Immigrants, Taxes, and Public Subsidies Most host countries (including the
United States) have government programs that may distribute benefits to immigrants. If the taxes paid by immigrants are sufficient to cover the benefits they
receive from such programs, then the presence of these immigrants does not
threaten the per capita disposable income of natives. Indeed, some government
programs, such as national defense, are true “public goods” (whose costs are not
increased by immigration), and any taxes paid by immigrants help natives defray
the expenses of these programs. However, if immigrants are relatively high users
of government support services, and if the taxes they pay do not cover the value
of their benefits, then it is possible that the “fiscal burden” of immigration could
be large enough to reduce the aggregate income of natives.
Studies of the net fiscal effects of recent authorized immigration suggest that
these effects—measured both immediately and over the lifetimes of the immigrants
and their descendants—are apparently small. That is, authorized immigrants and
their descendants typically pay about the same in taxes as they receive in government benefits; moreover, a recent study suggests that immigrants may even be less
likely to put a burden on their host communities than the native-born.26 But what
can be said about the likely fiscal effects of unauthorized immigration?
Overall Effects of Unauthorized Immigration Undocumented immigration has
been the major focus in recent years of the immigration policy debate in the
United States. It is widely asserted that these generally low-skilled workers are
the beneficiaries of many government services, and that their undocumented status both allows them to escape taxation and is probably associated with a relatively high propensity to commit crimes. There are good reasons to doubt all three
assertions; in fact, unauthorized immigration may be more likely to increase native
incomes than officially sanctioned immigration!
26
Una Okonkwo Osili and Jia Xie, “Do Immigrants and Their Children Free Ride More Than Natives?”
American Economic Review: Papers and Proceedings 99 (May 2009): 28–34.
Geographic Mobility
345
EXAMPLE 10.4
Illegal Immigrants, Personal Discount Rates, and Crime
Immigrants to the United States, including those
here illegally, are far less likely than the native-born
to commit the kinds of violent or property crimes
for which incarceration is the punishment. In
2000, for example, 3.4 percent of native-born
Americans were institutionalized, with most of
those in prison (the rest were in mental hospitals,
drug treatment centers, or long-term-care facilities). In contrast, among immigrants, the rate of
institutionalization was roughly one-fifth as high (at
0.7 percent). Among those with less than a high
school education, a group in which crime rates are
higher than average, the gap in the percentage
institutionalized between the native-born and
immigrants was even larger: 11 percent for the
native-born, compared to 1 percent for immigrants.
While there could be several factors affecting
the differential rates of incarceration, one reason
for the difference may be rooted in a characteristic
that human-capital theory implies that immigrants
will possess: a lower-than-average personal discount rate. Immigrants, whether legal or illegal, are
self-selected individuals who are willing to bear
considerable costs to enter and adapt to a new
country with the expectation of benefits that may
lie well into the future. Among a group of people
facing the same current costs and future benefits,
then, those most willing to leave their country of
origin and emigrate to a new one are those with
relatively low discount rates (that is, they are the
most future-oriented).
People who commit crimes tend to be presentoriented; in economic terms, they have relatively
high discount rates. For criminals, the perceived
gains from their criminal act are in the present,
while the costs—if caught—are in the future. With
high discount rates, these future costs look relatively small compared to the current gains. Therefore, economic theory suggests that immigrants
and criminals are likely to have very different orientations toward the future.
Within the general populace of any country, there
will be a wide distribution of discount rates, and
some of those who have high discount rates may
turn to crime. However, immigrants are self-selected
individuals who tend to have relatively low personal
rates of discount, and therefore, it is not surprising
that criminality among immigrants is so low.
For data on immigrants and incarceration, see Kristin F.
Butcher and Anne Morrison Piehl, “Why Are Immigrants’
Incarceration Rates So Low? Evidence on Selective Immigration, Deterrence, and Deportation,” National Bureau
of Economic Research, working paper no. 13229 (July
2007).
First, undocumented immigrants come mainly to work.27 Therefore, they
clearly add to the production of domestic goods and services. Second, while
unauthorized immigrants do receive emergency-room treatment and their children do get schooling, they are ineligible for most government programs (welfare,
food stamps, Social Security, unemployment insurance) that transfer resources
to low-income citizens. Moreover, as Example 10.4 discusses, poorly educated
immigrants—most of whom will be undocumented—are much less likely to be
incarcerated than similarly educated natives!
27
Attempted illegal immigration from Mexico is estimated to be extremely sensitive to changes in Mexico’s real wage rate; see Gordon Hanson and Antonio Spilimbergo, “Illegal Immigration, Border
Enforcement, and Relative Wages: Evidence from Apprehensions at the U.S.–Mexico Border,”
American Economic Review 89 (December 1999): 1337–1357.
346
Chapter 10
Worker Mobility: Migration, Immigration, and Turnover
Third, despite their wish to hide from the government, unauthorized immigrants cannot avoid paying most taxes (especially payroll, sales, and property
taxes); indeed, one study indicated that 75 percent of undocumented immigrants
had income taxes withheld but that relatively few filed for a refund.28 Additionally, since immigration reform legislation was passed in 1986, the typical way that
undocumented immigrants qualify for jobs in the United States is to purchase a
fake Social Security card. Employers then deduct payroll taxes and remit them to
the government, and starting in the mid-1980s, the revenues that cannot be
matched to a valid Social Security number (and therefore will not result in a
future retirement payment) have risen dramatically—probably because of unauthorized immigration.29
Thus, we cannot rule out the possibility that despite governmental efforts to
prohibit it, the “transaction” of unauthorized immigration is—to use the normative terminology of chapter 1—Pareto-improving. The immigrants themselves
clearly gain (otherwise they would go back home), and the size of the gains experienced by Mexican immigrants relative to their incomes in Mexico suggest that
these gains are large. Some natives clearly gain, while others may lose, but we
have just seen that it is quite likely that the aggregate gain to natives is positive.
Thus, economic theory suggests that, with an overall gain to society, a critical part
of the policy debate on unauthorized immigration should focus on programs or
policies that would tax the likely gainers in order to compensate those most likely to lose
from such immigration. We will return in chapter 16 to the issue of how best to compensate those who lose from policies that benefit society in general.
Employee Turnover
While this chapter has focused so far on the underlying causes and consequences of
geographic mobility, it is important to remember that the mobility of employees
among employers (also known as “turnover” or “separations”) can take place
without a change of residence. We noted in chapter 5 that employees generally find
it costly to search for alternative job offers, and in this section, we use the principles
of our human-capital model to highlight certain patterns in employee turnover.
Growing from our discussions in chapters 8 and 9, we would expect that
individuals differ in their personal discount rates and in the psychic costs they
attach to quitting one employer to find another. These differences imply that some
workers are much more likely than others to move among employers, even if
those in both groups face the same set of wage offers. Indeed, one study found
28
Gregory DeFreitas, Inequality at Work: Hispanics in the U.S. Labor Force (New York: Oxford University
Press, 1991): 228. The same study showed minimal use of public services by illegal immigrants.
29
See Office of the Inspector General, Social Security Administration. “Recent Efforts to Reduce the Size
and Growth of the Social Security Administration’s Earnings Suspense File,” 16–18, May 2002; http://
www.ssa.gov/oig/ADOBEPDF/A-03-01-30035.pdf.
Employee Turnover
347
that almost half of all turnover over a three-year period involved the 13 percent of
workers who had three or more separations during the period.30 Despite individual idiosyncrasies, however, there are clearly systematic factors that influence the
patterns of job mobility.
Wage Effects
Human-capital theory predicts that, other things equal, a given worker will have a
greater probability of quitting a low-wage job than a higher-paying one. That is,
workers employed at lower wages than they could obtain elsewhere are the most
likely to quit. Indeed, a very strong and consistent finding in virtually all studies
of worker quit behavior is that, holding worker characteristics constant, employees in industries with lower wages have higher quit rates. At the level of individual workers, research indicates that those who change employers have more to
gain from a job change than those who stay and that, indeed, their wage growth
after changing is faster than it would have been had they stayed.31
Effects of Employer Size
From Table 10.3, it can be seen that quit rates tend to decline as firm size increases.
One explanation for this phenomenon is that large firms offer more possibilities
for transfers and promotions. Another, however, builds on the fact that large firms
generally pay higher wages.32 This explanation asserts that large firms tend to
have highly mechanized production processes, where the output of one work
team is highly dependent on that of production groups preceding it in the production chain. Larger firms, it is argued, have greater needs for dependable and
steady workers because employees who shirk their duties can impose great costs
on a highly interdependent production process. Large firms, then, establish
“internal labor markets” for the reasons suggested in chapter 5; that is, they hire
workers at entry-level jobs and carefully observe such hard-to-screen attributes as
reliability, motivation, and attention to detail. Once having invested time and
effort in selecting the best workers for its operation, a large firm finds it costly for
such workers to quit. Thus, large firms pay high wages to reduce the probability
30
Patricia M. Anderson and Bruce D. Meyer, “The Extent and Consequences of Job Turnover,”
Brookings Papers on Economic Activity: Microeconomics (1994): 177–248.
31
Donald O. Parsons, “Models of Labor Market Turnover: A Theoretical and Empirical Survey,” in
Research in Labor Economics, vol. 1, ed. Ronald Ehrenberg (Greenwich, Conn.: JAI Press, 1977): 185–223;
Michael G. Abbott and Charles M. Beach, “Wage Changes and Job Changes of Canadian Women: Evidence from the 1986–87 Labour Market Activity Survey,” Journal of Human Resources 29 (Spring 1994):
429–460; Christopher J. Flinn, “Wages and Job Mobility of Young Workers,” Journal of Political Economy
94, no. 3, pt. 2 (June 1986): S88–S110; and Monica Galizzi and Kevin Lang, “Relative Wages, Wage
Growth, and Quit Behavior,” Journal of Labor Economics 16 (April 1998): 367–391.
32
Walter Oi, “The Fixed Employment Costs of Specialized Labor,” in The Measurement of Labor Cost, ed.
Jack E. Triplett (Chicago: University of Chicago Press, 1983).