Lecture Marketing research (12th edition) - Chapter 19: Correlation analysis and regression analysis
Bạn đang xem bản rút gọn của tài liệu. Xem và tải ngay bản đầy đủ của tài liệu tại đây (659.55 KB, 33 trang )
1
Marketing Research
Aaker, Kumar,
Leone and Day
Twelfth Edition
Instructor’s
2
Chapter Nineteen
Correlation Analysis and
Regression Analysis
/
Marketing Research 12th Edition
3
Definitions
•
Correlation analysis
▫ Measures strength of the
relationship between two
variables
•
Correlation coefficient
▫ Provides a measure of the degree
to which there is an association
between two variables (X and Y)
/
Marketing Research 12th Edition
4
Regression Analysis
•
•
•
•
/
Statistical technique that is used to relate two or more
variables
Objective is to build a regression model or a prediction
equation relating the dependent variable to one or
more independent variables
The model can then be used to describe, predict, and
control the variable of interest on the basis of the
independent variables
Multiple regression analysis Regression analysis that
involves more than one independent variable
Marketing Research 12th Edition
5
Correlation Analysis
•
Pearson correlation coefficient
▫ Measures the degree to which there is a linear association
between two intervalscaled variables
▫ A positive correlation reflects a tendency for a high value in
one variable to be associated with a high value in the second
▫ A negative correlation reflects an association between a high
value in one variable and a low value in the second variable
/
Marketing Research 12th Edition
6
Correlation Analysis (Contd.)
•
•
Population correlation (p) If the database includes
an entire population
Sample correlation (r) If measure is based on a
sample
R lies between 1 < r < + 1
R = 0 > absence of linear association
/
Marketing Research 12th Edition
7
Scatter Plots
/
Marketing Research 12th Edition
8
Scatter Plots (Contd.)
/
Marketing Research 12th Edition
9
Correlation Coefficient
Simple Correlation Coefficient
Cov( x, y )
(Xi
X ) * (Yi
Y)
Pearson Product-moment Correlation Coefficient
rxy
1
(n
1)
rxy
/
*
Xi
X
Sx
*
(Yi
Y)
Sy
Cov xy
Sx * S y
Marketing Research 12th Edition
10
Determining Sample Correlation Coefficient
/
Marketing Research 12th Edition
11
Testing the Significance of the
Correlation Coefficient
•
Null hypothesis:
Ho : p = 0
•
Alternative hypothesis: Ha : p ≠ 0
•
Test statistic
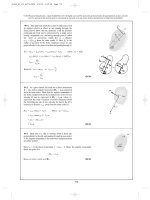
Example: n = 6 and r = .70
At = .05 , n2 = 4 degrees of freedom,
Critical value of t = 2.78
Since 1.96<2.78, we fail to reject the null
hypothesis.
/
t
.70
6
2
1 0.70
2
1.96
Marketing Research 12th Edition
12
Partial Correlation Coefficient
§
Measure of association between two variables after controlling for the
effects of one or more additional variables
rXY , Z
/
rXY
2
XZ
rXZ * rYZ
2
YZ
(1 r ) * (1 r )
Marketing Research 12th Edition
13
Regression Analysis
Simple Linear Regression Model
Yi = βo + β1xi + εi
Where
▫
Y = Dependent variable
▫
X =Independent variable
▫
β o = Model parameter that represents mean value of dependent variable (Y) when
the independent variable (X) is zero
▫
β1 = Model parameter that represents the slope that measures change in mean
value of dependent variable associated with a oneunit increase in the independent
variable
▫ εi = Error term that describes the effects on Yi of all factors other than value of Xi
/
Marketing Research 12th Edition
14
Simple Linear Regression Model
/
Marketing Research 12th Edition
15
Simple Linear Regression Model –
A Graphical Illustration
/
Marketing Research 12th Edition
16
Assumptions of the Simple
Linear Regression Model
•
Error term is normally distributed (normality assumption)
•
Mean of error term is zero [E(εi) = 0)
•
/
Variance of error term is a constant and is independent of the values of
X (constant variance assumption)
•
Error terms are independent of each other (independent assumption)
•
Values of the independent variable X are fixed (nonstochastic X)
Marketing Research 12th Edition
17
Estimating the Model Parameters
•
•
•
Calculate point estimate bo and b1 of unknown parameter βo and β1
Obtain random sample and use this information from sample to estimate βo
and β1
Obtain a line of best "fit" for sample data points least squares line
Predicted value of Yi ,
Whe
re
/
Marketing Research 12th Edition
18
Residual Value
•
Difference between the actual and predicted values
•
Estimate of the error in the population
ei = yi yi
= yi (bo + b1 xi)
•
/
bo and b1 minimize the residual or error sum of squares (SSE)
SSE = ei2 = ( (yi yi)2
= Σ [yi(bo + b1xi)]2
Marketing Research 12th Edition
19
Standard Error
/
•
Mean Square Error
•
Standard Error of b1
•
Standard Error of b0
Marketing Research 12th Edition
20
Testing the Significance of Independent Variables
•
Null Hypothesis
▫ There is no linear relationship between the independent &
dependent variables
H0: β 1 = 0
•
Alternative Hypothesis
▫ There is a linear relationship between the independent &
dependent variables
Ha: β 1 ≠ 0
/
Marketing Research 12th Edition
21
Testing the Significance of Independent Variables
(Contd.)
•
Test Statistic
•
Degrees of Freedom V = n – 2
•
•
t = b1 β1
sb1
Testing for a Type II Error
Ho: β1 = 0
Ha: β1 ≠ 0
Decision Rule
Reject ho: β1 = 0 if α > p value
/
Marketing Research 12th Edition
22
Sum of Squares
SST
Sum of squared prediction error that would be
obtained if we do not use x to predict y
SSE
Sum of squared prediction error that is obtained
when we use x to predict y
SSM
/
Reduction in sum of squared prediction error that
has been accomplished using x in predicting y
Marketing Research 12th Edition
23
Predicting the Dependent Variable
•
•
•
Dependent variable, yi = bo + bixi
Error of prediction is yi – y
Total variation (SST)
= Explained variation (SSM) + Unexplained variation (SSE)
( Ψι − Ψ) 2 =
+
( Ψι
( Ψι − Ψ) 2
Ψι) 2
Coefficient of Determination (r2)
•
Measure of regression model's ability to predict
r2 = (SST SSE) / SST
= SSM / SST
= Explained Variation / Total Variation
/
Marketing Research 12th Edition
24
Multiple Regression
•
•
A linear combination of predictor factors is used to predict the
outcome or response factors
The general form of the multiple regression model is explained as:
where
β1 , β2, . . . , βk are regression coefficients associated with the
independent variables X1, X2, . . . , Xk and
ε is the error or residual.
/
Marketing Research 12th Edition
25
Multiple Regression (Contd.)
•
The prediction equation in multiple regression
analysis is
Ŷ = α + b1X1 + b2X2 + …….+bkXk
where
Ŷ is the predicted Y score and
b1 . . . , bk are the partial regression coefficients.
/
Marketing Research 12th Edition