Ecg arrhythmia recognition improvement using respiration information
Bạn đang xem bản rút gọn của tài liệu. Xem và tải ngay bản đầy đủ của tài liệu tại đây (506.82 KB, 12 trang )
Vietnam Journal of Science and Technology 56 (3) (2018) 335-346
DOI: 10.15625/2525-2518/56/3/10779
ECG ARRHYTHMIA RECOGNITION IMPROVEMENT USING
RESPIRATION INFORMATION
Tran Hoai Linh
School of Electrical Engineering, HUST, 1 Dai Co Viet, Ha Noi
Email:
Received: 2 October 2017; Accepted for publication: 18 April 2018
Abstract. Electrocardiogram (ECG) and respiration signals are two basic but important
biomedical signals. They provide good source of information used to determine the patient’s
conditions, where the earlier is more popular. The difficulty is the ECG signals are usually of
small amplitude and are susceptible to various noises such as: the 50 Hz grid noise, poor
electrodes’ contacts with the patient's skin, the patient’s emotional variations, the respiration and
movements (including the breathing movements) of the patient, etc. In this paper we propose
two ways to improve the accuracy of ECG signal recognition by filtering out the effect of the
respiration in the ECG signal and by using the information of breathing stage as features in ECG
signal classification. These approaches can improve the reliability and accuracy of the
arrhythmia classification. As the classifier we use the modified neuro-fuzzy TSK network. The
proposed solution will be tested with data from the MIT-BIH and the MGH/MF databases.
Keywords: ECG signal recognition, arrhythmia recognition, respiration, neurofuzzy network,
intelligent classifier.
Classification numbers: 4.2.3; 4.7.3; 4.7.4.
1. INTRODUCTION
Despite the rapid development of medical technologies, the electrocardiogram (ECG)
remains one of the main tool used by the doctors to detect the health conditions of the patients.
The ECG signal is still collected by measuring the voltage difference between two electrodes
attached to the patient [1]. Since there is still no perfect ECG signal analysis and classification
algorithm, actually there are many research actively being performed to increase as high as
possible the accuracy and the reliability of the results. One of the sources of difficulty in
classifying ECG signals is the influence of the patient’s movements, among which there are the
unavoidable respiration movements.
When the patient breathes, the relative positions of the electrodes vary and also the
contacting impedance between the electrodes and the skins change to affect the quality of the
ECG signal registered [2, 3, 4, 5, 6]. At the same time, it’s known that during inhaling period,
the heart rate accelerates and during the exhaling period, the heart rate slows down. These
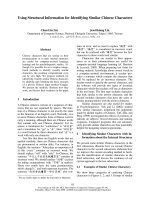
factors (and not only) lead to changes in the ECG signal [7]. An ECG signal, as the
Tran Hoai Linh
superposition of a number of electrical events in the heart, consists of characteristic points as
shown in Fig. 1.
Figure 1. Example of ECG signal and its characteristic points.
The respiration is a vital activity of living. Performed in the lung’s cells, it provides oxygen
for the blood and withdraws back the carbon dioxide. Studies such as in [5, 6] have shown that
respiratory activities lead to electrocardiographic signal changes.
(a)
(b)
(c)
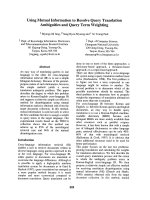
Figure 2. Examples of ECG signals affected by: a) sinus arrhythmia with R-R intervals changed,
b) amplitude modulated, and c) baseline drift.
The respiration activity may affect the ECG signal and cause the so called sinus
arrhythmias, amplitude modulation and baseline drift.
•
336
Sinus arrhythmias: Sinus arrhythmia is a phenomenon in which the RR interval of an
ECG signal is altered by the rhythm, i.e. during inhaling period, the heart rate
Ecg Arrhythmia Recognition Improvement using Respiration Information
accelerates and during the exhaling period, the heart rate slows down as shown in
Figure 2a.
Many research use this RR interval as one of the important features for ECG
classification [4], so changing the RR cycle will adversely affect the quality of the
ECG signal classification.
•
Amplitude modulation effect: Because during the breathing process, the volume of the
thoracic cavity changes, resulting in changes in the thoracic impedance [5] and
changing the angle of the cardiac vector compared to the reference vector, this makes
the amplitude of the R peak modulated according to the rhythm [6] as shown in Figure
2b.
Since the peak amplitude is also an important feature [9], then the modulation of the R
peak of the ECG signal also affects the results of classification.
•
The baseline drift: The breathing process moves the skin resulting in a change of
contact impedance between the electrodes and the skin surface, which causes a
baseline drift in the ECG signal [2] is illustrated in Fig. 2c.
From the above analysis, the effect of breathing on the ECG signal is indirect and nonlinear
[7] and leads to the quality decrease in ECG signal classification. The purpose of the paper is to
propose a solution to reduce those effects.
The quality of the classification can be evaluated on the basis of following factors: the
number of misclassification cases, number of false-negative cases, number of false positives.
The model is considered to be better when the errors are small, in which the most important is
the FN index since this is the case that can have the worst impact on the patient.
2. METHODS FOR REDUCTION OF THE EFFECTS OF BREATHING IN THE
ECG SIGNALS
2.1. A short review of methods for breathing effects reduction for ECG signals
There has been a number of studies suggesting to remove respiratory effects in ECG signals
[7, 8, 10]. It can be a simple task of counting the respiration rate for apnea checking of the
patients like in [11], where an accelerometer was used to count the number of breaths
simultaneously with the ECG measuring process.
Various research has proposed a filter application to eliminate the effect of breathing on
ECG signals. Classical methods include high-pass filtering because the breathing frequency
varies in the range of 0.05 Hz to 1 Hz. Alste proposed in [12] the use of a 255th order Kaiser
high-pass filter at cutoff frequency 0.8 Hz. In [13] the authors proposed using the FIR filter
(Finite Impulse Response) and the IIR (Infinite Impulse Response) with cutoff frequency of 0.5
Hz. Test results for FIR Kaiser, Hanning, Hamming, Blackman filters and 2nd order Butterworth
IIR filters showed that the second-order Butterworth filter has a lowest PRD (Percentage Root
Mean Squared Difference) of the signals before and after removing the effect (32.77 %).
Not only the static filters, adaptive filters are also proposed by various authors as the Least
Mean Squares (LMS) adaptive algorithm in [14]; Kalman adaptive filter in [15] or a
combination of FIR filter with LMS adaptive algorithm as in [10] to eliminate the effects of
respiration in the ECG signal. However, the method of adaptive filtering has the disadvantage of
337
Tran Hoai Linh
requiring a real respiration signal or an ECG signal for reference to update the filter coefficients,
resulting in a high calculation efforts.
In [16, 17], it is proposed to use the Principal Component Analysis (PCA) method. In [17]
PCA was used to determine the rhythm in the ECG signal characteristic such as QRS complex, P
wave or T wave by finding the direction with the highest variance. To overcome this hypothesis,
in [16] a generalized case of PCA, the so-called kPCA (Kernel PCA) method was used.
Experimental results on the Fantasia Database show that the effect of kPCA removal is better
than PCA. The disadvantage of PCA method is the number of Principle components is dynamic
and unknown in advance for each clients.
In [18] the Short-Time Fourier Transform (STFT) was proposed to estimate the heart signal
to be extracted. This method has the disadvantage of having to choose the size of the window
length in accordance with the ECG signal. The STFT was also used in [19], in which the work
evaluated of the recognition algorithms for the supraventricular ectopic beat (SVEB), ventricular
ectopic beat (VEB), atrial fibrillation (AF), and ventricular fibrillation (VF). Fast Fourier
transform (FFT) and an MLP (Multilayer Perceptron) were selected for the detection algorithms.
The results showed that the proposed integrated algorithm can achieve good accuracy in
comparison with other previous studies.
In [20] it proposed the Modulation Morphological Filtering (MMF) to eliminate respiratory
effects in the ECG signal, but it also affects the characteristics of the ECG signal.
In [21], the authors used the Empirical Mode Decomposition (EMD) method to decompose
the ECG signals into a number of IMFs (Intrinsic Mode Functions). Experimental results in the
MIT-BIH database and in the actual patient showed that the EMD method has little effects only
on the ECG characteristic features. The EMD method was also used in [22] in combination with
the discrete wavelet transform (DWT) to detect R-peaks and QRS complex. The Probabilistic
neural network (PNN) and radial basis function neural network (RBF-NN) were used to
recognize the arrhythmia beats. The solution achieved 99.7 % accuracy in detecting the QRS
complex.
The article [23] proposed the so called maximum margin clustering method with immune
evolution (IEMMC) to classify the features vector extracted from the QRS complexes. The
authors also used the wavelet transform for R peak detection. Compared with K-means and
iterSVR algorithms, the IEMMC algorithm showed better performance in classification.
The features vector may be more sophisticated in preparing, such as in [8], where the
feature vectors of an ECG signal consisted of both linear and nonlinear features were used to
improve the classification of ECG data containing five types of arrhythmias: non-ectopic beats
(N), supra-ventricular ectopic beats (S), ventricular ectopic beats (V), fusion beats (F) and
unclassifiable and paced beats (U). As nonlinear features, the authors proposed high order
statistics and cumulants, as linear features, the principal component analysis of discrete wavelet
transform coefficients was used. The method was able to classify the N, S, V, F and U
arrhythmia classes with high accuracy (98.91 %) using a combined support vector machine and
radial basis function neural network.
Most of the methods analyze and classify the ECG signal beat-by-beat, but in [24], the
authors proposed a method to recognize segments of ECG signal containing a number of
heartbeats. The method used the temporal features (i.e., the dynamics) from ECG patterns. As
the classifier, an RBF neural network was trained and tested with the accuracy about 90 %.
2.2. The proposed solutions
338
Ecg Arrhythmia Recognition Improvement using Respiration Information
As shown in studies, the effect of respiration in ECG signals in terms of signal is nonlinear
[6] with frequency spectrum in the range of [0.05 ÷ 1] Hz. Wavelet analysis is a common
method for analyzing dynamic signals such as ECG signals. As mentioned above, many studies
have proposed wavelet transform to eliminate the effects of general noise and breathing in
particular in ECG signals with different wavelet family and levels. In this paper, we will re-test
them with the concentration on the frequency range given above to select the configuration
which give the highest improvement to the results. For databases when there are also the record
of the patient respiration process, we extract from the record 2 features to include into the inputs
of the classifier: the instantaneous amplitude of the respiration signal and the average of 10 last
durations of peak-to-peak period from the respirational signal. These recommendations are
intended to address the effect of arrhythmia, as these effects can not be overcome by the wavelet
filter. The instantaneous amplitude of the respiration signal will help determine whether the R-R
spacing (used in ECG identification) is altered by breathing or by pathology. Similarly, the
average pulse of the last 10 spikes also provides information about the patient's movement
status, thereby adjusting the conclusions of the ECG signal. The ideas of using more than one
biomedical signals to support the analysis of ECG signal was already considered, for example
the research in [25] proposes a multimodal data association method that used also features
extracted from blood pressure (BP) and electroencephalogram (EEG) to support the ECG signal
classification when the signals are strongly noised. The proposed method got an overall score
(on the testing set) better than the typical method using QRS detector and BP detector from
PhysioNet. But the use of respiration signal as in this paper is novel.
For comparison, we will compare the performance of ECG signal classification in 3
scenarios:
1.
The base case, we use the results from [9], where the ECG signal is characterized by a
vector of 18 features: 16 coefficients when decomposing the QRS complex of the
given rhythm into the first 16 Hermite functions, the last R-R durations and the
average of 10 last R-R durations.
2.
The 2nd case: the same ECG signals as in the base case are filtered using the wavelet
based filters. After that, the same algorithm of features vector generation is used (with
18 components) and also a new TSK network is trained for recognizing those new
features vectors.
3.
The 3rd case: when the respiration process is also recorded, the feature vectors contain
20 components: the 18 components as above and 2 more features: the instantaneous
amplitude of the respiration signal and the average of 10 last durations of peak-to-peak
period from the respirational signal. Again a TSK network will be trained to recognize
the feature vectors to classify the actual beat. The numerical results will show that 2nd
and 3rd cases will have better results than the base case.
As the nonlinear classifier, the modified TSK neurofuzzy network as in Fig. 3 is proposed.
This network has a modified membership function defined as:
i (x)
1
x ci
1
i
2bi
(1)
which helps to reduce the number of nonlinear parameters almost 3 times [26].
339
Tran Hoai Linh
Figure 3. The structure of a modified TSK network.
The network is trained by a hybrid gradient-based algorithm [26] to process these feature
vectors to make the classification.
3. THE TRAINING AND TESTING DATA SETS
To test the proposed solution, we use two databases: the first is the MIT-BIH database with
ECG signals only and the later is the MGH/MF database with both ECG and respiration signals
measured at them same time.
The database of MIT-BIH arrhythmias [27] was created at the Boston's Beth Israel
Hospital from 1975 to 1979. It consisted of 48 records collected from 47 participants, including
25 men aged 32 to 89 and 22 women aged 23 to 89 (records 201 and 202 were collected from
the same person). All records were digitized at 360 Hz and each record has at least two
independent cardiologists marking the specimens, marked at the R-peak of each heartbeat.
With the MIT-BIH database, this paper uses 16 records (16 patients) with 7 different
rhythm types: Normal sinus rhythm (denoted as type N), left bundle branch block (type L), Right
Bundle Branch Block Beat (type R), Premature Atrial Contractions (type A), Premature
Ventricular Contraction (type V), Ventricular flutter wave (type I) and Ventricular escape beat
(type E). We extracted totally 3577 QRS samples, which we further randomly divided two sets:
2385 samples (about 2/3) of 16 patients for learning, the remaining 1192 samples are used for
testing. The total number and the number of sample pieces taken from the records and divided
into the dataset and the test are shown in Table 1a. The ratio between number of samples used
for training and testing was chosen within the range used by other authors, varying from 50 % 50 % to 80 % - 20 %. Since there is no recommended ratio, the more important thing is we
should use the same data sets to make the comparison between methods more reliable. On the
other side, since the range of the output signal from a TSK network is not limited by 1 as the
sigmoid neurons, therefore we decided to encode the desired corresponding output for the ECG
signals in the following simple way: the N-type rhythms had the output equal 1, the L-type
rhythms had the output equal 2, etc. and the E-type rhythms had the output equal 6.
The MGH/MF database [27] includes not only the ECG signals but also the respiratory and
blood pressure of the patient. It consists of 250 records from 250 patients at Massachusetts
340
Ecg Arrhythmia Recognition Improvement using Respiration Information
General Hospital. In this database, the most popular rhythms are of the normal sinus type, the
Premature Ventricular Contraction (type V), and the supraventricular premature beat (denoted as
type S). We have extracted from 20 records a total 4500 samples. Details of the number of
samples taken from the records are summarized in Table 2. The procedures for generating
feature vectors and the output vectors are similar to that of the MIT-BIH database. For the
outputs, we used the similar encoding method as above: the N-type rhythms had the output equal
1, the V-type rhythms had the output equal 2, and the S-type rhythms had the output equal 3.
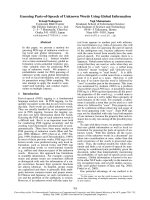
V: Premature ventricular contraction
S:Supraventricular premature beat
Figure 4. Example of QRS segments for S and V arrhythmia types.
Figure 4 shows the examples of QRS segments for both V and S arrhythmias. It can be seen
that in pathological cases, the ECG signal in general and the QRS segment in particular has
signal variations strong in both amplitude and shape. In Fig. 5, there are some example segments
of the ECG signals along with the respiration signal measured simultaneously from the
MGH/MF database. The segments also show the effect of R-R variation and the modulation of
the R peak amplitudes.
(a)
(b)
Figure 5. Examples (from the MGH/MF database) of ECG signals and their corresponding patient
respiration signal: a) sinus arrhythmia with R-R intervals changed, b) amplitude modulated.
341
Tran Hoai Linh
Table 1. Detail numbers of rhythm types selected from the MIT-BIH and MGH/MF databases.
Rhythm type
Total number
Learning samples
Testing samples
N
1000
667
333
L
500
333
167
R
500
333
167
A
500
334
166
V
500
333
167
I
472
315
157
E
105
70
35
Total
3577
2385
1192
Table 2. Detail numbers of rhythm types selected from the MGH/MH database.
Rhythm type
Total number
Learning samples
Testing samples
N
2700
1800
900
S
675
450
225
V
1125
750
375
Total
4500
3000
1500
4. NUMERICAL RESULTS
This section will present the ECG signal classifications results of trials in different 5
scenarios:
•
Test No. 1: Classifying the ECG signals from MIT-BIH without using wavelet filtering
(and no respiration signals were available)
•
Test No. 2: Classifying the ECG signals from MIT-BIH with wavelet filtering (and no
respiration signals were available)
•
Test No. 3: Classifying the ECG signals from MGH/MH without using wavelet
filtering and no respiration signals were used.
•
Test No. 4: Classifying the ECG signals from MGH/MH with wavelet filtering (no
respiration signals were used).
•
Test No. 5: Classifying the ECG signals from MGH/MH with wavelet filtering and
with the using respiration signal.
By trial-and-error method, it’s found out that the Coiflet level 4 has the best performance
on our datasets. And with the frequency range around 0.5 Hz, the 360 Hz sampling frequency of
the ECG signals, the A8 component is removed as the wavelet filtering procedure.
As the classifying model for all scenarios, this paper uses the TSK neurofuzzy network
[26]. The reliability of the identification model is assessed on the basis of the 4 measures
mentioned in Section I.
342
Ecg Arrhythmia Recognition Improvement using Respiration Information
4.1. Results for tests with data from MIT-BIH
The TSK network is built with 18 inputs corresponding to 18 components of the feature
vectors, 7 binary outputs corresponding to 7 types of N, A, E, L, R, I and V. The number of
fuzzy inference rules was tried from 1 to 20, and the results show that for the 17 rules the lowest
testing results were achieved. To facilitate the calculation of test errors, the number of FN cases,
FP cases, statistic parameters,..., we constructed the confusion matrix as shown in Tables 3 and 4
in which, columns are destinations and rows are network outputs. The main diagonal of the
matrix represents the correct classifications, other positions are the errors.
Table 3. Testing results for test No. 1.
N
A
E
I
L
R
V
N
324
12
1
0
0
0
2
A
8
151
0
0
1
1
1
E
0
0
34
0
0
0
0
I
0
0
0
156
0
0
2
L
0
0
0
0
165
0
1
R
1
3
0
0
1
166
0
V
0
0
0
1
0
0
161
Total
333
166
35
157
167
167
167
Table 4. Testing results for test No. 2.
N
A
E
I
L
R
V
N
325
8
1
0
0
0
1
A
6
156
0
0
1
3
0
E
0
0
33
1
0
0
0
I
1
0
1
155
0
0
2
L
0
0
0
1
166
0
1
R
1
1
0
0
0
164
1
V
0
1
0
0
0
0
162
Total
333
166
35
157
167
167
167
Table 5. Performance comparison between tests No. 1 and 2.
Test No. 1
Test No. 2
Testing total error
35
31
FN
15
10
FP
9
8
343
Tran Hoai Linh
The tests showed that, when applying a wavelet filtering process (removing the A8
component in Coiflet wavelet decomposition), the performance of the TSK classifier was
improved. The total testing error was reduced from 35 to 31, and especially the FN cases was
reduced from 15 to 10.
4.2. Results for tests with data from MGH/MF
These tests use a set of 20 records to build a set of data and test data sets for the
identification model. Because the MGH/MF database contains breath measurements
simultaneously with the ECG signal. Similar to experiments with the MIT-BIH database to
facilitate the calculation of test errors, FN cases, FP cases, etc.
From the output of the TSK network we summarize the results of Tests 3, 4 and 5 as shown
in Table 6.
Table 6. Performance comparison between tests No. 3, 4 and 5.
Test No. 3
Test No. 4
Test No. 5
Testing total error
62
55
51
FN
30
26
23
FP
16
14
11
The tests showed that, when applying a wavelet filtering process (test No. 4) the
performance of the classifier was improved, and when using both solutions, the achievement is
further improved. The total testing error was reduced from 62 to 51, and especially the FN cases
was reduced from 30 to 23.
5. CONCLUSIONS
The paper presented the two approaches to improve the quality of the ECG arrhythmia
classification, which are the wavelet filtering the frequency range from 0.05 to 1 Hz and the use
of 2 features based on the respiration signals. The numerical results have shown that each
approach helps to improve the classification results not only in reducing the total error but also
in important measures such as False Negative cases and Sensitivities.
The method can be further explored with new features from the respiration signals.
REFERENCES
1.
Einthoven W. - Weiteres Über das Elektrokardiogram, Pflüger Arch. ges. Physiol. 122
(1908) 517-548.
2.
Fasano A. and Villani V. - Baseline Wander Removal in ECG and AHA
Recommendations, Computing in Cardiology Conference (CinC), Spain (2013) 11711174.
3.
Frey A. W., Hagenmiller C., Baumert J. and Grueneis F. - The Respiratory Sinus
Arrhythmia as A Function of Breathing Frequency Revisited, Computers in Cardiology,
USA (1994) 41 – 44.
344
Ecg Arrhythmia Recognition Improvement using Respiration Information
4.
Fumihiko Yasuma and Jun-ichiro Hayano - Why Does the Heartbeat Synchronize With
Respiratory Rhythm?, CHEST Journal 125 (2004) 683-690.
5.
Hahn G., Sipinkova I., Baischt F. and Helliget. G. - Changes in the Thoracic Impedance
Distribution Under Different Ventilatory Conditions, Physiological Measurement 16 (3A)
A161-173.
6.
Pallas-Areny R., Colominas-Balague J., Rosell F. J. - The Effect of Respiration-Induced
Heart Movements on the ECG, IEEE Transactions on Biomedical Engineering 36 (6)
(1989) 585-590.
7.
Krasnikov G. V., Miglena Y. Tyurina, Arina V. Tankanag, Galina M. Piskunova
and Nikolai K. Chemeris - Analysis of Heart Rate Variability and Skin Blood Flow
Oscillations Under Deep Controlled Breathing, Respiratory Physiology & Neurobiology
185 (2013) 562– 570.
8.
Elhaj F. A., Naomie Salim, Arief R. Harris, Tan Tian Swee, Taqwa Ahmed - Arrhythmia
recognition and classification using combined linear and nonlinear features of ECG
signals, Computer Methods and Programs in Biomedicine 127 (2016) 52-63.
9.
Linh T. H., Stanislaw Osowski and Maciej Stodolski - On-Line Heart Beat Recognition
Using Hermite Polynomials and Neuro-Fuzzy Network, IEEE Transactions on
Instrumentation and Measurement 52 (4) (2003) 1224-1231.
10. Cassani R., Mejia P., Tavares J. A.; Sanchez J. C. - Adaptive Filtering For Respiration
Influence Reduction on Heart Rate Variability, 8th International Conference on Electrical
Engineering Computing Science and Automatic Control (CCE), Mexico (2011) 1-5.
11. Reinvuo T., Hannula M., Sorvoja H. and Alasaarela E. - Measurement of Respiratory Rate
With High-Resolution Accelerometer and Emfit Pressure Sensor, IEEE Sensors
Applications Symposium, (2006) 192-195.
12. Alsté Van J. A., van Eck W. and Herrmann O. E. - ECG Baseline Wander Reduction
Using Linear Phase Filters, Computers and Biomedical Research 19 (5) (1985) 417-427.
13. Seema Rani, Amanpreet Kaur and Ubhi J. S. - Comparative Study of FIR and IIR Filters
For The Removal of Baseline Noises From ECG Signal, International Journal of
Computation Science and Information Technology (IJCSIT) 2 (3) (2011) 1105-1108.
14. Laguna Pablo, Raimon Jane and Pere Caminal - Adaptive Filtering of ECG Baseline
Wander, 14th Annual International Conference of the IEEE Engineering in Medicine and
Biology Society, France (1992) 43-146.
15. Mneimneh M. A., Yaz E. E., Johnson M. T. and Povinelli R. J. - An Adaptive Kalman
Filter for Removing Baseline Wandering in ECG Signals, Computers in Cardiology,
Spain (2006) 253-256.
16. Devy Widjaja, Alexander Caicedo Dorado, Johan A.K. Suykens and Sabine Van Huffel Application of Kernel Principal Component Analysis for Single-Lead-ECG-Derived
Respiration, IEEE Transactions on Biomedical engineering 59 (4) 1169-1176.
17. Langley Philip, Emma J. Bowers and Alan Murray - Principal Component Analysis as a
Tool for Analyzing Beat-to-Beat Changes in ECG Features: Application to ECG-Derived
Respiration, IEEE Transactions on Biomedical Engineering 57 (4) (2010) 821-829.
18. Panditv S. V. - ECG Baseline Drift Removal Through STFT, 18th International
Conference of the IEEE Engineering in Medicine and Biology Society, Netherlands
(1996) 1405- 1406.
345
Tran Hoai Linh
19. Sahoo S., Monalisa Mohanty, Suresh Behera, Sukanta Kumar Sabut - ECG beat
classification using empirical mode decomposition and mixture of features, Journal of
Medical Engineering & Technology 41 (8) (2017) 652-661.
20. Sun Y., Chan K. L., Krishnan S. M. - ECG Signal Conditioning by Morphological
Filtering”, Computers in Biology and Medicine 32 (6) (2002) pp. 465-479.
21. Labete D., Foresta F., Occhiuto G., Morabito F. D., Lay-Ekuakille A. and Vergallo P. Empirical Mode Decomposition vs. Wavelet Decomposition for the Extraction of
Respiratory Signal from Single-Channel ECG: A Comparison, IEEE Sensor Journal 13
(7) (2013) 2666-2674.
22. Sadrawi M., Chien-Hung Lin, Yin-Tsong Lin, Yita Hsieh, Chia-Chun Kuo, Jen Chien
Chien, Koichi Haraikawa, Maysam F. Abbod and Jiann-Shing Shieh - Arrhythmia
Evaluation in Wearable ECG Devices, Sensors 11 (2017) 2445-2458.
23. Zhu Bohui, Yongsheng Ding, Kuangrong Hao, A Novel Automatic Detection System for
ECG Arrhythmias Using Maximum Margin Clustering with Immune Evolutionary
Algorithm, Computational and Mathematical Methods in Medicine, Volume 2013 (2013),
8 pages
24. Dong X., Wang C., Hu J., Ou Sh. - Electrocardiogram (ECG) pattern modeling and
recognition via deterministic learning, Control Theory Technol. 12 (2014) 333-344.
25. Jeon T., Jongmin Yu, et al. - Robust detection of heartbeats using association models from
blood pressure and EEG signals, BioMed Eng OnLine 15 (2016) 7-20.
26. Linh T. H. - The modification of TSK network in Neuro-fuzzy system, 25th IC
Fundamentals of Electronics and Circuit Theory (SPETO), Poland (2012) 525-528.
27. Goldberger A. L., Amaral L. A., Glass L., Hausdorff J. M., Ivanov P. C., Mark R. G.,
Mietus J.E., Moody G.B., Peng C.K. and Stanley H.E. - PhysioBank, PhysioToolkit, and
PhysioNet: Components of a New Research Resource For Complex Physiologic Signals,
Circulation 101 (23) (2000) E215-220.
346