Factors associated with quality of life among elderly in urban Vietnam
Bạn đang xem bản rút gọn của tài liệu. Xem và tải ngay bản đầy đủ của tài liệu tại đây (329.45 KB, 15 trang )
JOURNAL OF MEDICAL RESEARCH
FACTORS ASSOCIATED WITH QUALITY OF LIFE
AMONG ELDERLY IN URBAN VIETNAM
Dao Thi Minh An¹, Vu Toan Thinh¹, Dunne P Michael²
¹Institute for Preventive Medicine and Public Health, Hanoi Medical University
²School of Public Health, Queensland University of Technology, Australia.
Quality of life (QoL) among the elderly is a big problem in Vietnam due to a growing proportion of the
elderly in Vietnam while many conditions, including policies, social facilities, culture and other factors are not ready to support for QoL among elderly. This cross-sectional study was conducted to
explore QoL and factors associated with QoL among the elderly in Trung Tu ward, Ha Noi, Viet Nam.
The findings showed that the four domains of QoL the among elderly fluctuated around 50. Mean
scores of social and psychological QoL were higher than those in the physical and environmental
domains. A statistically significant difference in mean scores of QoL by socio-demographics was recorded (age profile, educational attainment, and occupation). All four domains of QoL were positively
correlated with each other. Furthermore, age, psychological, social and environmental domains collectively contributed to 47.59% of the physical domain; while the physical, social, and environmental
domains accounted for 56.13% of the psychological domain. We also found that occupation (worker), as well as physical, psychological, and environmental metrics, accounted for 34.19% of the social domain. Moreover, physical, psychological, social domains and occupation (home-wife) collectively accounted for 45.92% of the transformation of environmental domain. Our study suggests that
it is essential to evaluate overall QoL to have a comprehensive view of its effects in the long run.
Keywords: Quality of Life, Elderly, Hanoi, WHO QoL-Bref
I. INTRODUCTION
Vietnam’s population structure is in a period of dramatic change, presenting a number of public health benefits as well as challenges. Today, one of the most prominent
issues is how to address a rapidly growing
Corresponding author: Vu Toan Thinh, Institute for
Preventive Medicine and Public Health, Hanoi Medical
University
Email:
Received: 05 June 2017
Accepted: 16 November 2017
114
elderly population. Statistics from the Living
Standard Survey of Households in Vietnam
showed that the number of elderly people
(defined as men and women aged 60 years
plus) grew from 3.71 million people in 1979
(6.9% of the total population) to 7.72 million
in 2009 (9% of the total population). At this
rate, by 2020, it is estimated Vietnam’s elderly population will be greater than 12 million [1].
With this in mind, quality of life (QoL)
among the elderly is the most pressing isJMR 111 E2 (2) - 2018
JOURNAL OF MEDICAL RESEARCH
sue. QoL is a multi-dimensional, highly
subjective concept and, as recommended
by the World Health Organization (WHO),
is measured using four major domains, including physical, psychological, social, and
environmental [2]. Within these categories,
QoL has its own characteristics according to
different economic and socio-cultural levels,
producing trend where an overall negatively
asociates with age QoL [3].
Within Vietnam’s cultural context of
multiple generations living together in the
same household, as well as the impact of
urbanization on a rapidly aging population,
QoL and mental disorders among the elderly need to be paid more attention. A recent study conducted in 8 provinces on the
health status of Vietnam’s elderly population
showed that about 95% of the participants
were infected with at least one disease. On
average an elderly person suffers from 2.6
diseases. With this in mind, about 23% of
the elderly people have difficulties in their
daily life, of which more than 90% need supports from other people [4]. According to the
statistic of the National Institute of Gerontology, 9.2% of the Vietnamese population
suffer from depression, one third of which
were elderly and largely retired populations
in major cities [5; 6].
This is an important point to understand
in an age of rapid urbanization. The proportion of elderly in urban areas is quickly rising
and becoming a far more difficult problem
to properly address. Compared to the elderly living in rural areas, the elderly in urban
zones have distinct lifestyles such as extensive free time, more available information
JMR 111 E2 (2) - 2018
relating to health problems, but most of all,
less integrated neighborhood relationships
compared to those in rural areas. Further,
after retirement, may confront psychological
loneliness, emptiness, and even abandonment by their children and neighbors, this
would put the elderly in isolated situations.
Hanoi is the capital of Viet Nam where
there is a rapidly developing economy and
growing population in which many Vietnamese households have 2 to 3 generations live
together [7]. QoL of the elderly in Hanoi after retirement is often influenced by many
factors such as home economics, relationship with their spouse and children, social
issue, physical and mental health, and the
medical system [8 - 10]. However, few studies have specifically analyzed the extent
that these factors impact QoL among the
elderly, especially among those living in urban wards in Hanoi. In Vietnam, there were
some studies conducted on QoL among the
elderly [11]; however, none focused on the
population living in major cities.
Therefore, this study aims to analyze the
quality of life based on the four main domains among the elderly population living in
Hanoi’s Trung Tu ward.
II. SUBJECTS AND METHODS
1. Subjects
Target population is the elderly living in
urban areas in Hanoi city. Particularly, the
study population is defined as the elderly
living in Trung Tu ward, Hanoi. Participants
who were recruited into this study if they met
the following criteria 1) People who living in
Trung Tu ward, Hanoi for at least 1 year; 2)
115
JOURNAL OF MEDICAL RESEARCH
Aged ≥ 60 years old (according to the ordinance of the elderly, issued by the President of the National Assembly on 28th April
2000, the elderly are defined as citizens of
the Socialist Republic of Vietnam from 60
years old or more [12]); and 3) Willing to
participate in this study after giving informed
consent. Individuals were excluded if they
were living in Hanoi temporarily, refused to
participate, or had difficulties in understanding or completing the questionnaire.
2. Methods
Research site
This cross-sectional study was conducted in Trung Tu ward, Hanoi, which is located in Northern Viet Nam. This ward has one
of the densest populations in Hanoi and is
mainly comprised of government officers
that live in 62 dormitories and 2 residential
districts with convenient transportation and
close proximity to entertainment venues,
national hospitals, and schools. Until 2012,
there were 1,593 elderly people in Trung Tu,
accounting for 11.78% of the total population of the ward.
Sample size and data collection
This is a pilot study, so we decided on
a convenience sample of 2% (or 299) of
Trung Tu ward’s total elderly population,
who volunteered for the study. The first step
of recruiting participants was effectively
announcing the study. Ten health collaborators of Trung Tu’s health center wrote an
introduction about the study and announced
the recruitment on the boards at dwelling
areas that they are in charge of. The announcement ordered those who wanted to
voluntarily participate in the study to call a
116
toll-free number for registration. After being
contacted by potential subjects, the second step was to screen them for eligibility
using a questionnaire that assessed each
participant’s recruiting criteria. They were
then recruited into the study based on these
criteria until the target sample size of 299
elderly people was met. In the last step of
sampling, collaborators contacted registered participants at home and provided
them with consent forms. After reading the
consent form, if the elderly agree to participate in the study, they would then receive a
self-administered questionnaire from collaborators. They then allowed at least 2 weeks
for participants to complete their questionnaires and return them to health collaborators in Trung Tu ward, either by themselves
or their relatives. If their relatives delivered
the questionnaire, it would be sealed in
an envelope to ensure confidentiality. The
self-administered questionnaires were immediately screened to check for missing
information to ensure participants could circle responses they missed. If their relatives
delivered their questionnaires, we used the
telephone number which was recorded on
that questionnaire to call the elderly. After
that, the participants' phone number was
deleted to secure their personal information. If the elderly refused to answer, that
questionnaire was considered as ineligible.
Measures
Demographics: Includes 7 questions
about participants’ age, marital status (married vs. unmarried), education level, living
arrangements, and occupation before retirement.
JMR 111 E2 (2) - 2018
JOURNAL OF MEDICAL RESEARCH
Quality of Life: WHO QoL-Bref questionnaire is self-assessment that antains
24 items, each presenting one facet of QoL
and two “benchmark” items in an individual’s overall QoL and general health. The
facets are defined as those aspects of life
that are considered to contribute to a person’s QoL. QoL comprises of four main domains – physical health (7 items relating to
pain and discomfort, dependence on medical treatment, energy and fatigue, mobility,
sleep and rest, activities of daily living, and
working capacity), psychological health (6
items relating to positive feelings, spirituality, religion and personal beliefs, thinking,
learning, memory and concentration, body
image, self-esteem, negative feelings), social relationship (3 items relating to personal
relations, sex life, practical social support),
and environment (8 items relating to physical safety and security, physical environment, financial resources, information and
skills, recreation and leisure, home environment, access to health and social care, and
transportation). These facets were scored
on a Likert scale from 1 to 5 with 1 = Very
poor, 2 = Poor, 3 = Neither poor or good, 4 =
Good, and 5 = Very good; 1 = Very satisfied,
2 = Dissatisfied, 3 = Neither dissatisfied or
satisfied, 4 = Satisfied, and 5 = Very satisfied; 1 = Not at all, 2 = A little, 3 = A moderate amount, 4 = Very much, and 5 = Extremely; or 1 = Never, 2 = Seldom, 3 = Quite
often, 4 = Very often, and 5 = Always. The
raw score from each domain of QoL include
varying scales; for instance, the physical
domain ranges from 7 to 35 points; psychological domain ranges from 6 to 30 points;
social domain scores ranges from 3 to 15
JMR 111 E2 (2) - 2018
points; and environmental domain are from
8 to 40 points. The raw scores of each domain were then converted to a scale of 0 to
100 to compare with other populations, with
lower scores indicating poor QoL. A domain
was treated as missing when over 20% of
its items were missing. With regard to QoL
scores, they are on a positive scale (higher scores represent better QoL) and there
is no cut-off point to determine a specific
score by which the QoL could be assessed
as “good” or “bad” [13].
Data analysis
Data had been cleaned by checking
missing data before it was entered into the
database. Data was entered and cleaned
for outlier and illogical data using Epidata
software, then converted into file.data to be
analyzed in Stata version 10.
The results were initially analyzed using
means, standard deviations, and frequencies. Mean and standard deviation were
used to assess normal distribution. Subsequently, Man-Whitney tests were employed
to compare means between the four domains of QoL by socio-demographics.
The relationships between each domain
of QoL were identified by conducting Spearman tests, since domains of QoL were not
normally distributed. To analyze the influence of independent variables of each domain of QoL, bivariate and multiple linear
regression analysis were used, in which
dependent variables were transformed into
ranks because of the absence of normal
distribution (physical and social variable
was squared to meet this condition). Some
socio-demographic factors (age, marital
status, gender, occupation, education lev117
JOURNAL OF MEDICAL RESEARCH
els, and living arrangement) and significant factors in bivariate linear regression or
in literature documents were then put into
multiple linear regression for the full model.
The final model was selected by performing
stepwise linear regression. The significance
level adopted for statistical test was 5%.
Co-efficient, constant, p value, confidence
interval and R-square for each model were
calculated and presented.
The final model was tested for its fitness
by 1) checking its linear predicted value
(_hat) and linear predicted value squared
(_hatsq); 2) check goodness of fit ("predict
resid, r"; 3), by checking for multi-collinearity.
3. Ethics
The risk of discomfort to participants and
risk of confidentiality loss were marginal.
There were some questions about individual feelings among the elderly about their
happiness with their life, family members,
sex life, and surrounding physical environment, as well as their social connectedness.
To reduce these risks, in the consent form,
participants were advised that they can withdraw at any time and that they can refuse
to answer any question which made them
uncomfortable. They were also advised that
all their refusal or withdrawal will not have
any effect on them in any way. Moreover,
an anonymous self-administered questionnaire was developed and used, in which
can complete by participants without the
survey privately. Additionally, participants
were asked to return their completed questionnaire by themselves to the field workers,
who are outside the participants’ wards. The
118
consent form with participants’ agreement
to participate in the study and their administration group numbers was detached from
the main body of the questionnaire and sent
to the principle investigator (PI) to be securely stored. Therefore, all individual information will be separate throughout the data
collection procedure. Our approach was to
ensure that participants feel that they have
control over the proceedings of the survey.
They were clearly advised that all information is anonymous and will only be analyzed
at the group level. In the consent form, the
PI’s contact number was printed and participants were instructed to if they have any
questions. If participants do become distressed during or after filling out the questionnaire, they could also contact the PI for
further counseling.
All survey questionnaires were anonymous (no name and individual address
identified) and securely stored. This study
was submitted and approved by the Ethical
Committee of the School of Public Health
and accepted in May, 2012.
III. RESULTS
Among the 299 participants, the proportion of males to females was balanced at
48.8% and 51.2%, respectively. The mean
age of study participants was 70.6 years,
while the mean age of males was higher
than females (p < 0.05). The proportion of
the elderly in the group under 70 years was
45.5% compared to these age 70 years and
older 54.5%. The majority of participants
(40.6%) were post-graduation, working
as government officers (80.3%), married
(84.6%) and living primarily with their husJMR 111 E2 (2) - 2018
JOURNAL OF MEDICAL RESEARCH
band or wife and children (47.8%).
Table 1. Mean scores of four domains of quality of life by socio-demographics
Socio - demographic
characteristics
Mean of scores (Mean ± SD)a
Physical
Psychological
Social
relationship
Environment
53.4 ± 12.1
57.4 ± 11.3
60.4 ± 14.1
54.3 ± 11.3
52.9 ± 13.4
57.0 ± 11.8
60.2 ± 14.1
54.3 ± 11.7
Female
53.8 ± 10.9
57.7 ± 10.9
60.7 ± 14.2
54.2 ± 10.9
p value
0.88
0.76
0.81
0.82
< 70
56.7 ± 10.2
59.4 ± 10.6
62.7 ± 13.8
55.2 ± 11.3
>= 70
50.6 ± 13.0
55.7 ± 11.6
58.5 ± 14.1
53.6 ± 11.2
0.0001
0.0042
0.0095
0.396
Single
53.6 ± 12.1
57.6 ± 11.4
60.6 ± 13.9
54.6 ± 11.1
Married
51.8 ± 12.5
56.2 ± 11.1
59.6 ± 15.1
52.7 ± 12.1
p value
0.26
0.57
0.79
0.60
Government officers
53.4 ± 12.2
58.0 ± 11.7
61.0 ± 14.1
55.1 ± 11.3
Others
53.1 ± 12.2
54.9 ± 9.5
59.3 ± 14.1
50.8 ± 10.7
p value
0.83
0.04
0.35
0.0138
College/Intermediate school and less
52.5 ± 12.1
55.7 ± 11.1
58.6 ± 14.7
52.5 ± 11.2
Post-graduation
54.6 ± 12.1
59.9 ± 11.3
63.2 ± 12.9
56.9 ± 10.9
0.13
0.0006
0.011
0.0012
Alone
51.5 ± 15.0
53.1 ± 13.3
59.7 ± 14.1
53.1 ± 12.8
Family
53.4 ± 12.0
57.5 ± 11.2
60.5 ± 14.1
54.3 ± 11.2
p value
0.47
0.18
0.77
0.89
Mean ± SD
Gender
Male
*
Age group
p value
Marital status
Occupation
Education
P value
Living arrangement
JMR 111 E2 (2) - 2018
119
JOURNAL OF MEDICAL RESEARCH
Score in range from 0 - 100; *Man-Whitney test
The mean scores of four domains of QoL
fluctuated around 50 (table 1). Meanwhile,
the social domain had the highest score
(60.4), followed by the psychological, physical, and environmental domain (57.4; 53.4;
and 54.3, respectively). We found that participants under 70 years had higher QoL in
physical, psychological and social domains
than those aged at or over 70 years of age
(56.7 vs. 50.6; 59.4 vs. 55.7; and 62.7 vs.
58.5 with p < 0.01, respectively). However,
this trend was not observed in the environmental domain. Additionally, statistically
significant differences were found in the
psychological and environmental domains
among the elderly who worked as govern-
ment officers and others (57.9 vs. 54.9; and
55.1 vs. 50.8 with p < 0.05, respectively).
These differences were not seen in the
physical and social domains. The more
highly educated participants were, the better their QoL in psychological, social and
environmental domains (55.7 vs. 59.9; 58.6
vs. 63.2; 52.5 vs. 56.9 with p < 0.05, respectively), however this was not the case in the
physical domain. We did not find statistically significant differences in mean scores on
all four domains based on gender, marital
status and living arrangement (whom living
with) (p > 0.05).
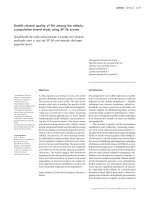
Interestingly, all domains of QoL were
correlated positively with each other (p <
0.001) (Figure1). Specifically, high correlations were identified between the physical
a
(0.6), environmental (0.5), social (0.5), and psychological domains.
Table 2. Factors associated with physical domain
Number of obs
Model summary
Physical_QoL
299
Prob > F
0.0000
R-squared
0.4759
Coef.
P>t
[95% Conf. Interval]
- 29.04
0.00
- 42.93
- 15.14
Psychological_QoL
48.80
0.00
36.66
60.95
Environmental_QoL
16.64
0.03
4.87
28.41
Social_QoL
9.44
0.01
1.82
18.06
771.47
0.22
- 46.09
20.03
Age
Cons
For the physical domain (table 2), R-square equal 0.4759 (p < 0.001), meaning that age,
psychological, social, and environmental domains contribute 47.59% to this facet of participants’ QoL. All determinants were positively correlated except for age, which was inversely
correlated. For every one unit increase in psychological, environmental and social domains,
we would expect a 48.80; 16.64; and a 9.44 unit increase in the physical domain, respectively.
The coefficient for age was 29.04, meaning that for a one unit increases with age; a 29.04 unit
120
JMR 111 E2 (2) - 2018
JOURNAL OF MEDICAL RESEARCH
decreases in physical domain.
Table 3. Factors associated with psychological domain
Number of obs
Model summary
299
Prob > F
0.0000
R-squared
0.5613
Psychological_QoL
Coef.
P>t
[95% Conf. Interval]
Physical_QoL
0.36
0.00
0.27
0.44
Social_QoL
0.14
0.00
0.06
0.21
Environmental_QoL
0.36
0.00
0.26
0.45
Cons
10.57
0.00
5.71
15.45
For psychological domain (Table 3), we found that physical, social, and environmental
domains were positively correlated with psychological domain, which collectively accounted
for 56.13% (p < 0.001). The domain that contributed the most to psychological domain were
physical and environmental (whose coefficient was 0.36, meaning that the psychological domain increases 0.36 ranked units, p < 0.001), followed by social (whose coefficient was 0.14,
meaning that the psychological domain increases 0.14 ranked units, p < 0.001).
Table 4. Factors associated with social domain
Number of obs
Model summary
299
Prob > F
0.0000
R-squared
0.3419
Social_QoL
Coef.
P>t
[95% Conf. Interval]
Physical_QoL
19.81
0.02
3.17
36.45
Psychological_QoL
41.30
0.00
21.51
61.09
Environmental_QoL
30.91
0.00
13.11
48.71
Workers
539.23
0.04
32.01
106.44
Business man
- 61.64
0.23
- 160.91
385.63
Freelance worker
- 38.70
0.30
- 119.02
363.61
63.43
0.91
- 100.85
113.73
Others
- 50.91
0.51
- 207.25
109.43
Cons
- 124.25
0.01
- 211.56
- 36.94
Home wife
For the social domain (Table 4), occupation (worker), physical, psychological, and environmental domains were positively correlated and together accounted for 34.19% (p < 0.001).
The coefficient for occupation was 539.23, meaning that the elderly individulas who worked
JMR 111 E2 (2) - 2018
121
JOURNAL OF MEDICAL RESEARCH
as workers have a score of 539.23 ranked units greater than those who were government officers; the coefficient for physical, psychological and environmental domain was, in turn, 19.81;
41.30 and 30.91, meaning that a one unit increases in physical, psychological or environmental domain produces a 19.81; 41.30 and 30.91unit increase in the social domain, respectively.
Table 5. Factors associated with environmental domain
Number of obs
Model summary
299
Prob > F
0.0000
R-squared
0.4592
Environmental_QoL
Coef.
P>t
[95% Conf. Interval]
Social_QoL
0.14
0.00
0.06
0.22
Psychological_QoL
0.44
0.00
0.32
0.56
Physical_QoL
0.14
0.01
0.03
0.25
Worker
- 3.11
0.06
- 6.34
0.13
Businessman
1.34
0.68
- 5.02
7.71
Freelance worker
- 0.37
0.88
- 5.13
4.40
Home wife
- 10.22
0.00
- 17.11
- 3.33
Others
- 4.14
0.40
- 13.81
5.52
Cons
13.38
0.00
7.85
18.90
Data from Table 5 shows factors associated with the environmental domain. Physical, psychological, social, and occupational
(home-wife) determinants together accounted for 45.92%. The physical, psychological,
and social domains were positively correlated with the environmental domain and the
correlation coefficient of these domains
were 0.14, 0.44, and 0.14, respectively, meaning that for a one unit increase in
physical, or psychological, or social domain,
we would expect that a 0.14, 0.44, and 0.14
unit increase in the environmental domain.
Working as a homemaker was inversely related and its coefficient was 10.22, meaning
that elderly with working as homemakers
have a score of 10.22 ranked units lower
than those with government officers.
122
IV. DISCUSSION
We found that QoL scores of the elderly living in Trung Tu ward fluctuated around
50 and compared to the maximum score in
the 0-100 scale, they presented a moderate
QoL level for the four domains of WHO QoLBref (table 1). These results are very similar
to other studies on QoL among the elderly
in Brazil [13] and two studies conducted in
Can Tho and Ho Chi Minh city, Viet Nam,
which indicated that the QoL of people aged
at 18 and over stayed at moderate level [14].
These similarities in QoL between these locations can be explained by rapid economic
development and urbanization. However,
the average scores of all four domains of
QoL in this study were lower than findings
detected in other developing countries,
JMR 111 E2 (2) - 2018
JOURNAL OF MEDICAL RESEARCH
such as among the elderly living in South
Jakarta (Indonesia), in Taiwan (2010), and
in adults with sickle cell disease in Jamaica
, as well as in France among people age 80
and patients after intensive care unit [15].
In this study, the mean scores of physical
and environmental domain were lower compared to the psychological and social domain (Table 1). These findings were similar
to the results of other studies and indicated
that social domain had the highest mean
score when compared to other domains [8;
16]. In a study conducted on 240 participants, Sanghee Chun et al. also indicated
that environmental and psychological domains had higher mean scores compared
to physical and social domains (78.9; 74.2
vs. 73.4; 65.6, respectively) [17]. Likewise,
a Vietnamese study performed by Phung
Duc Nhat et al. also showed this trend [14]. .
We suggest that the elderly in Trung Tu
ward have a lower perception of their QoL
in the physical domain. This was indicated
by their self-reported pain and discomfort,
medicine dependence, energy and fatigue,
issues related to mobility capability, as well
as sleeping and rest, activities of day-today life, and working abilities. This was also
the case of it environmental QoL, which includes a diversity of physical security; supports for finance; information sources and
skills; entertainment; housing environment;
accessibility to health services and social
care; and transportation as well. This highlights the importance of improving elderly’s
physical and environmental QoL via urging
them to participate in clubs and recreational
activities while accessing to health services.
Several studies showed the effect of age
JMR 111 E2 (2) - 2018
on QoL of the elderly [18; 19]. The higher
age was, the lower QoL on physical, psychological and social domains (Table 1).
These results are similar to the findings by
Barua et al. in 2007, Abhay Mudey et al. in
2011 [2], Abdul Rashid in 2013 [20], Phung
Duc Nhat et al. in 2011 [14]. As seen in
García et al., old age was associated with
the worst levels of health-related to QoL.
Likewise, Laxmikant Lokare’s study in 2011
indicated that the mean score in the age
group of under 70 years old and above 70
years old were significantly differences in
the psychological domain (p < 0.05) [21].
We found that those with higher education level attained better QoL. This finding
supports a study conducted in Can Tho
city, Vietnam, which indicated that people
aged 18 years or over with the highest level of education had better QoL on all four
domains compared to the lower educated
participants [14]. In a study by Ping Xia et
al., participants who had a degree, vocational training or above had mean scores in
all domains higher than those without (p <
0.001) [16]. A study conducted on 205 elderly in Malaysia indicated that the elderly
who had secondary school level education
had higher QoL as compared to those with
primary level or no education (26.7% vs.
21.5% and 2.2%, with p < 0.01, respectively). Likewise, the elderly who worked as
government officers had better QoL than
other participants. This result supports previous studies indicating that the elderly who
were employed had 22.6% of higher level of
QoL when comparing to those who were not
(13.4%) [22]. Additionally, a study conducted in Nonthaburi, Thailand revealed that the
123
JOURNAL OF MEDICAL RESEARCH
majority of government officers who retired
early (70.5%) had a high level of QoL, followed by moderate level (28.5%) and low
level (1.0%) [23].
This reflects our finding that the elderly
with higher levels of education generally
have a stable job, positive social relationships, and a monthly salary after retirement.
In other words, in addition to state allowance, those who have higher education and
state officials had better QoL. Therefore, it
is important to improve care for elderly who
were state officials to balance the QoL within the population of those employed by the
government and those who were not.
The current study indicated that there
was no statistically significant difference on
mean scores for QoL by socio-demographics, including gender, marital status and living arrangement (living with whom). These
findings reflected the results of Abhay Mudey et al. [2], Ping Xia [16], Abdul Rashid
[20] and Myo Myint Naing [22]. Though we
showed no difference in mean scores of
QoL by gender, some studies found males
had higher QoL than females [9; 10; 16; 24].
These results differed from our study. One
explanation of this trend may be the fact
that most of the elderly in Trung Tu ward
had many similar characteristics such as
higher education, balanced proportion of
males and females, and similar professional status.
When attempting to identify a correlation
between all four domains of QoL, we found
a high positive correlation between physical, social, environmental domain and psychological domain (Figure 1). These results
are supported by other studies [17; 25]. For
124
instance, Ginieri’s study provided strong
correlations between the scores of all domains, particularly physical, psychological
and social [25]. A study conducted on QoL
in Wilson’s disease showed strong Pearson correlation between environmental and
psychological domain (r = 0.53) [26]. Likewise, Sanghee Chun et al. also revealed
that psychological domain was significantly
correlated with physical, social and environmental domains (r = 0.56; 0.50; and 0.52
with p < 0.01, respectively) [17].
To determine some determinants of
QoL among the elderly, we conducted two
types of analysis, including bivariate and
multiple linear regression to understand
the relationship of socio-demographic factors to QoL scores. Several investigations
have shown that socio-economic variables
and health comorbidities affect WHO QoLBref scores [8]. Recent studies have shown
that WHOQoL-Bref domain scores among
middle-aged and elderly are influenced by
socio-demographic variables such as age
[18; 19; 21], gender [8 - 10; 27], marital status and living arrangement [24]. However, a
study conducted on QoL of Nigerian clinic
patients with type 2 Diabetes Mellitus also
indicated that in general, the QoL measures
were not influenced by characteristics such
as gender, education level or marital status. Nevertheless, we still chose to analyze
QoL scores with the socio-demographic
variables such as age, marital status, education, and living arrangement. Four linear
regression models were established, and
for each model, we used one domain as a
dependent variable and socio-demographic
factors that were set as independent variJMR 111 E2 (2) - 2018
JOURNAL OF MEDICAL RESEARCH
ables. To achieve this, a bivariate linear
regression analysis was performed with
each independent variable (such as gender, age, level of education, marital status,
living arrangement, and occupation) and
each domain of QoL (after transforming into
the ranks because of absence of normal
distribution) was analyzed as a dependent
variable. As a result of bivariate regression,
we found that age (p < 0.001) was statistically significant in the physical domain while
gender, levels of education, marital status,
living arrangement and occupation did not
contribute substantially to explain the variation in this model. Secondly, age, level of
education, and occupation (p < 0.05) were
statistically significant in the psychological
domain while gender, marital status, and
living arrangement were not. In the social
domain, age (p < 0.001), level of education,
occupation, and living arrangement (p <
0.05) were statistically significant while gender and marital status were not. Concerning
environmental domain, we found that only
education level and living arrangement (p
< 0.05) were statistically significant while
age, gender, marital status, and occupation
were not. Bivariate linear regression was
used to identify prospective determinants
QoL; these predictors were then inputteded
into the multiple linear regression models'.
Some determinants that were indicated in
previous studies to be significant took to
multiple linear regression models, although
we could not find the statistically significant
correlation. We analyzed and identified
some determinants that effect on all four
domains of QoL including physical, psychological, social and environmental domain.
JMR 111 E2 (2) - 2018
When analyzing multiplelinear regression for independent effects on each domain of QoL we found that age, psychological, social and environmental domain were
statistically related to the physical domains
with p < 0.001. A study conducted in Chinese urban community found that age was
negatively associated with physical domain
because the older community had worse
physical domain score than younger community [16]. Our finding was similar to the
results of other studies such as Ankur Barua
in 2005; Lokare et al., and Mudey in 2011
[2; 21]. Concerning psychological domain,
we found that physical, social, and environmental domain were statistically significant associated. These findings were
consistent with previous research [17; 26].
For social domain, we found that physical,
psychological, and environmental domains
were positively related to the social domain. Meanwhile, working as home-maker was resatively associated. Our findings
support previous studies. In Oye Gureje et
al. study, age and social factors (practical
social support, personal relationship) were
the strongest determinants of the physical
domain. For psychological and environmental domain, social factors such as being in
contact with family members and participation in community activities were much
more strongly related. A study conducted
on 1,301 elderly in Brazil revealed that four
domains, including physical, psychological,
social and environmental domain together
accounted for 36.1% of overall QoL. Among
these determinants, social domain has little
contribution covered 0.4% (p > 0.05) meanwhile the domain that contributed the most
125
JOURNAL OF MEDICAL RESEARCH
to overall QoL was physical health (28.8%),
followed by environmental health (6.2%),
and psychological health (1.3%) with p <
0.05. Therefore, changes in one or more
domain may imply change in overall QoL
and other domains.
Although we did not determine multiple linear regression between all four domains of QoL and overall QoL, there were
many studies conducted all over the world
that research this correlation. To be specific, a study conducted in Brazilian community-dwelling older adults indicated that
overall QoL was significantly related to the
reported health condition, educational status, likelihood of participation in physical
activities, medical status, age bracket and
utilization of primary health care [28]. It
could be considered as a limitation of this
study. It is due to the fact that we have yet
to evaluate overall QoL and factors associated with it. Many findings depicted that a
lot of different factors could contribute to the
explanation of the same independent variable and the interpretation of overall QoL is
quite difficult, too. For example, we use a
single form to operationalize an individual’s
evaluation, and the results of these evaluations could change dramatically because
of the variation of priority problems and the
circumstances which have influences on life
changes. This study is important in illustrating how to evaluate QoL as a whole (overall
domain) and give a comprehensive view of
QoL among elderly living in urban areas, especially in Trung Tu ward, Hanoi city.
V. CONCLUSION
Quality of life of the elderly: QoL of four
126
domains among elderly living in Trung Tu
ward stayed at moderate level as compared to WHO’s standard. Mean scores of
psychological and social domain are higher
than those of physical and environmental
domain (60.44; 57.37; 53.37; and 54.27, respectively).
There is statistically significant difference in mean scores of QoL by socio-demographics: 1) The higher the age, the lower the QoL on physical, psychological and
social domain. 2) The higher the education,
the better QoL on psychological, social and
environmental domain. 3) Elderly working
as government officers had higher QoL on
psychological and environmental domain
than others.
Determinants of each domain of QoL:
All four domains of QoL were positively
correlated. Inparticular, we found a high
correlation between physical, social, environmental and psychological domain (0.61;
0.53 and 0.51, respectively). Particularly, 1)
Age, psychological, social and environmental domain contribute 47.59% to physical
domain; 2) Physical, social, and environmental domain contribute 56.13% to psychological domain; 3) Occupation (worker),
physical, psychological, and environmental
domain together accounted for 33.19% regarding social domain; 4) Physical domain,
psychological domain, social domain, and
occupation (home-wife) together accounted
for 45.92% contributing to environmental
domain
POLICY RECOMMENDATION
Improving QoL, especially physical and
environmental QoL, for the elderly through
JMR 111 E2 (2) - 2018
JOURNAL OF MEDICAL RESEARCH
encouraging them to participate in local
clubs, recreation activities and accessing
to health services, medical treatment, etc.
is important. Also important is paying more
attention about QoL among elderly who are
not with governmental occupation, especially on psychological and environmental
QoL, through health communication and
education to provide information and skills
that they need in their day-to-day life, improving health services for elderly, encourage them to involve in recreational activities
to ameliorate their health as well as sharing
their feelings, etc, to substantially equal QoL
between elderly had different occupation. It
is especially essential to evaluate QoL as a
whole (overall domain) to have a comprehensive view of QoL of elderly in Trung Tu
ward in particular and other urban wards in
Hanoi in general.
Acknowledgments
We are grateful for the active support and
cooperation provided by the ederly living in
Trung Tu ward, health center and People’s
Committee. The author also thanks the field
teams for their tireless efforts to assist this
study.
This study was funded by The
Queensland University of Technology and
the Australian Government's Overseas Aid
Program (AusAID).
REFERENCES
1. United Nations Population Fund
(UNFPA) in Vietnam: Population aging and
elderly in Vietnam: Current situation, forecast, and some policy recommendations.
In. Ha Noi; 2011.
2. Mudey A, Ambekar S, C.Goyal
JMR 111 E2 (2) - 2018
R, Agarekar S, Wagh VV: Assessment of
quality of life among rural and urban elderly
population of Wardha district, Maharashtra,
India. Ethno Med 2011, 52(2), 89 - 93.
3. Applying the modified measurement for assessing quality of life of elderly
and tested on a number of groups of Vietnamese elderly
4. Nguyen thanh Binh (2012). Elderly people in Vietnam at present time. International J Soc Sci & Education, 2(3), ISSN:
2223 - 4934 e and 2227 - 2393X Prin
5. Luong Chi Thanh: Health of the
elderly in Vietnam: situation and solution.
http://wwwvnanesthorg/forum_36/showthreadphp?t=134 2008.
6. Ministry of Health (2011). Insufficient knowledge to prevent diseases among
elderly population. Newspaper of Science
and Life.
7. The elderly, alone elderly and issues
of legal assistance for these objects in Vietnam. />8. Blay SL, MarchesoniII MSM
(2011): Association among physical, psychiatric and socioeconomic conditions and
WHOQOL-Bref scores. Cad Saúde Pública,
27(4).
9. NE A, SF A, HM K, PA G, M O
(2004): Quality of life in diverse groups of
midlife women: assessing the influence of
menopause, health status and spychosocial
and demographic factors. Qual Life Res,
13(6), 1067 - 1080.
10. B T, AK D, IR H (2004): Quality of
life in old people with and without cancer.
Qual Life Res, 13(6), 1067 - 1080.
11. Cuong BT (2005): In the social security domain: Research on aging in Vietnam, National University.
12. The National Assembly of The
Socialist Republic of Vietnam (2000): The
ordinance of elderly. In. Ha Noi.
127
JOURNAL OF MEDICAL RESEARCH
13. Pereira RJ, Cotta RMM, Franceschini SdCC, Ribeiro RdCL, Sampaio
RF, Priore SE, Cecon PR (2006). Contribution of the physical, social, spychological
and environmental domains to over all quality of life of the elderly. Brazil.Universidade
Federal de Viçosa.
14. Nhat PD, Van DTT, Anh HVV
(2011). Quality of life of people living in Ninh
Kieu district, Can Tho city. Institute of Hygiene - Public Health in Ho Chi Minh City.
15. Tabah A, Philippart F, Timsit JF,
Willems V, Français A, Leplège A, Carlet
J, Brue C, Misset B, Garrouste-Orgeas
M (2014). Quality of life in patients aged 80
or over after ICU discharge. Critical Care,
14(1).
16. Xia P, Li N, Hau K-T, Liu C, Lu
Y (2012). Quality of life of Chinese urban
community residents: a psychometric study
of the mainland Chinese version of the
WHOQOL-BREF. BMC Medical Research
Methodology, 12, 37.
17. Chun S, Lee Y, Lundberg N, McCormick B, Heo J (2008). Contribution of
Community Integration to Quality of Life for
Participants of Community-Based Adaptive
Sport Programs. Therapeutic Recreation
Journal, XL II(4), 217 - 226.
18. RH O, G H, EA L, LC G (2003):
Quality of life assessment in the community-dwelling elderly: validation of the Assessment of Quality of Life (AQOL) instrument
and comparison with the SF-36. J Clin Epidemiol, 56(2), 138 - 147.
19. H H, AR A, AM A, A U (2004): Is the
evaluation of the global quality of life determined by emotional status? Qual Life Res,
13(8), 1347 - 1356.
20. Rashid A, Manan AA (2013). The
128
Quality of life of Elderly Living in a Home for
the aged in Penang Malaysia. Middle East
Journal of Age and Ageing, 10(2).
21. Lokare L, Nekar MS, Mahesh V
(2011): Quality of life and restricted activity days among the old aged. Int J Biol Med
Res, 2(4), 1162 - 1164.
22. Naing MM, Nanthamongkolchai
S, Munsawaengsub C (2012): Quality of
life of the elderly people in Einme Township
Irrawaday Division, Myanmar. Asia journal
of public health, 1(2).
23. Nanthamongkolchai S, Pasapun
U, Charrupoonphol P, Munsawaengsub
C (2009). Quality of Life of the Early Retired
Government Officers in Nonthaburi Province. Journal of Public Health, 38(3).
24. Alexandre TdS, Cordeiro RC,
Ramos LR (2009). Factors associated to
quality of life in active elderly. Rev Saúde
Pública, 43(4), 613 - 621.
25. Gineri-Coccossis M, Triantafillou E, Tomaras V, Soldatos C, Mavreas
V, Christodoulou G (2012). Psychometric
properties of WHO-BREF in clinical and
healthy Greek populations: Incorporating
new culture-relevant items. PSYCHIATRIKI, 23(2), 130 - 142.
26. Kumar RNK, Taly AB, Nair KPS,
Sinha S, Prashanth LK, Vidya N, Arunodaya GR, Rao S (2008). Quality of life in
Wilson's disease. Ann Indian Acad Neurol,
11(1), 37 - 40.
27. U J, IR H, Westergren (2004).
Overall and health related quality of life
among the oldest old in pain. Qual Life Res,
13(1), 125 - 136.
28. L P, L V, AE M (2009). Factors associated with quality of life of Brazilian older
adults. Int Nurs Rev, 56(1), 109 - 115.
JMR 111 E2 (2) - 2018