Visualizing the dynamics of genetic profile in breast cancer treatment: A better way to explain why a drug could be repurposed: A riview
Bạn đang xem bản rút gọn của tài liệu. Xem và tải ngay bản đầy đủ của tài liệu tại đây (1.21 MB, 13 trang )
Journal of military pharmaco-medicine no1-2019
VISUALIZING THE DYNAMICS OF GENETIC PROFILE IN
BREAST CANCER TREATMENT: A BETTER WAY TO
EXPLAIN WHY A DRUG COULD BE REPURPOSED: A RIVIEW
Nguyen Thanh Minh1; Nguyen Thi Kim Tran2; Jake Yue Chen1
SUMMARY
In this work, we further enhance our computational framework for breast cancer drug
repurposing by visualizing the prospected dynamic gene expression after the treatment.
Practically, the most challenging problem in drug repurposing is to prioritize the list of drugs for
further in vivo validation and entering clinical trials. In drug repurposing, the possible candidate
drugs could be between fifty and several hundreds, depending on different approaches for
candidate selection. In contrast, due to the budget and safety constraints, a repurposing clinical
trial usually contain only one or a few drugs. In a prior work, we achieved some successes in
solving the prioritization problem. However, we were not able to provide detailed and easy to
understand explanation on the prospected dynamic changes of the genetic information. The
visualization presented in this work would help achieving this task. The complete framework of
computing and visualization helps the doctor to select one repurposed strategy: Targeting ACHE
gene in breast cancer for in vivo validation with promising result.
* Keywords: Breast cancer; Drug; Genetics.
INTRODUCTION
Drug repurposing (also called drug
repositioning) has become one of the
most active areas in pharmacology since
last decade because this approach could
significantly reduce the cost and time to
invent a new treatment. Before drug
repurposing research became active, it
was expected to take about 15 years and
$0.8 - $1 billion to invent a new drug [1],
due to many tests and clinical trials in order
to be commercially approved by American
Food and Drug Administration (FDA). It is
expected that the failure probability during
clinical trials is about 91.4% [2]. Briefly,
drug repurposing finds new indications for
known drugs and compounds [3]. Drug
repurposing applies modern computational
techniques to digitalize genomic [4],
bioinformatics and chemical informatics
[5] to offer more systematic evaluation of
the chemical compound before entering
the laboratory testing and clinical trial
steps. In addition, drug repurposing could
explore the large set of chemical
compounds, which is estimated to be
more than 90 million by PubChem
( statistics,
to reduce the cost of synthesizing new
compounds. Prominent successful examples
for drug repurposing include viagra, avastin,
and rituxan [6].
1. Informatics Institute, School of Medicine, the University of Alabama at Birmingham
2. School of Medicine, the University of Alabama at Birmingham
Corresponding author: Nguyen Thanh Minh ()
Date received: 20/10/2018
Date accepted: 07/12/2018
5
Journal of military pharmaco-medicine no1-2019
Practically, in drug repurposing, the
researcher solves two problems:
Prioritization and explanation. First, in
prioritization, given the large number of
possible drugs reasonable for repurposing,
the researcher needs to estimate which
drugs would give the highest chance of
success in further in vivo validation. The
study at [7] is a typical example of this
problem: from the list of thousands drugs
approved in the United States, the genetic
and pathway analysis, which is among the
most well-known method for candidate
selection in repurposing, still returns 24 drugs.
Therefore, it requires another step of
prioritization to select only one or two
drugs for validation. Second, after prioritization,
the researcher needs to explain why the
highly prioritized drugs, which have not
been studied for the disease, could
possibly help treating the disease. To be
more concrete, given that genetic analysis
could identify which genes expressing
abnormally in the disease, can the drug
reverse functionality of these expressingabnormal genes?. In addition, what is the
pathway from the drug’s target to these
expressing-abnormal genes?.
In this work, we solve the explanation
problem given the results from the prior
work [8], where we mostly focused on the
prioritization problem. By using Gene Terrain
technique [9], we can plot the heatmaps
of disease-specific gene expression and
the expected expression dynamic with the
treatment. By comparing these heatmaps,
we would be able to estimate which gene
expressions would change given the
treatment and whether the expressingabnormal genes would be impacted.
Applying the combined approach of [8]
6
and visualization in breast cancer, we
help the biologist to select drugs targeting
ACHE gene, which is originally the
strategy to treat the Alzheimer’s disease,
to be repurposed in treating breast cancer
ER-case. The in vivo validation shows
that targeting ACHE gene could inhibit the
breast cancer cell line growth, which is a
promising result before applying for clinical
study.
MATERIALS AND METHODS
1. Reviews from prior study.
In the prior study [8], by modeling the
gene expression dynamic in breast cancer
and applying system control theory, we
suggested 10 drugs promising for breast
cancer repurposing. For breast cancer ER+
subtype, the recommended drugs are erbitux,
flutamide, medrysone, methylprednisolone,
norethindrone, prednisolone, prednisonea
and vandetanib. For breast cancer
ER - subtype, the recommended drugs
are daunorubicin and donepezil. The
significant targeting strategy for these
drugs could be categorized into:
- Targeting epidermal growth factor
receptor (EGFR), which activates several
signaling cascades to convert extracellular
cues into appropriate cellular responses.
Among these signaling pathways are
estrogen signaling, in which the receptors
ESR1 and ESR2 are well-known for
overexpression in breast cancer ER+ [10].
- Targeting acetylcholinesterase (ACHE),
which is very popular in the Alzheimer’s
disease treatment since ACHE participates
in neuronal apoptosis [10]. The impact of
ACHE in breast cancer, if verify, is very
novel.
Journal of military pharmaco-medicine no1-2019
2. Review: Gene Terrain tool.
Gene Terrain [9], which was initially
developed for visualizing gene expression
profile, could be further employed to identify
the group of disease-specific markers. In
gene Terrain, genes having stronger
associations would stay closer to each
other, laying out on a heat map. In addition,
the heat map color is determined by the
combinative effect of expression values.
Therefore, a group of genes overexpressed
or underexpressed together would form a
“peak” or a “valley” in the terrain. Therefore,
up to this point, the scientist could manually
point out the genes inside “peaks” and
“Valleys”, which are usually much less than
the results from GWAS statistical analysis,
to identify single marker, as the group of
markers. In addition, by comparing the
terrains using the expressions of disease,
control (non-disease) and treatment
subjects, we could find which group of
genes express differently among these
subjects. The gene Terrain online tool with
precise instruction could be found at
/>3. Estimating the gene expression
with the treatment.
Since the repurposing drugs in section
2a have not been studied in breast cancer,
we do not have the expression evidence
to use in gene Terrain. Therefore, we
estimate the change of gene expressions
given the treatment as follow:
N
S( j, k ) = (1 − d ) c j + d ∑
i
M(i, j ) × S(i, k − 1)
out_deg(i)
Here, S: Denotes the vector of estimated
gene expression computed iteratively; N:
Is the total number of genes in the expression
profile; k: Denotes the kth iteration, i and j:
Denote different nodes; M: Is the matrix of
gene-gene associations; out_deg(i): Is the
gene-degree computed from M; cj: Is the
initial value of S(j). Damping factor d = 0.85
controls how much the new signal S(j, k)
is updated from other nodes in the network.
In this work, we only focus on well-known
genes appearing in KEGG’s breast cancer
pathway
( />RESUTLS
1. Visualizing tamoxifen treatment.
Since Tamoxifen has been approved
for treating breast cancer, we examine the
tamoxifen visualization to assess the
capacity of explanation from the combination
of prioritization [8] and gene Terrain [9]. In
addition, since we know that tamoxifen
may be somewhat ineffective in breast
cancer ER-subtype, this case study would
demonstrate the “personalized medicine”
capacity of the framework. As showed in
figure 1, the difference between the ER+
and ER- subtypes include the area of
ESR1-TUBB genes (1), the area of
BAD-GSK3A genes (2), and the area of
HPIK2-BAX-ABL1-STK11 genes (3). For
the area (1), ESR1 strongly overexpresses
in breast cancer ER+ but does not express
in breast cancer ER-. Tamoxifen is expected
to inhibit ESR1, thus reverses the ER+
subtype but not ER-. Tamoxifen is not
expected to have any action in the other
areas. Therefore, we can provide an
explanation on the difference of Tamoxifen
efficacy in treating different subtypes of
breast cancer.
7
Journal of military pharmaco-medicine no1-2019
2. Visualizing the expectation of
targeting EGFR and ACHE treatments.
Figure 2: Visualizing targeting EGFR (left)
and ACHE (right) treatment.
Figure 1: Visualizing tamoxifen treatment.
(Top, left: Breast cancer ER+ gene
expression; top, right: Breast cancer ERgene expression; bottom: Estimated gene
expression with tamoxifen treatment)
8
In figure 2, we show that targeting
EGFR and ACHE treatments are
expected to have similar gene expression
pattern to the tamoxifen treatment. The
EGFR and ACHE treatments could lead to
the same critical outcome: moderately
inhibiting estrogen receptor (ESR1) and
strongly
inhibiting
the
group
of
BARD1-EGFR-RAD51, which strongly
overexpress in both breast cancer ER+
and ER- subtypes. We also expect that
the EGFR and ACHE strategies could be
slightly better than tamoxifen treatment
(targeting ESR1) because targeting
EGFR and ACHE could activate BAD
gene (figure 2), which is underexpressed
in breast cancer ER+ subtype (figure 1).
Meanwhile, tamoxifen shows now impact
on this gene.
Journal of military pharmaco-medicine no1-2019
3. Further analysis of targeting
ACHE.
We focus on targeting ACHE because
this strategy has not been explored in
breast cancer research, while EGFR has
been well-studied in breast cancer (see
figures 1 and 2). In our in vitro validation,
the ER+ breast cancer cell line MCF7 and
the ER- cell line SKBR3 were treated for
96 hours with escalating of tamoxifen
and drug X targeting ACHE. Tamoxifen
significantly inhibit both types of breast
cancer cell, in which the dosage for the
MCF7 cell (IC50 = 31.2 ± 4.9 µmol/L) is
less than the dosage for SKBR3 cell
(IC50 = 55.7 ± 4.2 µmol/L). Drug X has the
same effect to tamoxifen: it inhibits the
MCF7 cell (IC50 = 72.9 ± 5.6 µmol/L)
better than the SKBR3 cell (84.6 ±
4.4 µmol/L). However, the dosage needed
for drug X is somewhat higher than
the dosage needed for tamoxifen. The
dosage issue is the major concern before
further studying X in clinical trials.
Figure 3: Pathway explaining how targeting ACHE could impact important breast
cancer genes.
9
Journal of military pharmaco-medicine no1-2019
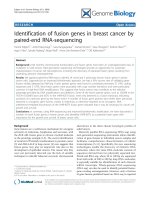
Figure 4: Number of samples in which ACHE overexpresses (red color) according to
the expression of PR and HER2 (ERBB2) (black color) in the GSE54002 dataset.
(The p-values of hypergeometric distribution, implying how significantly of observing
ACHE overexpressing in specific scenario of ER, PR and HER2 expression, are
marked in blue)
To explain why targeting ACHE could
impact significant breast cancer gene, we
use STRING database ( />to query the gene-gene regulations and
explore the downstream effectors of ACHE.
The result showed in figure 3, resembles
the patterns of KEGG breast cancer
signaling pathway ( />kegg- bin/show_pathway?hsa05224). Here,
targeting ACHE triggers neuronal nicotinic
acetylcholine receptor (nAchR), leading to
the activation of the JAK-STAT signaling
pathway (in red box). The JAK-STAT
signaling pathway triggers the estrogen
receptors (ESR1, ESR2), which is, in many
cases, the starting point of breast cancer.
In addition, from the GSE54002 dataset
( />cc.cgi?acc=GSE54002), we found that
ACHE, strongly expresses in two scenarios:
ER+, PR-, HER- (p-value: 0.077), and
10
ER-, PR-, HER2+ (p-value: 1.78 × 10⁻⁵
(figure 4a). Therefore, targeting ACHE is
more likely to treat breast cancer in PRsubtype, or triple negative subtype, in
which the common hormone therapy is
inefficient.
CONCLUSIONS
In this work, we further investigated the
former result at [8] to explain the prospect
of breast cancer drug repurposing by
using drugs targeting ACHE genes. The
framework of gene Terrain visualization
and pathway analysis allows us to find the
potential strategy as above. The ACHE
strategy has been partially proven in our
in vivo validation. The same framework
could be applied to prioritize drug
repurposing in other cancer diseases.
However, we have not been able to
completely solve the dosage problem.
Journal of military pharmaco-medicine no1-2019
The experiment shows that although
targeting ACHE inhibits the growth of
cancer cell similar to the common treatment
using tamoxifen, the dosage needed for
targeting ACHE is twice more. This dosage
may pass the threshold for toxicity in
clinical trials. In addition, we show that the
dosage may be related to the targeted
gene, usually receptor genes, expression.
For example, tamoxifen, targeting ESR1
gene, shows better efficiency in inhibiting
breast cancer ER+ cell (having strong
ESR1 expression) than inhibiting ER- cell
(having weak or moderate expression).
Therefore, we suggest that targeting
ACHE should only be applied in treating
breast cancer with low progesterone (PR)
expression. As our result showed, ACHE
tends to express stronger when PR level
is low.
To conclude, we believe that in Vietnam,
drug repurposing should be studied in
larger and deeper scale. Not only drug
repurposing significantly reduces the cost
and time for developing a new treatment
but also drug repurposing takes the
advantage of systematic techniques and
knowledge developed in several decades,
organizing in public biochemical databases.
In addition, repurposing requires strong
mathematical skill, which is usually the
major strength of Vietnamese researchers.
REFERENCES
1. Dimasi J.A. New drug development in
the United States from 1963 to 1999. Clin
Pharmacol Ther. 2001, 69 (5), pp.286-296.
2. Thomas D, Burns J, Audette J, Carrol A,
Dow-Hygelund
C,
Hay
M.
Clinical
development success rates 2006 - 2015.
San Diego: Biomedtracker/Washington, DC.
BIO/Bend: Amplion. 2016.
3. Gupta S.C, Sung B, Prasad S, Webb L.J,
Aggarwal B.B. Cancer drug discovery by
repurposing: teaching new tricks to old dogs.
Trends in Pharmacological Sciences. 2013,
34 (9), pp.508-517.
4. Power A, Berger A.C, Ginsburg G.S.
Genomics-enabled drug repositioning and
repurposing: Insights from an IOM Roundtable
activity. JAMA. 2014, 311 (20), pp.2063-2064.
5. Bisson W.H. Drug repurposing in chemical
genomics: Can we learn from the past to
improve the future?. Curr Top Med Chem.
2012, 12 (17), pp.1883-1888.
6. Dudley J.T, Deshpande T, Butte A.J.
Exploiting drug-disease relationships for
computational drug repositioning. Briefings in
Bioinformatics. 2011, 12 (4), pp.303-311.
7. Huang H, Xiaogang W, Ibrahim S,
Kenzie M.M, Chen J.Y. Predicting drug
efficacy based on the integrated breast cancer
pathway model. 2011 IEEE International
Workshop on Genomic Signal Processing
and Statistics (GENSIPS): 4 - 6 Dec. 2011
San Antonio. TX. 2011, pp.42-45.
8. Nguyen T.M, Muhammad S.A, Guo J,
Ibrahim S, Ma L, Bai B, Zeng B. DeCoSTT:
A new approach in drug repurposing from
control
system
theory.
Frontiers
in
Pharmacology. 2018, 9, p.583.
9. You Q, Fang S, Chen J. GeneTerrain:
Visual exploration of differential gene expression
profiles organized in native biomolecular
interaction networks. Inform Visualization.
2010, 9, pp.1-12.
10. Kanehisa M, Furumichi M, Tanabe M,
Sato Y, Morishima K. KEGG: new perspectives
on genomes, pathways, diseases and drugs.
Nucleic Acids Research. 2017, 45 (D1),
pp.D353-D361.
11
Journal of military pharmaco-medicine no1-2019
ADVANCES IN THE DIAGNOSIS OF
NON-SMALL CELL LUNG CANCER: A REVIEW
Ta Ba Thang1; Pham Thi Kim Nhung1
SUMMARY
Lung cancer is the second most commonly diagnosed cancer and remains the leading
cause of cancer deaths worldwide. This is often due to lung cancer first presenting at late
stages and a lack of curative therapeutic options at these later stages. Radiography and sputum
cytology as the screening modalities to early diagnosis of lung cancer but low sensitivity.
Advances in the knowledge of the biology of lung cancer have revealed molecular information
used for early diagnosis, with an important impact on patients overall survival and quality of life.
The recent years, many new techniques are applied in early diagnosis of lung cancer such as:
new imaging techniques, advanced bronchoscopy, liquid biopsy. There technologies used and
their potential use for non-invasive screening, early diagnosis, prognosis, response to treatment
and real time monitoring of the disease, in lung cancer patients.
* Keywords: Lung cancer; Non-small cell lung cancer; New bronchoscopy; Liquid biopsy;
Advances in diagnosis.
INTRODUCTION
Lung cancer is the most common
cancer in the world and is the commonest
cause of cancer-related death. Audits of
patients presenting with lung cancer to
hospitals have shown that, at the time of
diagnosis, approximately 70% of cases
are at an advanced stage (stage IIIB or IV)
[4, 5]. Early diagnosis can improve survival.
Previous studies showed that using chest
radiography and sputum cytology as the
screening modalities failed to achieve any
significant reduction in lung cancer
mortality [4, 10]. In the recent years, many
new techniques were applied in early
diagnosis of lung cancer such as: new
imaging technique and bronchoscopy,
liquid biopsies. These techniques can
detect early stage asymptomatic lung
cancer in high risk peoples, increase the
sensitivity of diagnosis and improve
survival of lung cancer patients [10, 11]. In
this paper we review some new techniques
in diagnosis of lung cancer.
LOW DOSE SPIRAL
COMPUTERIZED TOMOGRAPHY
The development of low dose spiral
computed tomographic (LDCT) imaging
has resulted in a resurgence of interest in
screening for lung cancer. A LDCT scan
is different from a regular computed
tomography (CT) scan: the amount of
radiation emitted is over five times lower
1. 103 Military Hospital
Corresponding author: Ta Ba Thang ()
Date received: 20/10/2018
Date accepted: 30/11/2018
12
Journal of military pharmaco-medicine no1-2019
than regular CT-scan. LDCT is a more
sensitive screening tool for small tumours
and can detect early stage asymptomatic
lung cancer in a high risk population. The
National Lung Cancer Screening Trial
demonstrated a reduction in mortality with
LDCT annually for 3 years, a median
duration of follow-up of 6.5 years. The
incidence of lung cancer in the LDCT
group was 645 cases per 100,000 person
years compared with 572 cases per
100,000 person years in the chest X-ray
(CXR) group. LDCT can detect more lung
cancers at earlier stages compared with
CXR, which results in a significant
reduction in mortality. Studies from Japan
created excitement in suggesting the
viability of LDCT as a tool for early lung
cancer detection. The first report was from
Kaneko and colleagues, who screened
1,369 high-risk participants with both
LDCT and CXR. LDCT detected 15 cases
of peripheral lung cancer while 11 of these
were missed on chest radiography [2].
Sone and colleagues authored the
second report in the literature, with 3,958
participants screened with both LDCT and
CXR. Only 4 lung cancers were detected
by CXR whereas 19 were seen on LDCT;
84% were stage I at resection. In the
United States, Henschke and colleagues
with the Early Lung Cancer Action Project:
This study enrolled 1,000 high-risk
participants and screened with both
LDCT and CXR; initial results: A total of
27 prevalence lung cancers were
detected by LDCT; only 7 of those were
seen by CXR [4, 5]. The ITALUNG study
is under way in Italy, where in 3,206
participants have been randomized to LDCT
versus no screening. The baseline LDCT
was positive (defined as a pulmonary
nodule > 5 mm) in 426 (30.3%) of 1,406
subjects. 21% of lung cancers were
diagnosed in 20 participants (prevalence
1.5%); 10 (47.6%) were stage I [12].
NEW BRONCHOSCOPY TECHNIQUES
1. Autofluorescence bronchoscopy
Autofluorescence bronchoscopy (AFB),
which combines autofluorescence imaging
with white light bronchoscopy (WLB),
utilizes spectral differences in fluorescence
and absorption to distinguish between
normal and dysplastic bronchial epithelium.
Recent advances include the use of a
combination of reflectance and fluorescence
[10, 11]. AFB helps early diagnosis and
increases the sensitivity of lung cancer
diagnosis. The sensitivity of WLB is 9 - 58%,
whereas AFB with a sensitivity of 44 82%. However, the specificity of AFB is
only 46 - 75%, compared with 62 - 95%
for WLB. The use of a quantitative score
during autofluorescence imaging has been
shown to improve specificity.
2. Narrow-band imaging bronchoscopy.
The technique of narrow-band imaging
bronchoscopy (NBI) uses a narrow-band
filter rather than the conventional, broad,
redgreen-blue filter used in standard
videoendoscopes. NBI uses three narrow
bands: 400 - 430 nm (blue, covering
hemoglobin absorption at 410 nm), 420 470 nm (blue), and 560 - 590 nm (green).
Blue light has a short wavelength,
reaches into the bronchial submucosa,
and is absorbed by hemoglobin. This
technique provides images of microvessels
that are more accurate than are those
obtained
with
high-magnification
video-endoscopy using broadband RGB
technology. The rate of detection of
13
Journal of military pharmaco-medicine no1-2019
dysplasia/malignancy obtained with the
NBI-WLB combination seems to be higher
than that obtained with WLB alone [11,
12]. NBI increases the specificity of
bronchoscopy.
3.
Endobronchial
bronchoscopy.
ultrasound
Endobronchial ultrasound bronchoscopy
(EBUS) is a technique that uses ultrasound
along with bronchoscopy to visualize
airway wall and structures adjacent to it.
EBUS has been incorporated into routine
practice in many centers because of its
high diagnostic informative value and low
risk. It may replace more invasive methods
for staging lung cancer or for evaluating
mediastinal lymphadenopathy and lesions
in the future. There are two types of
EBUS: Radial probe and convex probe
EBUS. EBUS with transbronchial needle
aspiration (TBNA) has high sensitivity and
specificity for identifying malignancy in
mediastinal and hilar lymph nodes in
patients with lung cancer and also has a
high sensitivity for identifying malignancy
when used for sampling paratracheal and
peribronchial parenchymal lung masses [11].
One of the early studies utilizing EBUS
achieved a sensitivity of 94% and
specificity of 100% when compared with
operative findings. In a prospective
comparison of CT, PET, and EBUS in
102 Japanese patients, EBUS had a much
higher sensitivity and specificity of 92.3%
and 100%, respectively, compared with
PET, which was 80% sensitive and 70.1%
specific, respectively. A meta-analysis of
11 studies with 1,299 patients who
underwent EBUS found a pooled
sensitivity and specificity of EBUS of 93%
and 100%, respectively. The sensitivity of
14
EBUS increased to 94% in a subgroup of
patients selected with imaging compared
with only 76% in patients who had no PET
or CT selection. The use of EBUS and
EUS (esophageal ultrasound) alone resulted
in similar sensitivity to surgical staging
at 85% (95%CI, 74 - 92%) [12]. The
combination strategy also reduced the
number of futile thoracotomies by more
than half (18% in mediastinoscopy group
versus 7% in combination group). The
use of PET and EBUS has revolutionized
the management of early-stage lung
cancer and improved surgical outcomes
by optimizing patient selection. The cytology
specimens of (EBUS-TBNA) are not only
sufficient for histological assessment of
lung tumours but also for molecular
testing. Reported diagnostic accuracy of
EBUS-TBNA in restaging is 95.1% [11].
4. Electromagnetic
bronchoscopy.
navigational
Electromagnetic navigational bronchoscopy
(ENB) combines conventional and virtual
bronchoscopy to enable the guidance of
bronchoscopic instruments to target areas
within the peripheral lung parenchyma.
ENB consists of a low dose electromagnetic
field created around the patient; software
that creates a three-dimensional (3D)
virtual bronchial tree; a sensor device with
navigational capacity that can be located
within the magnetic feld; an interface to
display the position of the sensor within
the yield and input desired target location;
an extended working channel (EWC) that
enables accurate placement of ancillary
bronchoscopic tools, such as brush,
biopsy forceps into the target lesion [1].
An open-label, prospective, single-group,
controlled clinical study with 15 patients
Journal of military pharmaco-medicine no1-2019
demonstrated a 69% diagnostic yield. In
this study, the majority of these lesions
were diagnosed as NSCLC [3]. A recent
meta-analysis of 15 trials with a total of
1,033 nodules found a definitive diagnosis
was obtained in 64.9% procedures. The
sensitivity to detect cancer was 71.1%
(95%CI: 64.6 - 76.8%), with a negative
predictive value of 52.1% (95%CI: 43.5 60.6%) [1].
5. High-magnification videoendoscopy.
The high-magnification Exera endoscopy
combines fiberoptic and video-endoscopic
technologies to produce images of the
bronchial wall at a magnification up to 110
times greater than that obtained with
standard video-endoscopy. This enables
the visualization of microvascular networks
in the bronchial mucosa. Increased vessel
density in the bronchial submucosa, which
is often presented in squamous dysplasia,
might play an early role in cancer
pathogenesis [10, 11].
6. Optical coherence tomography.
Optical coherence tomography (OCT)
is an optical imaging method that offers
microscopic resolution for visualizing
structures at or below the tissue surface.
it uses near-infrared light (rather than
sound waves), which is applied via a
small probe inserted into the working
channel of a bronchoscopy. Because the
velocity of light is far greater than that of
sound, the light reflected back from the
structures within the tissue cannot be
detected electronically, so it is detected
with a technique known as low-coherence
interferometry. An advantage of this
technique is that light waves, unlike sound
waves, do not require a coupling medium
(liquid or gel), which makes OCT ideal
for use in the airways. In addition, OCT
creates
images
of
cellular
and
extracellular structures by analyzing the
backscattered light, with a spatial
resolution of approximately 3 - 15 µm and
a depth penetration of ~ 2 mm, to provide
near-histological images of the bronchial
wall. Early studies showed that OCT can
distinguish dysplasia from metaplasia,
hyperplasia, and normal tissue, as well as
distinguishing between cancer in situ and
invasive cancer.
7.
Confocal
endomicroscopy.
fluorescence
The principle by which confocal microscopy
images a thin slide of a sample relies on
both the use of a narrow point source on
the illumination path and of a small
aperture or pinhole on the light detection
path. According to this principle, a laser
source (the point source) focuses on a
single spot in the sample, and the light
emitted from this focal point is imaged
through the pinhole onto a detector. This
results in the rejection of the light coming
from depth adjacent to the focal plane
region, and therefore of out-of-focus
information from the material above and
below a very thin plane of focus. Confocal
endomicroscopes aim at providing to the
clinician ‘‘optical biopsies,’’ that is, in vivo
microscopic imaging of living tissue [8].
Proximal bronchial exploration and potential
applications for distal lung imaging.
LIQUID BIOPSY
1. Circulating tumor DNA.
Circulating free DNA (cfDNA) can be
found dissolved in plasma and serum, at
variable amounts. In the case of cancer
patients, a fraction of the cfDNA is tumor
15
Journal of military pharmaco-medicine no1-2019
derived, and ctDNA represents from less
than 0.1% to more than 10% of the total
cfDNA. This percentage has been shown
to depend on stage, tumor burden,
vascularization of the tumor, biological
features like apoptotic rate and metastatic
potential of the cancer cells. The ctDNA
carries the same somatic alterations as
the tumor itself and can be used to detect
clinically relevant mutations such as those
in the epidermal growth factor (EGFR) or
KRAS genes. The European Medicine
Agency recommends EGFR testing in
liquid biopsies to select patients for
tyrosine kinase inhibitor (TKI) therapy [6].
Modifed real-time PCR techniques have
been widely used to identify genetic
alterations in the cfDNA of cancer patients:
Amplifcation-refractory mutation system,
Scorpion-ARMS [11], and peptide nucleic
acid or locked nucleic acid mutant-enriched
PCR.
2. Circulating tumor RNA.
RNA derived from tumor cells (ctRNA)
is present in the plasma of cancer patients
and can be used for detection of the
clinically relevant ALK, ROS1, and RET
fusion genes and MET∆14 splicing variant.
However, genetic analyses in cfRNA have
not been widely used. The recent study
has a 5-year experience in detection of
EML4-ALK fusion transcripts in plasma
cfRNA by retrotranscription PCR (RT-PCR)
[7] and, using improved processing and
purifcation methods, have demonstrated
that the sensitivity of the technique can be
signifcantly improved.
3. Tumor educated platelets.
Platelets have been recently demonstrated
to sequester tumor RNA by a microvesicle
16
dependent mechanism, and the socalled
TEPs can be used as source of tumor
RNA for genetic analysis. Platelets can be
isolated from blood by simple centrifugation
steps, and its RNA content easily purifed
and used for the detection of gene fusions
and splicing variants. EML4-ALK fusion
transcripts in TEP RNA from advanced
lung cancer patients with 65% sensitivity
and 100% specificity [6, 7]. The disappearance
of fusion transcripts in platelets correlates
with response to crizotinib treatment.
Platelet RNA can also be analyzed by
multiplexing techniques, and a recent
report has demonstrated the diagnostic
potential of this approach. Using mRNA
sequencing and surrogate TEP RNA
profiles of 283 samples, 228 cancer
patients of six different origins were
discriminated from 55 healthy individuals
with 96% accuracy.
4. Exosomes.
Exosomes are small vesicles present
in blood and other body fluids (62 - 64).
With a 30 - 100 nm diameter, they are
constitutively released through exocytosis
by many cells, including tumor cells, in
physiological and pathological conditions.
Exosomes contain lipids, proteins, mRNA,
several types of non-coding RNAs, and
double-stranded DNA; and their composition
partly reflects that of the parental cells [6].
Exosomes are generally isolated by sucrose
gradient ultracentrifugation or immunebead isolation techniques. Once isolated,
exosomes are characterized by transmission
electron microscopy, Western blot, FACS,
or other methodologies (67). EML4-ALK
fusion transcripts have been recently
identifed in the exosomal RNA of
Journal of military pharmaco-medicine no1-2019
NSCLC patients [7]. Some studies
indicate that micro RNA (miRNA) analysis
of exosomes might be useful for the
diagnosis of lung adenocarcinoma (69 - 71)
and that particular miRNAs can offer
prognostic information in advanced NSCLC.
4. Circulating tumor cells.
Circulating tumor cells (CTCs) are the
most widely investigated material in liquid
biopsies of cancer patients. In advanced
NSCLC patients, CTCs are relatively rare,
1 - 10 per mL against a background of
106 - 107 peripheral blood mononuclear
cells. This low abundance poses formidable
challenges for the development of robust
and sensitive enrichment protocols [6, 7].
Some CTC capture methods are label
dependent, based on specific epithelial
cell surface markers, such as epithelial
cell adhesion molecule (EpCAM) for
positive selection or CD45 for negative
depletion (the CellSearch® system). In
advanced NSCLC, CellSearch® has shown
a limited detection effciency, with CTCs
detectable in only 20 - 40% of patients.
Isolation by size of epithelial tumor cells
(ISET®, Rarecells), based on fltration and
cytological characterization has shown an
increased sensitivity in NSCLC (89 - 92)
with an 80% detection rate of CTCs in blood
from stage IIIA - IV patients compared
with 23% using CellSearch® [7].
REFERENCES
1. Gex G, Pralong J.A, Combescure C et al.
Diagnostic yield and safety of electromagnetic
navigation bronchoscopy for lung nodules:
a systematic review and meta-analysis.
Respiration. 2014, 87, pp.165-176.
2. Schreiber G, McCrory D.C. Performance
characteristics of different modalities for
diagnosis of suspected lung cancer: Summary
of published evidence. Chest. 2003, 123,
pp.115S-128S.
3. Goud A, Dahagam C. Breen P.D, Sarkar
S. Role of electromagnetic navigational
bronchoscopy in pulmonary nodule management.
J Thorac Dis. 2016, 8 (Suppl 6), pp.S501-S508.
4. Midthun D.E. Screening for lung cancer.
Clin Chest Med. 2011, 32, pp.659-668.
5. Daniels J.M.A, de Oliveira G.H, Sutedja
T.G. Early detection and treatment of squamous
cell lung cancer. Pulmao RJ. 2011, 20 (2),
pp.19-24.
6. Ansari J, Yun J.W, Kompelli A.R. The
liquid biopsy in lung cancer. Genes & Cancer.
2016, November, Vol. 7 (11 - 12).
7. Czrnecka-Kujawa K, Yasufuku K.
Molecular alterations in non-small-cell lung
cancer: Perspective for targeted therapy and
specimen management for the bronchoscopist.
Respirology. 2014, 19, pp.1117-1125.
8. Thiberville L, Salau¨n M, Lachkar S,
Dominique S. Confocal fluorescence
endomicroscopy of the human airways. Proc
Am Thorac Soc. 2009, Vol. 6, pp.444-449.
9. Molina-Vila M.A, Mayo-de-las-Casas C,
Giménez-Capitán A. Liquid biopsy in nonsmall cell lung cancer. Frontiers in Medicine.
2016, December, Vol. 3.
10. Pillai R.N, Ramalingam S.S. Advances
in the diagnosis and treatment of non-small
cell lung cancer. Mol Cancer Ther. 2014,
March, 13 (3).
11. Belanger A.R, Akulian J.A. An update
on the role of advanced diagnostic
bronchoscopy in the evaluation and staging of
lung cancer. Ther Adv Respir Dis. 2017, 11 (5),
pp.211-221.
12. Fischer B, Lassen U, Mortensen J,
Larsen S, Loft A, Bertelsen A et al.
Preoperative staging of lung cancer with
combined PET-CT. N Engl J Med. 2009, 361,
pp.32-39.
17