Ebook Master visual diagnosis of ECG - A short atlas: Part 2
Bạn đang xem bản rút gọn của tài liệu. Xem và tải ngay bản đầy đủ của tài liệu tại đây (10.53 MB, 163 trang )
Section 2:
Quick Diagnosis Section (QDS)
QUICK DIAGNOSIS SECTION (QDS)
This section will present diagnosis in the forms of diagnostic points and supporting points so that reader can
quickly make diagnosis rather than searching from rich text.
These points are divided into two categories. Diagnostic points which are more specific to diagnosis and
supporting points which support the diagnosis.
HOW TO READ ECG AND MAKE DIAGNOSIS?
Five-Finger Method
Five-finger method is easy method which enables to gauge ECG
from every aspect. Initially, it looks a little long but after sometime, it will become your habit to look upon every point of ECG
and will be much quick. And do not miss any diagnosis because
usually single ECG has more than one diagnosis (Fig. 2.1).
The three segments of every finger represent features of ECG.
So total 15 features to be noted. So let’s begin.
These features are:
1. Check lead positions and exclude dextrocardia.
2. Rhythm
3. Rate
4. QRS interval
5. PR interval
6. Exclude other conditions including ‘WPW’ syndrome
(specially if QRS duration is >0.12 sec.
7. ST segment
Figure 2.1: Fifteen-finger segments to remember 15 features of ECG (See text)
68
8.
9.
10.
11.
12.
13.
14.
15.
Master Visual Diagnosis of ECG: A Short Atlas
Q wave
R wave progression
P wave
T wave
Axis and block (bundle branch blocks and fascicular blocks)
Hypertrophy
Miscellaneous conditions (See later)
Detailed arrhythmia analyses
Step 1: Check lead positions and exclude dextrocardia.
It is wise to look for and rule out possible technical errors in placing leads. See details later.
Step 2: Rhythm
Check for sinus rhythm; if not check for arrhythmia (jump step 15)
Step 3: Rate
Calculate heart rate.
Step 4: QRS interval
Assess QRS both in lead V1 and V6 for interval and shape in order to diagnose bundle branch blocks, if > 0.12
sec BBB (complete or incomplete) may be present. For shape, look for M or W shape pattern.
(For diagnosis criteria see later).
Step 5: PR interval
Assess PR interval, if abnormal (>0.2 sec). Check for AV blocks (see later portion) if less (<0.12) check for
delta wave and WPW syndrome.
Step 6: Exclude other conditions including WPW syndrome if QRS > 0.12 sec
According to some authors, it is wise after QRS and PR analysis, exclude non-specific causes of intra-ventricular
conduction delay, WPW syndrome, electrical pacing and Brugada syndrome, etc. (See diagnostic points later).
These conditions are rare but often missed and causes death.
Step 7: ST segment
Assess ST segment for abnormality, i.e. depression or elevation (See Tables 1.4 and 1.5).
Look changes suggesting Infarction, Ischemia, etc.
Step 8: Q wave
Then look every lead for Q wave for MI diagnosis and determining its age as acute, intermediate or chronic.
Quick Diagnosis Section (QDS)
69
Step 9: R wave progression
To identify anterior, posterior infarction and BBB or other condition assess R wave in V1–V6 and also its
progression. Also check whether normally progressing R wave suddenly disappears or not.
Step 10: P wave
Assess P wave for its shape, look every P wave is followed by QRS or not, P wave inversion. This will also
help in diagnosing hypertrophy of left and right atrium, right atrial hypertrophy, left atrial hypertrophy and
arrhythmia. Pay special stress on lead II and V1.
Step 11: T wave
Assess T wave for inversion, its amplitude (tall, flat, etc.) for making some diagnosis (like post infarction,
hypercalcemia, hypokalemia, etc.) and strengthening diagnosis of MI and Ischemia (See Tables 1.3 and 1.4).
Step 12: Axis and Block (bundle branch blocks and fascicular blocks)
Check axis by simple 2-step method and check for left anterior, left posterior fasicular block/hemi block.
Step 13: RVH, LVH check
Criteria for diagnosis RVH and LVH are presented in later discussion.
Step 14: Miscellaneous condition
Check for miscellaneous condition like electrolyte imbalance (hypokalemia, hyperkalemia, hypercalcemia,
etc.), cardiac pathologies (pulmonary embolism, ASD, long QT syndrome) drug effects like digitalis and
electrical pacing, etc.
Step 15: Detailed arrhythmia analyses
If sinus rhythm is not found, detailed scrutiny for arrhythmia is mandatory and this step should be considered
in step 2 instead.
Although, this list took long but by finger counting method, you will easily pick these and can’t miss, for
example; when you are on step 4 on ST segment an elevated ST segment (with concavity upward) in most
leads will recall you to think pericarditis!!
LEAD POSITION REVERSAL
Most common error in lead placement is reversal from right arm to left arm. Therefore, it is wise before embarking on ECG just look that ECG is technically OK or not (it is easy).
70
Master Visual Diagnosis of ECG: A Short Atlas
Diagnostic Points
1.
2.
3.
4.
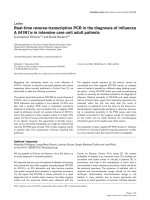
Lead I shows negative QRS while lead aVR shows positive QRS (normally it is negative).
Lead aVL and aVR transposed (therefore now lead aVL is negative instead of aVR).
Lead II and III are transposed (Fig. 2.2).
Limb leads aVF and V1–V6 are not affected (this differentiates from dextrocardia where precordial leads
are also reversed) [see Dextrocardia].
Figure 2.2: Incorrect lead placement with a right to left arm reversal. Note lead I is negative while aVR is surprisingly positive.
In fact aVR and aVl are reversed. Similarly II and III are reversed, importantly also note that precordial leads are unchanged
which is not the case in dextrocardia where both limb leads and precordial both have reversed configuration
Quick Diagnosis Section (QDS)
71
DETERMINE RATE/RHYTHM
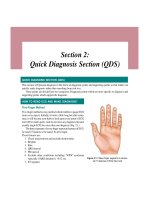
Rate
Heart rate >100 beats per minute (bpm) = tachycardia; Heart rate <60 bpm = bradycardia.
a. Determination of rate is not difficult. Note these rates are counted when ECG paper speed setting is
25 mm/sec which is used universally. Count number of large boxes between two consecutive R waves.
Number of large boxes show rate. For convenience choose R wave which falls on the bold line of ECG
strip (Table 2.1).
b. If rate is high enough that only one or less than one large box is there between two R waves, the number
of small box also corresponds to the rate as in Table 2.1.
c. If rate is irregular, it is better to count QRS complexes in one minute interval. One large box equals to 0.2
sec, 5 large boxes equal to 1 sec. So count QRS in 6 seconds then multiply it by 10 to get rate in one minute
(6 second × 10=1 minute). For any condition rate is: rate = 1500 divided by number of small squares
between two RR intervals (Fig. 2.3).
Table 2.1: Number of large boxes and small boxes between two consecutive R waves and approximate heart rates
Number of large boxes
Rates bpm
1
2
3
4
5
6
7
8
9
300
150
100
75
60
50
42
30
33
1
2
3
4
Number of small boxes
2
3
4
5
6
7
8
9
5
Rates bpm
750
500
375
300
250
214
107
166
6
QRS in 6 sec. + 10; 10 × 10 = 100 bpm
Figure 2.3: Showing determination of heart rate by calculating QRS complexes in 6 seconds strip
72
Master Visual Diagnosis of ECG: A Short Atlas
Rhythm
This step may be simple of course if rhythm is regular and derived by SA (sinoatrial) node called sinus rhythm;
(Table 2.2). Focus on V1 and II for best visualization of P wave. Presence of sinus P wave means impulse
generating from atrium and rhythm is regarded as sinus rhythm (recall that positive P wave in lead I and II
and negative P wave in lead aVR indicates that impulse is generating from sinus node which is called as sinus
P wave and rhythm is called as sinus rhythm. Retrograde or inverted P wave indicate its origin from sources
other than sinus node and it is regarded as ectopic P wave. In the absence of sinus rhythm this step II becomes
most important (irregular rhythm or arrhythmia). See step 15 of our five-finger method (note if arrhythmia is
suspected this step should be considered at this stage, i.e. step 2) (See arrhythmia portion).
SINUS RHYTHM
Diagnostic Points (Fig. 2.4)
•
•
•
•
The rate is within regular range (60–100 bpm).
Every QRS is preceded by P wave and every P wave is followed by a P wave (which rules out AV block).
P wave morphology and PR interval fairly constant.
PP interval and RR interval also remains constant (equidistant) (Interestingly PP = RR).
Table 2.2: Assessment of P wave in ECG and its outcome
P wave
Present
Absent
Sinus rhythm
Abnormal rhythm
Arrhythmic assessment
Bradyarrhythmia
Wide QRS tachycardia
Tachyarrhythmia
Narrow QRS tachycardia
Ventricular premature contraction
(VPC)
Atrial premature contraction
(APC)
Quick Diagnosis Section (QDS)
73
Figure 2.4: Normal sinus rhythm. Note presence of P waves and PP interval are equidistant and equal to RR interval
SINUS BRADYCARDIA
Diagnostic Points (Fig. 2.5A)
•
•
•
•
Presence of sinus P wave before QRS complex if it is not sinus P wave it is escape rhythm.
Sinus rate < 60 bpm
Constant PR interval of normal duration
P-P interval same to R-R interval and constant (may be slightly irregular).
SINUS TACHYCARDIA
Same above except rate >100 bpm (Fig. 2.5B).
74
Master Visual Diagnosis of ECG: A Short Atlas
A
B
Figures 2.5A and B: Example of sinus bradycardia around 50 bpm (A) and sinus tachycardia around 125 bpm (B)
DEXTROCARDIA
Dextrocardia with Situs inversus is congenital defect and is rare (1:10,000).
Diagnostic Points (See Fig. 2.2)
•
•
•
Lead I, P, QRS, T waves are negative (downward).
Lead aVR and aVL are interposed, i.e. aVR is positive and aVL is negative (so lead I + AVL both negative).
R wave shows inverse progression, i.e. it is tallest in V1 and decrease toward V6.
Note in right arm to left arm reversal chest leads are spared and show normal R wave progression.
ATRIOVENTRICULAR BLOCK (AV BLOCK)
Wiring diagram of the heart (below) shows current flow can be interrupted anywhere and this interruption
manifests as blocks (AV block, bundle branch block) in ECG. Important blocks are discussed below (Fig. 2.6).
Quick Diagnosis Section (QDS)
75
Batchmann’s
bundle
Ectopic
foci atrium
Left anterior
fascicle
Bundle of His
SA block
SA node
Internodal
tract
Left bundle
branch
AV node
Left posterior
fascicle
Ectopic
foci ventricle
1. Mobitz type I AV block
2. Mobitz type II AV block
3. Left bundle branch block
4. Left anterior fascicular
block
5. Right bundle branch block
6. Left posterior fascicular
block
7. SA block
Right bundle
branch
Figure 2.6: Wiring diagram of heart. Note interruption at different positions manifest as different type of blocks. Note that
Mobitz type I is located higher almost always in AV node and Mobitz type II in lower position, usually in initial part of bundle
branch and, therefore, QRS may be broaden or normal. Type II is more serious than type I
First Degree AV Block
Diagnostic Points (Figs 2.7 and 2.8)
•
•
•
PR interval more than 0.2 sec (>5 small boxes).
PR interval is constant.
Every P is followed by QRS complex.
76
Master Visual Diagnosis of ECG: A Short Atlas
Figure 2.7: Sinus rhythm with first degree AV block. Note prolonged PR interval
A
B
C
Figures 2.8A to C: First degree AV block. Prolonged PR interval (greater than 0.12 sec)
Quick Diagnosis Section (QDS)
77
Second Degree AV Block; Mobitz Type I (Wenckebach) Block
Diagnostic Points (Figs 2.9 to 2.11)
•
•
•
Progressive increase in PR interval until impulse fails to conduct to ventricle and P wave is not followed
by QRS (blocked P).
Recovery after blocked P wave is always with short PR interval.
The RR interval containing blocked P is less than sum of two consecutive RR interval before the dropped
QRS. This is because after blocked P wave the next PR interval is always shorter.
PR interval after
blocked P wave is
shorter
Gradually increasing PR
interval
Blocked P
wave
RR interval
containing
blocked P wave is
shorter than
two consecutive
PP interval
before it
Figure 2.9: Showing second degree AV block. Also note that PP interval is constant
•
•
PP interval is constant (this may be overlooked, but every P originates in constant time interval and it is
QRS which is pushed toward next P wave so increased PR).
QRS complex is usually narrow because block is high (if type II).
78
•
•
Master Visual Diagnosis of ECG: A Short Atlas
RR interval gradually decreases (if present also typical for Wenckebach) but may be same or increases)
Sometimes it presents with 2:1 block (pairs) in this situation we cannot differentiate whether there is
gradual increase in the PR interval or not. Therefore, we cannot differentiate between type 1 and type 2.
A
B
C
D
Figures 2.10A to D: Different examples of second degree AV block Mobitz type 1. Note gradual prolongation of PR interval until P wave is blocked (failed to conduct)
Quick Diagnosis Section (QDS)
79
Figure 2.11: Second degree AV block Mobitz type 1. Note PR interval gradually increased until P wave is blocked (Wenckebach periodicity). Note after the blocked P wave PR interval is short. RR interval containing blocked P wave is smaller than
the two consecutive PP interval. This ECG also shows inferior MI and posterior wall involvement
Second Degrees AV Block (Mobitz Type II) (Figs 2.12 and 2.13)
As described earlier here the site of block is lower than type I, i.e. in the initial portion of bundle branch
• At least two regular and consecutive atrial impulses are conducted with constant PR interval.
• A blocked (nonconducted P wave without QRS) sinus impulse.
• PR interval after the block is same as previous PR interval.
• Because of above fact, RR interval containing nonconducted P wave is equal to two RR interval (in other
words, twice the heart rate compare; type I where it is shorter than the sum of two consecutive RR interval
before the dropped QRS).
80
Master Visual Diagnosis of ECG: A Short Atlas
Supporting Points
•
•
•
•
Since block is at the bundle of His or below it in the bundle branch QRS maybe > 0.12 sec ( cf. type I
where AV node is blocked) (Fig. 2.12D).
High grade second degree AV blocks two or more consecutive P may be blocked.
This is worse than type I Mobitz with bad prognosis with risk of catastrophic a systole = 36 percent approximately.
If rate 2:1 you cannot surely diagnose it because you cannot check PR interval for gradual increase or
constant.
A
B
C
D
Figures 2.12A to D: Different examples of second degree AV blocks Mobitz Type II. Note also PR interval before
and after the dropped P wave is same
Quick Diagnosis Section (QDS)
81
Figure 2.13: Second degree AV block Mobitz type II. 2:1 conduction, identical PR interval with one P wave blocked and
broad QRS complex are the clues
Complete AV, or Third Degree Block
Diagnostic Points (Figs 2.14 and 2.15)
•
•
•
AV conduction is completely blocked so atrial impulses do not deliver to ventricle and ventricle contracts
its own. This is called AV dissociation, i.e. no relationship between atria and ventricle.
Ventricle rate around 45/min (if impulse arise from AV junction rate may be higher).
RR is constant. Note atrial rate > ventricular rate (this condition is reversed if AV dissociation is present
in the absence of third degree AV block)
82
Master Visual Diagnosis of ECG: A Short Atlas
Figure 2.14: Complete third degrees AV block idioventricular AV escape rhythm 30 bpm. In AV dissociation (atrial rate (AR)
>ventricular rate (VR) which differentiates it from other forms of AV dissociation where VR > AR. Also note RBBB morphology
Figure 2.15: Third degree; complete AV block with junctional escape rhythm. Arrows show P wave, note AV dissociation
Quick Diagnosis Section (QDS)
83
INTRODUCTION TO ELECTROCARIOGRAPHIC FEATURES OF MYOCARDIAL INFARCTION
Myocardial Infarction (MI)
Area suffering MI and leads showing changes depends on the coronary arteries involved (Fig. 2.16).
Left coronary artery
Posterior MI, posterior wall
are supplied by right
coronary artery (RCA) or
distal left circumflex artery.
Tall R wave in V1
(may also V2)
Right coronary artery
Acute marginal artery
right ventricular MI,
Q wave, ST changes
in V1, V3R V4R
Circumflex artery
anterolateral MI, leads I
aVL, V4, V6, Q wave, ST
changes
Extensive
anterolateral
MI
Left anterior descending
artery anteroseptal MI, Q
wave,ST changes in leads
V1,V2,V3
Posterior descending artery
inferior wall MI, Q wave,
ST changes in II, III, aVF
Figure 2.16: Schematic diagram showing coronary arteries areas infarcted and leads changes
ST Elevation Infarction v/s Non ST Elevation MI or Q Wave v/s Non Q Wave MI
The outer portion of cardiac wall, subepicardium (thicker wall) gets blood from major branches of coronary
arteries. Coronary arteries obstruction results in infarction of entire wall, called transmural infarction and it
manifests with ST elevation and Q wave formation, this is called ST elevation MI or Q wave MI (STEMI).
Contrary to this the inner (thinner) layer subendocardial layer is supplied by smaller branches of the major
coronary arteries, also this is farther from the main arteries, also during from the contraction, and there is
more decrease in the blood supply. Therefore, subendocardium is more prone to infarction and here MI is
sub-endocardial. This infraction does not show ST elevation and Q wave (hence called non ST elevation MI,
NSTEMI, non Q wave MI) and may show pattern of ischemia (ST depression and T inversion) and need to
be verified by checking levels of cardiac enzymes to differentiate from ischemia (troponin T, INI , CKMB,
etc) (Figs 2.17A and B).
84
Master Visual Diagnosis of ECG: A Short Atlas
A
B
Figures 2.17A and B: STEMI and Q wave MI. (A) Shows prominent Q waves with ST elevation in leads II, III, aVF while
(B) Shows prominent ST elevation in the same leads in the case of inferior wall MI
Inferior Wall MI
Diagnostic Points (Figs 2.18 and 2.19)
•
•
•
•
•
ST segment elevation in leads II, III, aVF (acute MI).
ST reciprocal ST segment depression in lead I, aVL strengthens diagnosis.
Significant Q wave in II, III, AVF.
In old MI, ST - T segments should be in same line.
Area involved is inferior wall of LV + posterior part of intraventricular septum supplied by postdescending
coronary arteries (80% cases from RCM, 20% LCX.)
Quick Diagnosis Section (QDS)
85
Figure 2.18: A patient with complete AV block and junctional escape rhythm. Note ST elevation in leads II, III, aVF showing
acute inferior wall infarction. Leads I, aVL show ST depression with T wave inversion probably due to reciprocal changes
Figure 2.19: Inferior wall infarction of intermediate age. Note there are prominent Q waves along with ST elevation in leads
II, III, aVF. Tall R wave with R wave greater than S wave in leads V1V2 indicating posterior wall infarction also. ST depression
in leads I, aVL, V1–V6 shows reciprocal depression or lateral wall ischemia
86
Master Visual Diagnosis of ECG: A Short Atlas
Figure 2.20: Note prominent Q waves with slight ST elevation inferior wall MI. Lead V3 shows QS wave and Q waves
V4–V6 suggestive of anterolateral MI also. Note R in lead aVL+S wave in lead V3 greater than 20 mm in this woman suggest
LVH (Arrow shows VPC)
Anterior Infarction
Depending upon the arteries supplying the specific parts of heart muscle, anterior MI is named anterolateral,
anteroseptal or extensive anterior STEMI (Figs 2.20 to 2.22).
Anteroseptal or Anteroapical MI
Diagnostic Points
•
•
•
ST elevation V1–V3 (acute)
Q waves V1–V3
Evolving Q waves + settling ST segment.
Quick Diagnosis Section (QDS)
87
Supporting Points
•
•
•
T wave decreases V1–V3.
Reciprocal depression in other ECG leads.
Poor R progression especially if R wave present in V1 or V2 and then disappears or becomes smaller in
later leads.
– The cause is blockade of LAD artery causing infarction of inferior or anterior septum + medial anterior
wall of LV.
Figure 2.21: Acute anteroseptal MI. Note R wave is less than 3 mm and ST elevation in lead V1–V3
88
Master Visual Diagnosis of ECG: A Short Atlas
Figure 2.22: Note QS waves in V1–V2 and small R wave in V3 in a case of old anteroseptal MI. This ECG also shows VPC
(arrow) and fusion beat formed by fusion of supraventricular and ventricular premature conduction (arrowhead). Note fusion
beats have variable morphology because variation in the extent of fusion
Lateral Wall MI
Diagnostic Points (Figs 2.23 and 2.24)
•
•
•
ST elevation V4–V6 and or I, aVL (acute)
Q waves in V4–V6 (old)
Both Q wave and ST change in intermediate age MI.
– There is blockade of LCX artery causing infarction of anterolateral part of LV.
Quick Diagnosis Section (QDS)
89
Figure 2.23: This is an ECG of a patient with the diagnosis of aortic aneurysm. This ECG shows Q waves in leads II, III, aVF
and V4–V6 and QS wave in lead V3. Also note ST elevation in these leads (II, III, aVF, and V3–V6) while ST depression and
inverted T wave aVL. These findings are indicative of inferior wall MI of intermediate age and anterolateral MI of intermediate
age. Prominent Q wave with still ST segment elevated is suggestive of ventricular aneurysm. R wave in lead aVL+S wave
in lead V3 are greater than 20 mm in this woman which is suggestive of LVH. Arrow shows VPC. There is long QTc also
90
Master Visual Diagnosis of ECG: A Short Atlas
Figure 2.24: Note ST elevation in leads V4–V6 indicating anterolateral (better say lateral wall MI) wall infarction, in these
cases ST segment in leads I, aVL is also elevated but ST elevation in lead aVL is attenuated by simultaneous inferior all
infarction (look ST elevation in leads II, III, aVF) and shows reciprocally depression
Extensive Anterior Wall MI (Anterolateral MI)
Diagnostic Points (Figs 2.25 to 2.27)
•
•
ST changes or Q wave in eight or more leads (chest leads + limb leads), i.e. leads I, aVL and V1–V6.
LCX artery and LAD artery both may be blocked.
Quick Diagnosis Section (QDS)
91
Figure 2.25: Note Q waves in leads I, aVL and V4–V6 and poor R wave progression V1–V3. There is also slight ST elevation
in leads I, aVL and V1–V5. These changes are suggestive of recent extensive anterior and lateral wall infarction. Other findings are bradycardia and LVH (R wave in lead aVL+S wave in lead V3 is greater than 28 mm in this man)