Public transport planning with smart card data
Bạn đang xem bản rút gọn của tài liệu. Xem và tải ngay bản đầy đủ của tài liệu tại đây (30.07 MB, 275 trang )
i
Public Transport Planning
with
Smart Card Data
ii
iii
Public Transport Planning
with
Smart Card Data
Editors
Fumitaka Kurauchi
Department of Civil Engineering
Faculty of Engineering
Gifu University
Gifu, Japan
Jan-Dirk Schmöcker
Department of Urban Management
Graduate School of Engineering
Kyoto University
Kyoto, Japan
iv
CRC Press
Taylor & Francis Group
6000 Broken Sound Parkway NW, Suite 300
Boca Raton, FL 33487-2742
© 2017 by Taylor & Francis Group, LLC
CRC Press is an imprint of Taylor & Francis Group, an Informa business
No claim to original U.S. Government works
Printed on acid-free paper
Version Date: 20160725
International Standard Book Number-13: 978-1-4987-2658-0 (Hardback)
This book contains information obtained from authentic and highly regarded sources. Reasonable efforts
have been made to publish reliable data and information, but the author and publisher cannot assume
responsibility for the validity of all materials or the consequences of their use. The authors and publishers
have attempted to trace the copyright holders of all material reproduced in this publication and apologize
to copyright holders if permission to publish in this form has not been obtained. If any copyright material
has not been acknowledged please write and let us know so we may rectify in any future reprint.
Except as permitted under U.S. Copyright Law, no part of this book may be reprinted, reproduced,
transmitted, or utilized in any form by any electronic, mechanical, or other means, now known or
hereafter invented, including photocopying, microfilming, and recording, or in any information storage
or retrieval system, without written permission from the publishers.
For permission to photocopy or use material electronically from this work, please access www.copyright.
com ( or contact the Copyright Clearance Center, Inc. (CCC), 222 Rosewood
Drive, Danvers, MA 01923, 978-750-8400. CCC is a not-for-profit organization that provides licenses and
registration for a variety of users. For organizations that have been granted a photocopy license by the
CCC, a separate system of payment has been arranged.
Trademark Notice: Product or corporate names may be trademarks or registered trademarks, and are
used only for identification and explanation without intent to infringe.
Visit the Taylor & Francis Web site at
and the CRC Press Web site at
v
Preface
Collecting fares through “smart cards” is becoming standard in most
advanced public transport networks of major cities around the world.
Using such cards has advantages for users as well as operators. Whereas for
travellers smart cards are mainly increasing convenience, operators value
in particular the reduced money handling fees. Smart cards further make
it easier to integrate the fare systems of several operators within a city and
to split the revenues. The electronic tickets also make it easier to create
complex fare systems (time and space differentiated prices) and to give
incentives to frequent or irregular travellers. Less utilized though appear
to be the behavioural data collected through smart card data. The records,
even if anonymous, allow for a much better understanding of passengers’
travel behaviour as various literature has begun to demonstrate. This
information can be used for better service planning.
This book handles three major topics; how passenger behaviour can
be estimated using smart card data, how smart card data can be combined
with other trip databases, and how the public transport service level can be
better evaluated if smart card data are available. The book discusses theory
as well as applications from cities around the world.
September 2016
Fumitaka Kurauchi
Jan-Dirk Schmöcker
vi
vii
Contents
Preface ..................................................................................................................v
1. A
nOverviewonOpportunitiesandChallengesof
SmartCardDataAnalysis.............................................................................1
1. Introduction .................................................................................................1
2. Smart Card Systems and Data Features .................................................2
3. Analysis Challenges ..................................................................................5
4. Categorization of Potential Analysis using Smart Card Data ..............7
5. Book Overview, What is Missing and Conclusion.................................9
References ....................................................................................................11
Author Biography .......................................................................................11
Part1:EstimatingPassengerBehavior
2. TransitOrigin-DestinationEstimation..................................................... 15
1. Introduction ..............................................................................................15
2. General Principles .....................................................................................17
3. Inference of Destinations .........................................................................18
4. O-D Matrix Methods ................................................................................24
5. Journey and Tour Pattern Analysis ........................................................25
6. Areas for Future Research .......................................................................29
References ....................................................................................................30
Author Biography .......................................................................................35
3. DestinationandActivityEstimation........................................................37
1. Smart Card Use in Trip Destination and Activity Estimation ..........38
2. Smart Card Data Structure in Seoul ......................................................39
3. Methodology for Trip Destination Estimation .....................................41
4. Trip Purpose Imputation using Household Travel Survey ................43
5. Results and Discussion ............................................................................48
6. Illustration of Results with MATSim .....................................................50
7. Conclusion..................................................................................................51
viii
Contents
References ....................................................................................................52
Author Biography .......................................................................................53
4. ModellingTravelChoicesonPublicTransportSystemswith
Smart Card Data............................................................................................ 55
1. Introduction ..............................................................................................55
2. Theoretical Background ...........................................................................56
3. Modelling Behaviour with Smart Card Data........................................59
4. Case Study: Santiago, Chile .....................................................................63
5. Conclusion..................................................................................................68
Acknowledgements.......................................................................................68
References ....................................................................................................68
Author Biography ........................................................................................70
Part 2: Combining Smart Card Data with other Databases
5. CombinationofSmartCardDatawithPersonTripSurveyData.......73
1. Introduction ...............................................................................................73
2. Model ..........................................................................................................77
3. Empirical Analysis ....................................................................................82
4. Conclusion..................................................................................................90
References ....................................................................................................91
Author Biography .......................................................................................92
6. AMethodforConductingBefore-AfterAnalysesofTransit
UsebyLinkingSmartCardDataandSurveyResponses................... 93
1. Introduction ..............................................................................................94
2. Literature Review ......................................................................................94
3. Background ...............................................................................................96
4. Data Collection .........................................................................................96
5. Methodology..............................................................................................99
6. Evaluation of the Intervention ..............................................................103
7. Areas for Improvement and Future Research ....................................108
8. Conclusion................................................................................................109
Acknowledgements ....................................................................................109
References .................................................................................................. 110
Author Biography ..................................................................................... 110
7. M
ultipurposeSmartCardData:CaseStudyofShizuoka,Japan....113
1. Introduction .............................................................................................113
2. Multipurpose Smart Cards ....................................................................115
3. Case Study Area and Smart Card Data Overview.............................115
4. Overview of Collected Data .................................................................. 118
5. Stated Preference Survey on Sensitivity to Point System ................119
6. Conclusion................................................................................................129
References ..................................................................................................130
Author Biography .....................................................................................130
Contents
ix
8. UsingSmartCardDataforAgent–BasedTransportSimulation..... 133
1. Introduction .............................................................................................133
2. User Equilibrium and Public Transport in MATSim.........................135
3. CEPAS .......................................................................................................136
4. Method......................................................................................................138
5. Validation and Performance ..................................................................147
6. Application ...............................................................................................154
7. Conclusion................................................................................................157
Acknowledgements.....................................................................................158
References ..................................................................................................158
Author Biography ......................................................................................159
Part3:SmartCardSataforEvaluation
9. SmartCardDataforWiderTransportSystemEvaluation..................163
1. Introduction ............................................................................................163
2. Level of Service Indicators .....................................................................164
3. Application to Santiago ..........................................................................166
4. Conclusion................................................................................................176
Acknowledgements.....................................................................................177
References ..................................................................................................177
Authors Biography ....................................................................................178
10.EvaluationofBusServiceKeyPerformanceIndicatorsusing
Smart Card Data...........................................................................................181
1. Introduction ............................................................................................181
2. Background .............................................................................................182
3. Information System ...............................................................................183
4. KPI Assessment .......................................................................................184
5. Some Examples........................................................................................186
6. Conclusion ...............................................................................................193
Acknowledgements.....................................................................................194
References ..................................................................................................194
Author Biography .....................................................................................196
11.RidershipEvaluationandPredictioninPublicTransportby
ProcessingSmartCardData:ADutchApproachandExample....... 197
1. Introduction ............................................................................................197
2. Smart Cards and Data ............................................................................199
3. Predicting Ridership by Smart Card Data ..........................................203
4. Case Study: The Tram Network of The Hague ..................................213
5. Conclusion................................................................................................219
Acknowledgements.....................................................................................221
References ..................................................................................................221
Author Biography ......................................................................................223
x
Contents
12.AssessmentofTrafficBottlenecksatBusStops................................... 225
1. Introduction ............................................................................................225
2. Background of this Study ......................................................................226
3. Development of Evaluation Measures .................................................227
4. Saitama City Case Study ........................................................................234
5. Conclusion ...............................................................................................242
Acknowledgements.....................................................................................242
References ..................................................................................................242
Author Biography .....................................................................................243
13.Conclusions:OpportunitiesProvidedtoTransitOrganizations
byAutomatedDataCollectionSystems,Challengesand
ThoughtsfortheFuture............................................................................ 245
1. Background ..............................................................................................246
2. Automated Data Collection Systems (ADCS).....................................247
3. A Conceptual Framework for ADCS in a Transit Organization ......249
4. Challenges ................................................................................................254
5. An Unexplored Area for Research Using Smart Card Data:
Elasticities and Pricing Strategy ............................................................256
6. Conclusions: Looking to the Future .....................................................259
Author Biography .....................................................................................260
Index ................................................................................................................263
Chapter 1: An Overview on Opportunities and Challenges of Smart Card Data Analysis
Chapter
1
1
An Overview on Opportunities
and Challenges of Smart Card
Data Analysis
J.-D. Schmöcker1,*, F. Kurauchi2 and H. Shimamoto3
ABSTRACT
In this chapter, an overview on opportunities and challenges for the
use of smart card data for public transport planning is provided. As
an introduction to the topic examples of customer services that have
become feasible due to smart cards are discussed. These include smart
card as a general payment method for a wide range of services, pricing
caps as well as “loyalty points”. For operators, smart cards provide
opportunities such as revised fare structure. The focus of this chapter
and this book in general is on the benefits that emerge through better
understanding of customer behavioural patterns for short and longer
term service planning. This chapter also points out that in practice smart
card data are though not yet as much used as one might expect given
these opportunities. As explanation for this challenges connected to big
data issues, privacy and missing information are discussed. The chapter
concludes by providing an overview on the contributions in this book.
1. INTRODUCTION
Automatic Fare Collection through “smart cards” is becoming a standard in
most advanced public transport networks of major cities around the world.
Using such cards has an advantage for users as well as operators. Whereas
smart cards are mainly increasing convenience for travellers, operators
value in particular the reduced money handling fees. Smart cards further
make it easier to integrate the fare systems of several operators within a
city and to split the revenues.
1
Department of Urban Management, Graduate School of Engineering, Kyoto University,
Japan. Email:
2 Department of Civil Engineering, Gifu University, Japan. Email:
3 Department of Civil and Environmental Engineering, University of Miyazaki, Japan.
Email:
* Corresponding author
2
Public Transport Planning with Smart Card Data
These are the primary reasons that led in many cities to invest in the
introduction of smart card systems. The focus of this book is though the
secondary benefits that are obtained through smart card data. Smart
card data are increasingly recognised as a rich data source to better
understand demand patterns of passengers. As this book will discuss,
origin-destination matrices, routes and activities all can be inferred from
this data. Furthermore, smart card data can be used partly as replacement
of other data sources to collect evaluation measures of the service quality.
That is, the time and the location stamps of the records allow the operator
to measure, for example, actual versus the scheduled arrivals of the buses.
Before discussing the analysis options in detail the following section
will give an overview on the spread of smart card systems across the
world, including the differences in the collected data. Recognizing these
differences is not only important to understand the analysis potential
but also to understand the challenges an analyst faces. These challenges
together with a discussion on actual usage of smart card data in practice is
the topic of Section 4.
Section 5 then provides an overview on the contents of the following
chapters in the book. The primary purpose of the book is to provide an
overview on smart card data analysis opportunities and how challenges
are overcome. Evidently, considering that the literature on smart card data
is rapidly growing, the book does not claim completeness. The section
will hence briefly discuss further data analysis options and examples
which could be perceived as important but missing in this book before
concluding.
2. SMART CARD SYSTEMS AND DATA FEATURES
The numbers of smart cards are increasing year by year, for example
Wikipedia lists more than 350 smart card systems all over the world
covering all continents. As this book focuses on smart card systems that
have their primary application payment for public transport, one needs to
recognise that smart cards are in use for a wider range of applications. An
important development is therefore the integration of different applications
into smart card systems.
Through the worldwide spread of smart cards, international
standardization, which define the signal frequency and the data
transmission speed, has progressed. For the contactless cards there are
several standards that cover the lower levels of interface between cards and
terminals and mainly three types of standard, referred to as Type A, Type
B and FeliCa, are widely prevalent. For transit smart cards, either Type-A
or FeliCa systems are adopted. Type-A systems are common all over the
world since they could be introduced with low cost. The biggest advantage
of the FeliCa system is the faster transmission speed. Due to this feature,
FeliCa system cards prevail in many transit companies in Japan where it
is essential to handle large amount of passengers in short time during the
Chapter 1: An Overview on Opportunities and Challenges of Smart Card Data Analysis
3
rush hours. For further detailed criteria of these standards, readers can
refer to Pelletier et al. (2011). Table 1 shows information on the selection of
noteworthy major smart cards that are issued mainly for the purpose of
transportation fare collection. For users (and data analysts) the increasing
standardization further means that not only the arrangement of same card
usage for different operators becomes easier but also the usage of the same
card in different cities. For example, in Japan since 2013 most of the smart
cards from major public operators can be used across the country. The
Netherlands is one of the first countries where a single smart card can be
used throughout the country for local as well as long distance travel.
The important aspect for data analysis and transport demand
management possibilities is whether the transactions are pre-paid (debit)
or post-paid (credit). Although most of the smart card systems adopt the
pre-paid system, an increasing number also offer post-payment systems,
mostly not in replacement but in addition to pre-paid ones. This means,
that, similar to credit cards, the total transportation fares accumulated
over a month will debit from the bank account next month. The drawback
of the post-payment system for the user is that it requires personal details
and an application for qualification to get the cards. This means that
it often takes a considerable amount of time until the cards are issued.
However, the post-paid system cards also have some merits for the users.
First of all, since the bank debits the fare later from the account, users
do not have to worry about the remaining money on the card. Secondly,
with personalized post-payment cards, loyalty schemes are more widely
spread. One example is the “PiTaPa” card, which could be used for fare
payment on most of the private trains and bus companies in the Kansai
region of Japan. Operators utilizing PiTaPA offer different amount of
discounts per journey and some set an upper limit for the fare-to-be paid
for pre-registered origins and destinations by the users. For other (not preregistered) journeys PiTaPa also offers discount based on how much fare
the users have paid or how often the users have used PiTaPA for public
transport during the previous month. Furthermore, some of the transit
companies in Japan give points for the users based on the boarding history
as well as the shopping history at the designated shops. In Chapter 7 this is
further discussed with the help of an example of Shizutetsu Railway Co.,
Ltd., a private rail operator in Shizuoka, Japan. The cardholders can use
these points for fare or shopping discounts in stores associated with the
transport operator. Therefore, for demand management, in general postpaid systems are preferable. For the data analyst post-paid systems further
mean that travel data and socio-demographic data required for registration
can be obtained, though obviously privacy issues are a major concern for
this.
Table 1 includes some additional observations on selected smart cards
that appear noteworthy to us: The Octopus card was one of the early card
schemes not only for transport but also in general promoting the usage of
4
Public Transport Planning with Smart Card Data
Table 1. Information on selected smart card systems
Name of
Card
City and
Country
Year of
Introduction
Noteworthy Points (but not necessarily unique
features of these cards)
Octopus Card
Hong Kong,
China
1997
Various added functions, including payment at international
chains such as Starbucks or McDonald’s. Currently replacement of
1st generation cards: 2nd generation cards allow, among others,
online payment.
Suica
Various
metropolitan
areas in Japan
2001
The fare calculation is by one yen unit with the smart card
whereas the fare calculation for paper-based tickets is by ten yen
units. Mutual use of other smart cards such as ICOCA or PASMO.
Oyster Card
London, UK
2003
Paying by smart card is much cheaper than paper ticket; “daily
cap” and “weekly caps” are implemented on smart cards.
T-money
Various
metropolitan
areas in Korea
2004
Over 100 million cards (accumulated) are allotting by now (Korea
smart card, 2016). The system is also supplied to operators outside
Korea. Chapter 3 shows an application of analysis with T-Money
data from Seoul.
OV-Chip Card
Nationwide
in the
Netherlands
2005
(Rotterdam
only)
Can be used for almost all public transport in the Netherlands,
including local and long distance travel (see Chapter 12).
LuLuCa
Shizuoka,
Japan
2006
Extensive loyalty point scheme to encourage usage of card for
transit as well as for shopping (see Chapter 7).
Bip! Card
Santiago, Chile 2007
Bip! Card is the only allowed payment method on buses. (see
Chapters 2 and 9)
the card for different purposes, which is also included in the etymology
of the card’s name. Nowadays, the card could be used for a variety of
shopping including online purchases.
Several operators have also been promoting the uptake of smart cards
by providing cheaper fares compared to paper tickets. Noteworthy are the
discounts provided in London, where paper tickets can be priced double
compared to the payment by Oyster card. In Japan, generally no discounts
are given for the usage of smart cards. Recently though, due to an increase
in the VAT, there are small price differences between paper tickets and
payments by smart cards. The increase in fares due to VAT raise is reflected
accurate to 1 Yen for smart cards where paper tickets are rounded to the
nearest 10 Yen. Such minor price differences are though unlikely to have
an impact on travel decisions. More important might be the effect of “daily
caps” or, recently, “weekly caps” that have been applied in London. These
caps mean that the user does not have to decide in the morning or the
beginning of the week anymore whether it will be worth purchasing a
daily or weekly pass. Instead the traveller has the guarantee that the smart
card will stop charging the user if the equivalent prices of a daily or weekly
pass has been accumulated through single fares. In how far this scheme
has any impact on behaviour is not yet known to our knowledge. Finally,
it should be noted that in some cities, such as Santiago, it is compulsory for
5
Chapter 1: An Overview on Opportunities and Challenges of Smart Card Data Analysis
users to get a smart card as cash payment on some modes of transport is
not possible anymore.
3. ANALYSIS CHALLENGES
As the smart cards are widely spread one might expect that their historical
data records have also been exploited heavily for transportation planning.
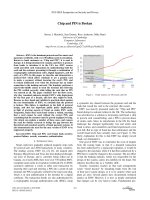
This appears tough for many operators not yet to be the case. Imai et al.
(2012) conducted a survey among 66 Japanese operators asking them about
the purposes they use the smart card data for. The results are shown in
Figure 1. One can see that many operators do not utilize the smart data
card for transport planning purposes at all. From those who use the data,
the majority uses them only for some simple collective analysis or for
reporting purposes. This situation is probably not unique to Japan and also
in other countries it will be often only large, or a few innovative, transport
operators that have enough resources to dedicate themselves to the analysis
of the vast amount of data that they obtain from the smart cards.
Aggr. analysis of passenger numbers
Timetable revisions
Revenue split between operators
Service quality monitoring
Official reports
Others
0
5
10
15
20
25
30
Number of operators (out of 66 respondents)
Fig. 1. Usage of smart card data by operators in Japan according to a survey in 2012
Source: Table adjusted from Imai 2012.
A main reason for this situation is that, although most would agree that the
potential information to be derived from the data is useful, there are also
several challenges to be overcome before the data become in fact useful. A
list of data potentials and challenges is given in Table 2. The importance/
benefits of the first two points (data at lower cost, aggregate performance
statistics) will be fairly obvious to most operators. The latter two points on
more detailed information about travellers will especially help providers to
develop strategies to better target the services. This discussion continues in
the next section awhereas the focus in this section is on the challenges.
The first challenge, the representativeness of population from the smart
card sample, may not be a significant problem anymore in many cities since
6
Public Transport Planning with Smart Card Data
Table 2. Potential and challenges of smart card data that motivate this book
Advantages/Potential
Disadvantages/Challenges
• To get large amount of data on passengers’ behaviour
with lower cost
• Representativeness of population is not guaranteed
• To analyse aggregate behaviour including “dynamic
aspects”
• Big data issues
• To analyse data on personal level to understand
variation in behaviour
• Privacy and contractual issues
• To match data with other information (e.g., purchase
history during the trip)
• Missing information
the rate of payment by smart cards is increasing year by year. Nevertheless,
operators need to be aware that in particular irregular users might be
under-represented in the smart card data sample.
Connected to the increasing data size are though also “big data
issues”. Since smart cards collect daily passenger behaviour continuously,
the data size may become so large that it is sometimes difficult to handle.
Smart card data can therefore be regarded as one type of ‘big data’.
A major difference to traditional data analysis is that ‘big data’ often
provide information on nearly the whole system population. In traditional
data analysis, a ‘hypothesis’ should be first set and sampling should be
carried out based on this hypothesis. Then the population characteristics
assessment is done by the sample data and the hypothesis is tested. In
contrast in big data analysis such a sampling strategy is not needed any
more. What instead becomes important in big data analysis is how relevant
samples are picked up and how important information will be extracted
from the data. Statistical methods such as factor analysis and/or clustering
analysis are often adopted to understand the sample characteristics, but the
procedure is far more difficult considering the data size. Also, one should
recognise that when using big data, it becomes too easy to reject the null
hypothesis of no statistical significance as discussed in Harding 2013.
Therefore, special consideration might be necessary in handling big data.
The second challenge, privacy issues, occurs in handling smart
card data since the cards can contain private information, including
monetary information, especially if it is a post-payment card. This makes
it often difficult to get access to smart card data and/or to develop analysis
methodologies that remain data confidentiality. Ideally, a universal rule
in utilizing smart card data in public transport service management and
evaluation should be discussed, though this will be difficult given different
law constraints in different countries. Similar to privacy rules, there is
often a contract that data must not be given to others to protect a possible
deficiency. Such a contract is active especially when different companies
are sharing the same card such as, in Japan, PASMO in Tokyo metropolitan
area and the PiTaPa card in the Kansai area.
Chapter 1: An Overview on Opportunities and Challenges of Smart Card Data Analysis
7
Another common challenge encountered by analysts is missing
information. This could be due to above-mentioned privacy regulations,
due to missing records, or simply because they are not recorded with smart
card data. In particular for pre-paid smart cards there are usually few or
no socio-demographic information recorded. Chapters 3 and 5 in this book
will discuss some probabilistic approaches to overcome such challenges.
Further important information may not be recorded due to the fare system.
For example, bus companies that adopt flat fare systems only record either
the boarding or alighting bus stop since there is no need for passengers
to tap in and out. Also, in subways where ticketing gates at stations are
common among lines, information on the routes taken by travellers may
not be recorded as will be discussed more in Chapter 4. In summary,
though some of these missing information constraints can be overcome,
in many cases more analysis processes are often required before the data
deliver some useful information.
4. CATEGORIZATION OF POTENTIAL ANALYSIS USING
SMART CARD DATA
Despite all these challenges, when properly analysed, the smart card
data can be a very powerful tool, for service management as shown in
the contributions in this book. In their review on the potential for smart
card data Pelletier et al. (2011) noted that smart card data can be used for
strategic-level, tactic-level and long-term planning which they define as:
Strategic-level studies: Long-term planning. An understanding of
tendency of passengers’ behaviour for long-term planning such as
demand forecasting and marketing. An example of the analysis from
this level is classification of travellers.
Tactical-level studies: Service adjustments and network development.
Determine patterns in travel behaviour to adjust service frequency and
route. An example of the analysis from this level is transfer journey.
Operational-level studies: Ridership statistics and performance
indicators. An understanding of detail in passengers’ behaviour to
measure the performance indicator. An example of the analysis from
this level is schedule adherence.
One might further extend this classification as in Table 3.
If smart card data are aggregated, one can get knowledge and create
graphs to illustrate details of travellers’ demand for strategic planning
as shown in Chapter 9 or in various literature such as Jang (2010) with
data from Seoul. Without smart card data these details are gained from
boarding and alighting count surveys with great effort. Moreover, as
mentioned before, one of the advantages of the use of smart card data
is that it is possible to track individual behaviour. Therefore, from the
analysis of the individual demand data, one can infer popular transfer
8
Public Transport Planning with Smart Card Data
Table 3. Possible analysis using smart card data
Extracted Data/
Level
Demand,
aggregated
Demand,
individual
cross-sectional
data
Demand,
individual panel
data (card ID
could be tracked
over time)
Space
Dimension
Examples for Use by Operators
Strategic
Directly for service planning.
Stop
Line
Network
Design services so that it allows for choice flexibility (“hyperpaths”).
Route
OD patterns
Tactical
Minimize transfers and journey times, distribution by time of day.
Trip chains,
Journeys1
Where to offer transfer information and waiting facilities.
Route
Estimation of demand variation over time.
OD patterns
Trip chains,
Journeys
Stop
Supply2
Level of
Analysis
Route
Network
Tactical
Allows distinguishing “white noise” from explainable demand
variation for capacity planning.
Prediction of possible consequences of service disruption and
infrastructure investments.
Strategic
Service adjustments to user travel needs.
Evaluation criteria: Regularity, waiting time.
Operational Evaluation criteria: km operated, schedule adherence, “bunching”.
As for routes, plus, e.g., knock-on effects of delays between routes.
Notes:
1 Need alighting data, in some systems not available, might be inferable, see Chapter 2.
2 In some systems such data can be directly extracted from smart card data, in others, like
London, a separate data system (ibus) provides this data (see Chapter 8 where Singapore
bus departure times are estimated from smart cards).
points, which is essential information for providing transfer facilities or
even for long-term bus network planning, (Jang 2010). Furthermore, if one
analyses individual time series data, it is possible to capture the day-to-day
variation of travellers’ demand or their chosen route (set). It is suggested
that one contribution of this is for better understanding of network
reliability. Although many advanced network models have been proposed
to deal with demand uncertainty, most of these assume that the demand or
route choice probability follow a certain (simple) probabilistic distribution
due to difficulties in obtaining good panel data. Instead, with smart card
data it is possible to detect such distributions and/or to distinguish traveller
groups according to their demand variation and route choice preferences.
As noted above and discussed in Chapters 8 and 10 in detail, with
smart card data it is also possible to extract supply side data, such as the
dwell time distribution at a bus stop. Therefore, it becomes possible to
analyse mechanisms of “bus bunching” in detail. Most bus bunching
Chapter 1: An Overview on Opportunities and Challenges of Smart Card Data Analysis
9
studies focus on methods reducing its effect, but, to our knowledge, there
are only few studies aiming to explain the causes of bus bunching with
practical data so far an exception is Arrigada et al. (2015). With smart card
data, it becomes possible to estimate the number of boarding passengers so
that one can analyse the relationship between the demand and the supply
service reliability.
5. BOOK OVERVIEW, WHAT IS MISSING AND CONCLUSION
The idea for this book was initiated following presentations given during
the 1st International Workshop on Utilizing Transit Smart Card Data for
Service Planning. This event was held in Gifu city, Japan on 2nd-3rd July,
2014. The objectives of this workshop were;
1. to create a network of researchers analyzing smart card data for further
continuous exchange,
2. to exchange experience on how public transport smart card data can
be best analysed with the final goal to establish some “best practice”
guidelines,
3. to better understand that how far the data have been already utilized in
practice, and
4. to include public transport operators in the ongoing (academic)
discussion to better understand how they see the need and potential
for smart card data analysis.
The workshop was attended by 45 participants from all over the world
and included 23 presentations related to smart card data analysis. At the
workshop, the participants agreed that the importance and potentials of
smart card data deserve a book publication on how to use smart card data
for public transport planning and evaluation.
The book is split into three sections. The first section aims to give
an overview on estimating the different behavioural dimensions that
can be analysed with smart card data. Firstly, Hickman discusses the
various approaches to get transit origin-destination matrices from smart
card data, considering that the smart card records often do not include
both boarding and alighting record. Chapter 3 by Ali and Lee thereby
discusses approaches to further infer activity types of passengers. Chapter
4 by Raveau concludes Part 1 by discussing challenges and possibilities to
estimate route choice of passengers from smart card data. Taken together, if
ODs, activities and routes of passengers can be estimated, then the analyst
has a fairly complete overview on the travel patterns of passengers in the
network and further indices such as network travel time can be extracted.
Part 2 discusses further analyses possibilities if smart card data are
combined with other data sources. Chapter 5 by Kusakabe et al. discusses
how smart card data could be fused with personal trip data, one of the
10
Public Transport Planning with Smart Card Data
challenges discussed afore. This is in fact also the bases for activity
estimation of passengers, so that there is some overlap to Chapter 3.
Chapters 6 and 7 both offer a different perspective on the usage of
smart card data in combination with survey data. For both the chapters the
key is that the smart card usage and the survey response can be linked. In
Chapter 6 by Brakewood and Watkins this is the key to estimate changes
in the transit usage after installing real-time information. In Chapter 7 by
Nakamura et al. sensitivities to the transit usage in response to a change in
the loyalty-point scheme are analysed through a stated preference survey.
Chapter 8 by Fourie et al. combines smart card data with transit feed
and other data to use these as input for activity based simulation. It further
assesses the supply characteristics from smart card data and provides a
powerful example on how smart card data can be used for a large-scale
citywide simulation of the public transportation network. The chapter can
hence be seen as a transition to Part 3 of the book which discusses how
smart card data can be used to evaluate the transport network quality.
Chapters 9 and 10 directly focus on evaluation measures. The chapter
by Munizaga et al. particularly discusses service indicators of interest for
citywide transport planning. These are, for example, fairness in travel time
distribution to the city centre from different parts of the city. Trepanier
and Morency instead focus on evaluation measures of interest directly for
service operators, such as service reliability, distance operated but also fare
evasion.
Chapters 11 and 12 both discuss specific applications, though of
very different kind. The chapter by van Oort et al. discusses ridership
predictions in The Hague considering demand elasticity and potential
changes in the service characteristics. Ishigami et al. discuss in Chapter
12 a basic application of smart card data where ridership information
obtained from smart card data is used in combination with probe car data
to assess the need to improve the environment of specific bus stops. Finally,
Wilson and Hemily conclude this book in Chapter 13 by broadly looking at
automatic data collection systems and pointing out further research areas.
The authors want to conclude this introduction by stressing that this
book clearly does not offer a complete overview of all the existing smart
card data research and some areas are missing. An important area that
is not sufficiently covered in this book is discussions related to “within
dynamics” as well as “day-to-day dynamics”. To give an example of the
former, smart card data can be used to discuss the network demand
dynamics following an incident on one of the lines. An example for
the latter might be Kurauchi et al. (2014) who discuss variation in the
bus line choice of commuters with London Oyster data. Thus, these are
some examples where further research is needed. In conclusion, since
the discussion paper of Bagchi and White (2005) titled “The potential of
public transport smart card data” some of these potentials have indeed
Chapter 1: An Overview on Opportunities and Challenges of Smart Card Data Analysis
11
been realized by now and the field has significantly advanced. However,
to completely overcome some of the challenges that come with smart card
data and to use their full potential will need further efforts. It is hoped that
this book provides some overview of the state-of-the-art and will motivate
scholars as well as practitioners to further advance the field.
REFERENCES
Arriagada, J., Gschwender, J. and Munizaga, M. 2015. Modelling bus bunching using massive
GPS and AFC data. Proceedings of Thredbo 14, Santiago de Chile, September.
Bagchi, M. and White, P.R. 2005. The potential of public transport smart card data, Transport
Policy, 12 (5), September , pp. 464-474.
Harding. 2013. Big data econometrics. Statistical Significance in Big Data. Available from
< Accessed January, 2016.
Imai, R., Iboshi, Y., Nakamura, T., Morio, J., Makimura, K. and Hamada, S. 2012. Consideration
on practical use of trail data acquired by smart card of transportation. Proceedings of
Infrastructure Planning, Vol. 45, CD-ROM.
Jang, W. 2010. Travel time and transfer analysis using transit smart card data. Transportation
Research Record: Journal of the Transportation Research Board, No. 2144, pp. 142-149.
Korea Smart Card. 2016. Homepage < Accessed January,
2016.
Kurauchi, F., Schmöcker, J.-D., Shimamoto, H. and Hassan, S.M. 2014. Variability of
commuters’ bus line choice: An analysis of oyster card data. Public Transport, 6, pp. 21-34.
Pelletier, M., Trepanier, M. and Morency, C. 2011. “Smart Card Data Use in Public Transit: A
Literature Review”, Transportation Research Part C, 19, pp. 557-568.
AUTHOR BIOGRAPHY
Jan-Dirk Schmöcker is an Associate Professor in the Graduate School of
Engineering at Kyoto University. Jan-Dirk’s research interests include a
wide range of public transport issues, including modelling of network
flows as well as data driven analysis of passengers’ travel behaviour. He
has published work related to analysis of London’s Oyster card data and
has been involved in studies using smart card data from Japan. Together
with Fumitaka Kurauchi he initiated the 1st workshop on smart card data
for transit planning in Gifu, Japan.
Fumitaka Kurauchi is a Professor in the Faculty of Engineering at Gifu
University. His research interests include travel behaviour under provision
of dynamic traffic information, modelling of transit network flows and
network reliability analysis. He is a member of International Scientific
Committee of Conference on Advanced Systems in Public Transport
(CASPT). He published several analyses using smart card data such as
London’ Oyster card data. Together with Jan-Dirk Schmöcker he initiated
the 1st workshop on smart card data for transit planning in Gifu, Japan.
12
Public Transport Planning with Smart Card Data
Hiroshi Shimamoto is an Associate Professor in the Faculty of
Engineering at University of Miyazaki. His research interests include
passengers’ travel behaviour analysis and road network analysis as well as
public transportation network analysis. Among others, he is interested in
network design issues and fare policy and how effects of potential service
quality changes could be estimated with smart card data.
PART 1
Estimating Passenger
Behavior