Software technologies 12th international joint conference, ICSOFT 2017, madrid, spain, july 24 26, 2017, revised select
Bạn đang xem bản rút gọn của tài liệu. Xem và tải ngay bản đầy đủ của tài liệu tại đây (18.09 MB, 319 trang )
Enrique Cabello
Jorge Cardoso
Leszek A. Maciaszek
Marten van Sinderen (Eds.)
Communications in Computer and Information Science
868
Software Technologies
12th International Joint Conference, ICSOFT 2017
Madrid, Spain, July 24–26, 2017
Revised Selected Papers
123
Communications
in Computer and Information Science
Commenced Publication in 2007
Founding and Former Series Editors:
Alfredo Cuzzocrea, Xiaoyong Du, Orhun Kara, Ting Liu, Dominik Ślęzak,
and Xiaokang Yang
Editorial Board
Simone Diniz Junqueira Barbosa
Pontifical Catholic University of Rio de Janeiro (PUC-Rio),
Rio de Janeiro, Brazil
Phoebe Chen
La Trobe University, Melbourne, Australia
Joaquim Filipe
Polytechnic Institute of Setúbal, Setúbal, Portugal
Igor Kotenko
St. Petersburg Institute for Informatics and Automation of the Russian
Academy of Sciences, St. Petersburg, Russia
Krishna M. Sivalingam
Indian Institute of Technology Madras, Chennai, India
Takashi Washio
Osaka University, Osaka, Japan
Junsong Yuan
University at Buffalo, The State University of New York, Buffalo, USA
Lizhu Zhou
Tsinghua University, Beijing, China
868
More information about this series at />
Enrique Cabello Jorge Cardoso
Leszek A. Maciaszek Marten van Sinderen (Eds.)
•
•
Software Technologies
12th International Joint Conference, ICSOFT 2017
Madrid, Spain, July 24–26, 2017
Revised Selected Papers
123
Editors
Enrique Cabello
King Juan Carlos University
Madrid
Spain
Jorge Cardoso
University of Coimbra
Coimbra
Portugal
Leszek A. Maciaszek
Wroclaw University of Economics
Wroclaw
Poland
Marten van Sinderen
Computer Science
University of Twente
Enschede
The Netherlands
ISSN 1865-0929
ISSN 1865-0937 (electronic)
Communications in Computer and Information Science
ISBN 978-3-319-93640-6
ISBN 978-3-319-93641-3 (eBook)
/>Library of Congress Control Number: 2018947013
© Springer International Publishing AG, part of Springer Nature 2018
This work is subject to copyright. All rights are reserved by the Publisher, whether the whole or part of the
material is concerned, specifically the rights of translation, reprinting, reuse of illustrations, recitation,
broadcasting, reproduction on microfilms or in any other physical way, and transmission or information
storage and retrieval, electronic adaptation, computer software, or by similar or dissimilar methodology now
known or hereafter developed.
The use of general descriptive names, registered names, trademarks, service marks, etc. in this publication
does not imply, even in the absence of a specific statement, that such names are exempt from the relevant
protective laws and regulations and therefore free for general use.
The publisher, the authors, and the editors are safe to assume that the advice and information in this book are
believed to be true and accurate at the date of publication. Neither the publisher nor the authors or the editors
give a warranty, express or implied, with respect to the material contained herein or for any errors or
omissions that may have been made. The publisher remains neutral with regard to jurisdictional claims in
published maps and institutional affiliations.
Printed on acid-free paper
This Springer imprint is published by the registered company Springer International Publishing AG
part of Springer Nature
The registered company address is: Gewerbestrasse 11, 6330 Cham, Switzerland
Preface
The present book includes extended and revised versions of a set of selected papers
from the 12th International Conference on Software Technologies (ICSOFT 2017),
held in Madrid, Spain, during July 24–26.
ICSOFT 2017 received 85 paper submissions from 33 countries, of which 15% are
included in this book. The papers were selected by the event chairs and their selection
is based on a number of criteria that include the classifications and comments provided
by the Program Committee members, the session chairs’ assessment, and also the
program chairs’ perception of the overall quality of papers included in the technical
program. The authors of selected papers were then invited to submit a revised and
extended version of their papers having at least 30% innovative material.
The purpose of the ICSOFT conferences, including its 12th edition in 2017, is to
bring together researchers and practitioners interested in developing and using software
technologies for the benefit of businesses and society at large. The conference solicits
papers and other contributions in themes ranging from software engineering and
development via showcasing cutting-edge software systems and applications to
addressing foundational innovative technologies for systems and applications of the
future.
The papers selected to be included in this book conform to the ICSOFT purpose and
contribute to the understanding of current research and practice on software technologies. The main topics covered in the papers include: software quality and metrics
(Chaps. 1, 2, 6 and 9), software testing and maintenance (Chap. 2), development
methods and models (Chaps. 3, 4, 5 and 9), systems security (Chap. 6), dynamic
software updates (Chap. 7), systems integration (Chap. 8), business process modelling
(Chap. 9), intelligent problem solving (Chap. 10), multi-agent systems (Chap. 12), and
solutions involving big data, the Internet of Things and business intelligence
(Chaps. 11 and 13).
We would like to thank all the authors for their contributions and the reviewers for
ensuring the quality of this publication.
July 2017
Enrique Cabello
Jorge Cardoso
Leszek Maciaszek
Marten van Sinderen
Organization
Conference Chair
Enrique Cabello
Universidad Rey Juan Carlos, Spain
Program Co-chairs
Jorge Cardoso
Leszek Maciaszek
Marten van Sinderen
University of Coimbra, Portugal and Huawei German
Research Center, Munich, Germany
Wroclaw University of Economics, Poland
and Macquarie University, Sydney, Australia
University of Twente, The Netherlands
Program Committee
Markus Aleksy
Waleed Alsabhan
Bernhard Bauer
Maurice H. ter Beek
Wolfgang Bein
Fevzi Belli
Gábor Bergmann
Mario Luca Bernardi
Jorge Bernardino
Mario Berón
Marcello M. Bersani
Thomas Buchmann
Miroslav Bureš
Nelio Cacho
Antoni Lluís Mesquida
Calafat
Jose Antonio
Calvo-Manzano
Ana R. Cavalli
Marta Cimitile
Felix J. Garcia Clemente
Kendra Cooper
Agostino Cortesi
António Miguel Rosado
da Cruz
Lidia Cuesta
ABB Corporate Research Center, Germany
KACST, UK
University of Augsburg, Germany
ISTI-CNR, Pisa, Italy
University of Nevada, Las Vegas, USA
Izmir Institute of Technology, Turkey
Budapest University of Technology and Economics,
Hungary
Giustino Fortunato University, Italy
Polytechnic Institute of Coimbra, ISEC, Portugal
Universidad Nacional de San Luis, Argentina
Politecnico di Milano, Italy
University of Bayreuth, Germany
Czech Technical University, Czech Republic
Federal University of Rio Grande do Norte, Brazil
Universitat de les Illes Balears, Spain
Universidad Politécnica de Madrid, Spain
Institute Telecom SudParis, France
Unitelma Sapienza, Italy
University of Murcia, Spain
Independent Scholar, Canada
Università Ca’ Foscari di Venezia, Italy
Instituto Politécnico de Viana do Castelo, Portugal
Universitat Politècnica de Catalunya, Spain
VIII
Organization
Sergiu Dascalu
Jaime Delgado
Steven Demurjian
John Derrick
Philippe Dugerdil
Gregor Engels
Morgan Ericsson
Maria Jose Escalona
Jean-Rémy Falleri
João Faria
Cléver Ricardo Guareis
de Farias
Chiara Di Francescomarino
Matthias Galster
Mauro Gaspari
Hamza Gharsellaoui
Paola Giannini
J. Paul Gibson
Gregor Grambow
Hatim Hafiddi
Jean Hauck
Christian Heinlein
Jose Luis Arciniegas
Herrera
Mercedes Hidalgo-Herrero
Jose R. Hilera
Andreas Holzinger
Jang-Eui Hong
Zbigniew Huzar
Ivan Ivanov
Judit Jasz
Bo Nørregaard Jørgensen
Hermann Kaindl
Dimitris Karagiannis
Carlos Kavka
Dean Kelley
Jitka Komarkova
Rob Kusters
Lamine Lafi
Konstantin Läufer
Pierre Leone
David Lorenz
Ivan Lukovic
University of Nevada, Reno, USA
Universitat Politècnica de Catalunya, Spain
University of Connecticut, USA
University of Sheffield, UK
Geneva School of Business Administration,
University of Applied Sciences of Western
Switzerland, Switzerland
University of Paderborn, Germany
Linnaeus University, Sweden
University of Seville, Spain
Bordeaux INP, France
University of Porto, Portugal
University of São Paulo, Brazil
FBK-IRST, Italy
University of Canterbury, New Zealand
University of Bologna, Italy
Al-Jouf College of Technology, Saudi Arabia
University of Piemonte Orientale, Italy
Mines-Telecom, Telecom SudParis, France
AristaFlow GmbH, Germany
INPT, Morocco
Universidade Federal de Santa Catarina, Brazil
Aalen University, Germany
Universidad del Cauca, Colombia
Universidad Complutense de Madrid, Spain
University of Alcala, Spain
Medical University Graz, Austria
Chungbuk National University, South Korea
University of Wroclaw, Poland
SUNY Empire State College, USA
University of Szeged, Hungary
University of Southern Denmark, Denmark
Vienna University of Technology, Austria
University of Vienna, Austria
ESTECO SpA, Italy
Minnesota State University, USA
University of Pardubice, Czech Republic
Eindhoven University of Technology and Open
University of the Netherlands, The Netherlands
University of Sousse, Tunisia
Loyola University Chicago, USA
University of Geneva, Switzerland
Open University, Israel
University of Novi Sad, Serbia
Organization
Stephane Maag
Ivano Malavolta
Eda Marchetti
Katsuhisa Maruyama
Manuel Mazzara
Tom McBride
Fuensanta
Medina-Dominguez
Jose Ramon Gonzalez
de Mendivil
Francesco Mercaldo
Gergely Mezei
Greg Michaelson
Marian Cristian Mihaescu
Dimitris Mitrakos
Valérie Monfort
Mattia Monga
Antonio Muñoz
Takako Nakatani
Elena Navarro
Joan Navarro
Viorel Negru
Paolo Nesi
Jianwei Niu
Rory O’Connor
Marcos Palacios
Catuscia Palamidessi
Luis Pedro
Jennifer Pérez
Dana Petcu
Dietmar Pfahl
Giuseppe Polese
Traian Rebedea
Michel Reniers
Colette Rolland
Gustavo Rossi
Matteo Rossi
Stuart Harvey Rubin
Chandan Rupakheti
Gunter Saake
Krzysztof Sacha
Francesca Saglietti
Maria-Isabel
Sanchez-Segura
IX
Telecom SudParis, France
Vrije Universiteit Amsterdam, The Netherlands
ISTI-CNR, Italy
Ritsumeikan University, Japan
Innopolis University, Russian Federation
University of Technology Sydney, Australia
Carlos III Technical University of Madrid, Spain
Universidad Publica de Navarra, Spain
National Research Council of Italy, Italy
Budapest University of Technology and Economics,
Hungary
Heriot-Watt University, UK
University of Craiova, Romania
Aristotle University of Thessaloniki, Greece
LAMIH Valenciennes UMR CNRS 8201, France
Università degli Studi di Milano, Italy
University of Malaga, Spain
Open University of Japan, Japan
University of Castilla-La Mancha, Spain
La Salle, Universitat Ramon Llull, Spain
West University of Timisoara, Romania
University of Florence, Italy
University of Texas at San Antonio, USA
Dublin City University, Ireland
University of Oviedo, Spain
Inria, France
University of Aveiro, Portugal
Universidad Politécnica de Madrid, Spain
West University of Timisoara, Romania
University of Tartu, Estonia
Università degli Studi di Salerno, Italy
University Politehnica of Bucharest, Romania
Eindhoven University of Technology, The Netherlands
Université de Paris 1 Panthèon Sorbonne, France
Lifia, Argentina
Politecnico di Milano, Italy
University of California San Diego, USA
Rose-Hulman Institute of Technology, USA
Institute of Technical and Business Information
Systems, Germany
Warsaw University of Technology, Poland
University of Erlangen-Nuremberg, Germany
Carlos III University of Madrid, Spain
X
Organization
Luis Fernandez Sanz
Elad Michael Schiller
Istvan Siket
Michal Smialek
Cosmin Stoica Spahiu
Miroslaw Staron
Anca-Juliana Stoica
Ketil Stølen
Hiroki Suguri
Bedir Tekinerdogan
Chouki Tibermacine
Claudine Toffolon
Michael Vassilakopoulos
Dessislava Vassileva
László Vidács
Sergiy Vilkomir
Gianluigi Viscusi
Christiane Gresse
von Wangenheim
Dietmar Winkler
Dianxiang Xu
Jinhui Yao
Murat Yilmaz
Jingyu Zhang
University of Alcala, Spain
Chalmers University of Technology, Sweden
Hungarian Academy of Science, Research Group
on Artificial Intelligence, Hungary
Warsaw University of Technology, Poland
University of Craiova, Romania
University of Gothenburg, Sweden
Uppsala University, Sweden
SINTEF, Norway
Miyagi University, Japan
Wageningen University, The Netherlands
LIRMM, CNRS and Montpellier University, France
Université du Maine, France
University of Thessaly, Greece
Sofia University St. Kliment Ohridski, Bulgaria
University of Szeged, Hungary
East Carolina University, USA
EPFL Lausanne, Switzerland
Federal University of Santa Catarina, Brazil
Vienna University of Technology, Austria
Boise State University, USA
Xerox Research, USA
Çankaya University, Turkey
Macquarie University, Australia
Additional Reviewers
Doina Bein
Dominik Bork
Angela Chan
Estrela Ferreira Cruz
Alessandro Fantechi
Dusan Gajic
Jalal Kiswani
Asia van de
Mortel-Fronczak
Benedikt Pittl
Fredrik Seehusen
Rocky Slavin
Gábor Szárnyas
Michael Walch
California State University, Fullerton, USA
University of Vienna, Austria
University of Nevada, Reno, USA
Instituto Politécnico de Viana do Castelo, Portugal
University of Florence, Italy
University of Novi Sad, Serbia
University of Nevada, Reno, USA
Eindhoven University of Technology, The Netherlands
University of Vienna, Austria
Sintef, Norway
University of Texas at San Antonio, USA
Budapest University of Technology and Economics,
Hungary
University of Vienna, Austria
Organization
Invited Speakers
Jan Bosch
Siobhán Clarke
Stefano Ceri
Andreas Holzinger
Chalmers University of Technology, Sweden
Trinity College Dublin, Ireland
Politecnico di Milano, Italy
Medical University Graz, Austria
XI
Contents
Software Engineering
Assessing the User-Perceived Quality of Source Code Components Using
Static Analysis Metrics . . . . . . . . . . . . . . . . . . . . . . . . . . . . . . . . . . . . . .
Valasia Dimaridou, Alexandros-Charalampos Kyprianidis,
Michail Papamichail, Themistoklis Diamantopoulos,
and Andreas Symeonidis
A Technology for Optimizing the Process of Maintaining Software
Up-to-Date . . . . . . . . . . . . . . . . . . . . . . . . . . . . . . . . . . . . . . . . . . . . . . .
Andrei Panu
From Specification to Implementation of an Automotive
Transport System . . . . . . . . . . . . . . . . . . . . . . . . . . . . . . . . . . . . . . . . . .
Oussama Khlifi, Christian Siegwart, Olfa Mosbahi,
Mohamed Khalgui, and Georg Frey
Towards a Goal-Oriented Framework for Partial Agile Adoption. . . . . . . . . .
Soreangsey Kiv, Samedi Heng, Yves Wautelet, and Manuel Kolp
Using Semantic Web to Establish Traceability Links Between
Heterogeneous Artifacts . . . . . . . . . . . . . . . . . . . . . . . . . . . . . . . . . . . . . .
Nasser Mustafa and Yvan Labiche
A Machine Learning Approach for Game Bot Detection Through
Behavioural Features . . . . . . . . . . . . . . . . . . . . . . . . . . . . . . . . . . . . . . . .
Mario Luca Bernardi, Marta Cimitile, Fabio Martinelli,
and Francesco Mercaldo
Genrih, a Runtime State Analysis System for Deciding the Applicability
of Dynamic Software Updates . . . . . . . . . . . . . . . . . . . . . . . . . . . . . . . . .
Oleg Šelajev and Allan Raundahl Gregersen
3
28
49
69
91
114
135
Software Systems and Applications
Identifying Class Integration Test Order Using an Improved Genetic
Algorithm-Based Approach . . . . . . . . . . . . . . . . . . . . . . . . . . . . . . . . . . .
Istvan Gergely Czibula, Gabriela Czibula, and Zsuzsanna Marian
Application of Fuzzy Logic to Assess the Quality of BPMN Models . . . . . . .
Fadwa Yahya, Khouloud Boukadi, Hanêne Ben-Abdallah,
and Zakaria Maamar
163
188
XIV
Contents
Solving Multiobjective Knapsack Problem Using Scalarizing Function
Based Local Search . . . . . . . . . . . . . . . . . . . . . . . . . . . . . . . . . . . . . . . . .
Imen Ben Mansour, Ines Alaya, and Moncef Tagina
Monitoring and Control of Vehicles’ Carbon Emissions . . . . . . . . . . . . . . . .
Tsvetan Tsokov and Dessislava Petrova-Antonova
WOF: Towards Behavior Analysis and Representation of Emotions
in Adaptive Systems . . . . . . . . . . . . . . . . . . . . . . . . . . . . . . . . . . . . . . . .
Ilham Alloui and Flavien Vernier
210
229
244
Classifying Big Data Analytic Approaches: A Generic Architecture. . . . . . . .
Yudith Cardinale, Sonia Guehis, and Marta Rukoz
268
Towards a Digital Business Operating System . . . . . . . . . . . . . . . . . . . . . .
Jan Bosch
296
Author Index . . . . . . . . . . . . . . . . . . . . . . . . . . . . . . . . . . . . . . . . . . . .
309
Software Engineering
Assessing the User-Perceived Quality
of Source Code Components Using
Static Analysis Metrics
Valasia Dimaridou, Alexandros-Charalampos Kyprianidis,
Michail Papamichail, Themistoklis Diamantopoulos(B) ,
and Andreas Symeonidis
Electrical and Computer Engineering Department,
Aristotle University of Thessaloniki, Thessaloniki, Greece
{valadima,alexkypr}@ece.auth.gr, {mpapamic,thdiaman}@issel.ee.auth.gr,
Abstract. Nowadays, developers tend to adopt a component-based software engineering approach, reusing own implementations and/or resorting to third-party source code. This practice is in principle cost-effective,
however it may also lead to low quality software products, if the components to be reused exhibit low quality. Thus, several approaches have
been developed to measure the quality of software components. Most
of them, however, rely on the aid of experts for defining target quality scores and deriving metric thresholds, leading to results that are
context-dependent and subjective. In this work, we build a mechanism
that employs static analysis metrics extracted from GitHub projects and
defines a target quality score based on repositories’ stars and forks, which
indicate their adoption/acceptance by developers. Upon removing outliers with a one-class classifier, we employ Principal Feature Analysis
and examine the semantics among metrics to provide an analysis on five
axes for source code components (classes or packages): complexity, coupling, size, degree of inheritance, and quality of documentation. Neural
networks are thus applied to estimate the final quality score given metrics from these axes. Preliminary evaluation indicates that our approach
effectively estimates software quality at both class and package levels.
Keywords: Code quality · Static analysis metrics
User-perceived quality · Principal Feature Analysis
1
Introduction
The continuously increasing need for software applications in practically every
domain, and the introduction of online open-source repositories have led to the
establishment of an agile, component-based software engineering paradigm. The
need for reusing existing (own or third-party) source code, either in the form
of software libraries or simply by applying copy-paste-integrate practices has
c Springer International Publishing AG, part of Springer Nature 2018
E. Cabello et al. (Eds.): ICSOFT 2017, CCIS 868, pp. 3–27, 2018.
/>
4
V. Dimaridou et al.
become more eminent than ever, since it can greatly reduce the time and cost
of software development [19]. In this context, developers often need to spend
considerable time and effort to integrate components and ensure high performance. And still, this may lead to failures, since the reused code may not satisfy
basic functional or non-functional requirements. Thus, the quality assessment of
reusable components poses a major challenge for the research community.
An important aspect of this challenge is the fact that quality is contextdependent and may mean different things to different people [17]. Hence, a
standardized approach for measuring quality has been proposed in the latest
ISO/IEC 25010:2011 [10], which defines a model with eight quality characteristics: Functional Suitability, Usability, Maintainability, Portability, Reliability,
Performance and Efficiency, Security and Compatibility, out of which the first
four are usually assessed using static analysis and evaluated intuitively by developers. To accommodate reuse, developers usually structure their source code (or
assess third-party code) so that it is modular, exhibits loose coupling and high
cohesion, and provides information hiding and separation of concerns [16].
Current research efforts assess the quality of software components using
static analysis metrics [4,12,22,23], such as the known CK metrics [3]. Although
these efforts can be effective for the assessment of a quality characteristic (e.g.
[re]usability, maintainability or security), they do not actually provide an interpretable analysis to the developer, and thus do not inform him/her about the
source code properties that need improvement. Moreover, the approaches that
are based on metric thresholds, whether defined manually [4,12,23] or derived
automatically using a model [24], are usually constrained by the lack of objective
ground truth values for software quality. As a result, these approaches typically
resort to expert help, which may be subjective, case-specific or even unavailable
[2]. An interesting alternative is proposed by Papamichail et al. [15] that employ
user-perceived quality as a measure of the quality of a software component.
In this work, we employ the concepts defined in [15] and build upon the
work originated from [5], which performs analysis only at class level, in order
to build a mechanism that associates the extent to which a software component
(class or package) is adopted/preferred by developers. We define a ground truth
score for the user-perceived quality of components based on popularity-related
information extracted from their GitHub repos, in the form of stars and forks.
Then, at each level, we employ a one-class classifier and build a model based
on static analysis metrics extracted from a set of popular GitHub projects. By
using Principal Feature Analysis and examining the semantics among metrics,
we provide the developer with not only a quality score, but also a comprehensive
analysis on five axes for the source code of a component, including scores on its
complexity, coupling, size, degree of inheritance, and the quality of its documentation. Finally, for each level, we construct five Neural Networks models, one for
each of these code properties, and aggregate their output to provide an overall
quality scoring mechanism at class and package level, respectively.
The rest of this paper is organized as follows. Section 2 provides background
information on static analysis metrics and reviews current approaches on quality
Assessing the User-Perceived Quality of Source Code Components
5
estimation. Section 3 describes our benchmark dataset and designs a scoring
mechanism for the quality of source code components. The constructed models
are shown in Sect. 4, while Sect. 5 evaluates the performance of our system.
Finally, Sect. 6 concludes this paper and provides insight for further research.
2
Related Work
According to [14], research on software quality is as old as software development.
As software penetrates everyday life, assessing quality has become a major challenge. This is reflected in the various approaches proposed by current literature
that aspire to assess quality in a quantified manner. Most of these approaches
make use of static analysis metrics in order to train quality estimation models [12,18]. Estimating quality through static analysis metrics is a non-trivial
task, as it often requires determining quality thresholds [4], which is usually
performed by experts who manually examine the source code [8]. However, the
manual examination of source code, especially for large complex projects that
change on a regular basis, is not always feasible due to constraints in time and
resources. Moreover, expert help may be subjective and highly context-specific.
Other approaches may require multiple parameters for constructing quality
evaluation models [2], which are again highly dependent on the scope of the source
code and are easily affected by subjective judgment. Thus, a common practice
involves deriving metric thresholds by applying machine learning techniques on
a benchmark repository. Ferreira et al. [6] propose a methodology for estimating
thresholds by fitting the values of metrics into probability distributions, while [1]
follow a weight-based approach to derive thresholds by applying statistical analysis on the metrics values. Other approaches involve deriving thresholds using bootstrapping [7] and ROC curve analysis [20]. Still, these approaches are subject to the
projects selected for the benchmark repository.
An interesting approach that refrains from the need to use certain metrics
thresholds and proposes a fully automated quality evaluation methodology is
that of Papamichail et al. [15]. The authors design a system that reflects the
extent to which a software component is of high quality as perceived by developers. The proposed system makes use of crowdsourcing information (the popularity of software projects) and a large set of static analysis metrics, in order to
provide a single quality score, which is computed using two models: a one-classclassifier used to identify high quality code and a neural network that translates
the values of the static analysis metrics into quantified quality estimations.
Although the aforementioned approaches can be effective for certain cases,
their applicability in real-world scenarios is limited. The use of predefined thresholds [4,8] results in the creation of models unable to cover the versatility of
today’s software, and thus applies only to restricted scenarios. On the other
hand, systems that overcome threshold issues by proposing automated quality
evaluation methodologies [15] often involve preprocessing steps (such as feature
extraction) or regression models that lead to a quality score which is not interpretable. As a result, the developer is provided with no specific information on
the targeted changes to apply in order to improve source code quality.
6
V. Dimaridou et al.
Extending previous work [5], we have built a generic source code quality
estimation mechanism able to provide a quality score at both class and package
levels, which reflects the extent to which a component could/should be adopted
by developers. Our system refrains from expert-based knowledge and employs a
large set of static analysis metrics and crowdsourcing information from GitHub
stars and forks in order to train five quality estimation models for each level, each
one targeting a different property of source code. The individual scores are then
combined to produce a final quality score that is fully interpretable and provides
necessary information towards the axes that require improvement. By further
analyzing the correlation and the semantics of the metrics for each axis, we are
able to identify similar behaviors and thus select the ones that accumulate the
most valuable information, while at the same time describing the characteristics
of the source code component under examination.
3
Defining Quality
In this section, we quantify quality as perceived by developers using information
from GitHub stars and forks as ground truth. In addition, our analysis describes
how the different categories of source code metrics are related to major quality
characteristics as defined in ISO/IEC 25010:2011 [10].
3.1
Benchmark Dataset
Our dataset consists of a large set of static analysis metrics calculated for 102
repositories, selected from the 100 most starred and the 100 most forked GitHub
Java projects. The projects were sorted in descending order of stars and subsequently forks, and were selected to cover more than 100,000 classes and 7,300
projects. Certain statistics of the benchmark dataset are shown in Table 1.
Table 1. Dataset statistics [5].
Statistics
Total number of projects
Total number of packages
Total number of classes
Total number of methods
Total lines of code
Dataset
102
7, 372
100, 233
584, 856
7, 985, 385
We compute a large set of static analysis metrics that cover the source code
properties of complexity, coupling, documentation, inheritance, and size. Current literature [9,11] indicates that these properties are directly related to the
characteristics of Functional Suitability, Usability, Maintainability, and Portability, as defined by ISO/IEC 25010:2011 [10]. The metrics that were computed
Assessing the User-Perceived Quality of Source Code Components
7
Table 2. Overview of static metrics and their applicability on different levels.
Static analysis metrics
Type
Complexity
Coupling
Cohesion
Name
Size
Class Package
NL
Nesting Level
×
NLE
Nesting Level Else-If
×
WMC
Weighted Methods per Class
×
CBO
Coupling Between Object classes
×
CBOI
CBO Inverse
×
NII
Number of Incoming Invocations
×
NOI
Number of Outgoing Invocations
×
RFC
Response set For Class
×
LCOM5
Lack of Cohesion in Methods 5
×
API Documentation
×
CD
Comment Density
×
×
CLOC
Comment Lines of Code
×
×
DLOC
Documentation Lines of Code
×
PDA
Public Documented API
×
×
PUA
Public Undocumented API
×
×
TAD
Total API Documentation
TCD
Total Comment Density
×
×
TCLOC
Total Comment Lines of Code
×
×
TPDA
Total Public Documented API
TPUA
Total Public Undocumented API
DIT
Depth of Inheritance Tree
×
NOA
Number of Ancestors
×
NOC
Number of Children
×
NOD
Number of Descendants
×
NOP
Number of Parents
×
{L}LOC
{Logical} Lines of Code
×
×
N{A, G, M, S}
Number of {Attributes, Getters,
Methods, Setters}
×
×
N{CL, EN, IN, P}
Number of {Classes, Enums,
Interfaces, Packages}
NL{A, G, M, S}
Number of Local {Attributes, Getters, ×
Methods, Setters}
NLP{A, M}
Number of Local Public {Attributes,
Methods}
×
NP{A, M}
Number of Public {Attributes,
Methods}
×
NOS
Number of Statements
×
T{L}LOC
Total {Logical} Lines of Code
×
TNP{CL, EN, IN}
Total Number of Public {Classes,
Enums, Interfaces}
Documentation AD
Inheritance
Compute levels
Description
TN{CL, DI, EN, FI} Total Number of {Classes, Directories,
Enums, Files}
×
×
×
×
×
×
×
×
8
V. Dimaridou et al.
using SourceMeter [21] are shown in Table 2. In our previous work [5], the metrics
were computed at class level, except for McCC that was computed at method
level and then averaged to obtain a value for the class. For this extended work
the metrics were computed at a package level, except for the metrics that are
available only at class level. These metrics were initially calculated at class level
and the median of each one was enumerated to obtain values for the packages.
3.2
Quality Score Formulation
As already mentioned, we use GitHub stars and forks as ground truth information towards quantifying quality as perceived by developers. According to our
initial hypothesis, the number of stars can be used as a measure of the popularity
for a software project, while the number of forks as a measure of its reusability.
We make use of this information in order to define our target variable and consequently build a quality scoring mechanism. Towards this direction, we aim to
define a quality score for every class and every package included in the dataset.
Given, however, that the number of stars and forks refer to repository level,
they are not directly suited for defining a score that reflects the quality of each
class or package, individually. Obviously, equally splitting the quality score computed at repository level among all classes or packages is not optimal, as every
component has a different significance in terms of functionality and thus must
be rated as an independent entity. Consequently, in an effort to build a scoring mechanism that is as objective as possible, we propose a methodology that
involves the values of static analysis metrics for modeling the significance of each
source code component (class or package) included in a given repository.
The quality score for every software component (class or package) of the
dataset is defined using the following equations:
Sstars (i, j) = (1 + N P M (j)) ·
Stars(i)
Ncomponents (i)
Sf orks (i, j) = (1 + AD(j) + N M (j)) ·
F orks(i)
Ncomponents (i)
Qscore (i, j) = log(Sstars (i, j) + Sf orks (i, j))
(1)
(2)
(3)
where Sstars (i, j) and Sf orks (i, j) represent the quality scores for the j-th source
code component (class or package) contained in the i-th repository, based on the
number of GitHub stars and forks, respectively. Ncomponents (i) corresponds to
the number of source code components (classes or packages) contained in the i-th
repository, while Stars(i) and F orks(i) refer to the number of its GitHub stars
and forks, respectively. Finally, Qscore (i, j) is the overall quality score computed
for the j-th source code component (class or package) contained in the i-th
repository.
Our target set also involves the values of three metrics as a measure of the
significance for every individual class or package contained in a given repository.
Different significance implies different contribution to the number of GitHub
Assessing the User-Perceived Quality of Source Code Components
9
stars and forks of the repository and thus different quality scores. N P M (j) is
used to measure the degree to which the j-th class (or package) contributes to
the number of stars of the repository, as it refers to the number of methods and
thus the different functionalities exposed by the class (or package). As for the
contribution at the number of forks, we use AD(j), which refers to the ratio of
documented public methods, and N M (j), which refers to the number of methods
of the j-th class (or package), and therefore can be used as a measure of its
functionalities. Note that the provided functionalities pose a stronger criterion
for determining the reusability score of a source code component compared to
the documentation ratio, which contributes more as the number of methods
approaches to zero. Lastly, as seen in equation (3), the logarithmic scale is applied
as a smoothing factor for the diversity in the number of classes and packages
among different repositories. This smoothing factor is crucial, since this diversity
does not reflect the true quality difference among the repositories.
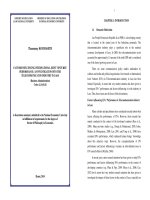
Figure 1 illustrates the distribution of the quality score (target set) for the
benchmark dataset classes and packages. Figure 1(a) refers to classes, while
Fig. 1(b) refers to packages. The majority of instances for both distributions
are accumulated in the interval [0.1, 0.5] and their frequency is decreasing as the
score reaches 1. This is expected, since the distributions of the ratings (stars or
forks) provided by developers typically exhibit few extreme values.
4
System Design
In this section we design our system for quality estimation based on static analysis metrics. We split the dataset of the previous section into two sets, one for
training and one for testing. The training set includes 90 repositories with 91531
classes distributed within 6632 packages and the test set includes 12 repositories
with 8702 classes distributed within 738 packages. For the training, we used all
available static analysis metrics except for those used for constructing the target
variable. In specific, AD, NPM, NM, and NCL were used only for the preprocessing stage and then excluded from the models training to avoid skewing the
results. In addition, any components with missing metric values are removed
(e.g. empty class files or package files containing no classes); hence the updated
training set contains 5599 packages with 88180 class files and the updated test
set contains 556 packages with 7998 class files.
4.1
System Overview
Our system is shown in Fig. 3. The input is given in the form of static analysis
metrics, while the stars and forks of the GitHub repositories are required only for
the training of the system. As a result, the developer can provide a set of classes
or packages (or a full project), and receive a comprehensible quality analysis as
output. Our methodology involves three stages: the preprocessing stage, the metrics selection stage, and the model estimation stage. During preprocessing, the
target set is constructed using the analysis of Sect. 3, and the dataset is cleaned
10
V. Dimaridou et al.
Fig. 1. Distribution of the computed quality score at (a) class and (b) package level.
of duplicates and outliers. Metrics selection determines which metrics will be
used for each metric category, and model estimation involves training 5 models,
one for each category. The stages are analyzed in the following paragraphs.
4.2
Data Preprocessing
The preprocessing stage is used to eliminate potential outliers from the dataset
and thus make sure that the models are trained as effectively as possible. To
do so, we developed a one-class classifier for each level (class/package) using
Support Vector Machines (SVM) and trained it using metrics that were selected
by means of Principal Feature Analysis (PFA).
At first, the dataset is given as input in two PFA models which refer to classes
and packages, respectively. Each model performs Principal Component Analysis
(PCA) to extract the most informative principal components (PCs) from all
metrics applicable at each level. In the case of classes, we have 54 metrics, while
in the case of packages, we have 68. According to our methodology, we keep the
first 12 principal components, preserving 82.8% of the information in the case
Fig. 2. Overview of the quality estimation methodology [5].
Assessing the User-Perceived Quality of Source Code Components
11
of classes and 82.91% in the case of packages. Figure 3 depicts the percentage
of variance for each principal component. Figure 3(a) refers to class level, while
Fig. 3(b) refers to package level. We follow a methodology similar to that of [13]
in order to select the features that shall be kept. The transformation matrix
generated by each PCA includes values for the participation of each metric in
each principal component.
Fig. 3. Variance of principal components at (a) class and (b) package level.
We first cluster this matrix using hierarchical clustering and then select a
metric from each cluster. Given that different metrics may have similar trends
(e.g. McCabe Complexity with Lines of Code), complete linkage was selected
to avoid large heterogeneous clusters. The dendrograms of the clustering for
both classes and packages is shown in Fig. 4. Figure 4(a) refers to classes, while
Fig. 4(b) refers to packages.
The dendrograms reveal interesting associations among the metrics. The clusters correspond to categories of metrics which are largely similar, such as the
metrics of the local class attributes, which include their number (NLA), the number of the public ones (NLPA), and the respective totals (TNLPA and TNLA)
that refer to all classes in the file. In both class and package levels, our clustering
reveals that keeping one of these metrics results in minimum information loss.
Thus, in this case we keep only TNLA. The selection of the kept metric from each
cluster in both cases (in red in Fig. 4) was performed by manual examination to
end up with a metrics set that conforms to the current state-of-the-practice. An
alternative would be to select the metric which is closest to a centroid computed
as the Euclidean mean of the cluster metrics.
After having selected the most representative metrics for each case, the next
step is to remove any outliers. Towards this direction, we use two SVM one-class
classifiers for this task, each applicable at a different level. The classifiers use
a radial basis function (RBF) kernel, with gamma and nu set to 0.01 and 0.1
respectively, and the training error tolerance is set to 0.01. Given that our dataset
contains popular high quality source code, outliers in our case are actually low
12
V. Dimaridou et al.
Fig. 4. Dendrogram of metrics clustering at (a) class and (b) package level. (Color
figure online)
quality classes or packages. These are discarded since the models of Fig. 2 are
trained on high quality source code. As an indicative assessment of our classifier,
we use the code violations data described in Sect. 3.
In total, the one-class classifiers ruled out 8815 classes corresponding to 9.99%
of the training set and 559 packages corresponding to 9.98% of the training set.
We compare the mean number of violations for these rejected classes/packages
and for the classes/packages that were accepted, for 8 categories of violations.
The results, which are shown in Table 3, indicate that our classifier successfully rules out low quality source code, as the number of violations for both the
rejected classes and packages is clearly higher than that of the accepted.
For instance, the classes rejected by the classifier are typically complex since
they each have on average approximately one complexity violation; on the other
Assessing the User-Perceived Quality of Source Code Components
13
Table 3. Mean number of violations of accepted and rejected components.
Violation types Mean number of violations
Classes
Packages
Accepted Rejected Accepted Rejected
WarningInfo
18.5276
83.0935
376.3813 4106.3309
Clone
4.3106
20.9365
2.9785
10.7513
Cohesion
0.3225
0.7893
0.2980
0.6556
Complexity
0.0976
1.2456
0.0907
0.9320
Coupling
0.1767
1.5702
0.2350
1.2486
Documentation 12.5367
49.9751
13.9128
37.2039
Inheritance
0.0697
0.4696
0.0439
0.2280
Size
1.0134
8.1069
1.2812
5.6296
hand, the number of complexity violations for the accepted classes is minimal.
Furthermore, on average each rejected class has more than 8 size violations (e.g.
large method bodies), whereas accepted classes have approximately 1.
4.3
Models Preprocessing
Before model construction, we use PFA to select the most important metrics
for each of the five metric categories: complexity metrics, coupling metrics, size
metrics, inheritance metrics, and documentation metrics. As opposed to data
preprocessing, PFA is now used separately per category of metrics. We also
perform discretization on the float variables (TCD, NUMPAR, McCC) and on
the target variable and remove any duplicates in order to reduce the size of the
dataset and thus improve the training of the models.
Analysis at Class Level
Complexity Model. The dataset has four complexity metrics: NL, NLE, WMC,
and McCC. Using PCA and keeping the first 2 PCs (84.49% of the information),
the features are split in 3 clusters. Figure 5(a) shows the correlation of the metrics
with the first two PCs, with the selected metrics (NL, WMC, and McCC) in red.
Coupling Model. The coupling metrics are CBO, CBOI, NOI, NII, and RFC. By
keeping the first 2 PCs (84.95% of the information), we were able to select three
of them, i.e. CBO, NII, and RFC, so as to train the ANN. Figure 5(b) shows the
metrics in the first two PCs, with the selected metrics in red.
Documentation Model. The dataset includes five documentation metrics (CD,
CLOC, DLOC, TCLOC, TCD), out of which DLOC, TCLOC, and TCD were
found to effectively cover almost all valuable information (2 principal components