Ebook Brain Imaging with MRI and CT: Part 2
Bạn đang xem bản rút gọn của tài liệu. Xem và tải ngay bản đầy đủ của tài liệu tại đây (45.87 MB, 218 trang )
SECTION 4
Abnormalities Without Significant Mass Effect
Cases
A. Primarily Non-Enhancing
97 Dural Venous Sinus Thrombosis
Giulio Zuccoli
98 Dural Arteriovenous Fistula
Matthew Omojola and Zoran Rumboldt
99 Subarachnoid Hemorrhage
Matthew Omojola
100 Laminar Necrosis
Matthew Omojola
101 Neurocutaneous Melanosis
Majda Thurnher
102 Superficial Siderosis
Mauricio Castillo
103 Polymicrogyria
Maria Vittoria Spampinato
104 Seizure-Related Changes (Peri-Ictal MRI Abnormalities)
Mauricio Castillo
105 Embolic Infarcts
Benjamin Huang
106 Focal Cortical Dysplasia
Zoran Rumboldt and Maria Gisele Matheus
107 Tuberous Sclerosis
Maria Gisele Matheus
108 Dysembroplastic Neuroepithelial Tumor (DNT, DNET)
Giovanni Morana
109 Nonketotic Hyperglycemia With Hemichorea–Hemiballismus
Zoran Rumboldt
110 Hyperdensity following Endovascular Intervention
Zoran Rumboldt and Benjamin Huang
111 Early (Hyperacute) Infarct
Benjamin Huang
112 Acute Disemminated Encephalomyelitis (ADEM)
Benjamin Huang
113 Susac Syndrome
Mauricio Castillo
114 Diffuse Axonal Injury
Majda Thurnher
115 Multiple Sclerosis
Matthew Omojola and Zoran Rumboldt
116 Progressive Multifocal Leukoencephalopathy (PML)
Zoran Rumboldt
117 Nodular Heterotopia
Maria Gisele Matheus
Other Relevant Cases
19 Lissencephaly
Mariasavina Severino
20 Herpes Simplex Encephalitis
Zoran Rumboldt and Mauricio Castillo
21 Limbic Encephalitis
Mauricio Castillo
B. Primarily Enhancing
118 Neurosarcoidosis
Zoran Rumboldt
119 Meningeal Carcinomatosis
Alessandro Cianfoni
120 Meningitis (Infectious)
Mauricio Castillo
121 Perineural Tumor Spread
Zoran Rumboldt
122 Moyamoya
Maria Vittoria Spampinato
123 Central Nervous System Vasculitis
Giulio Zuccoli
124 Subacute Infarct
Benjamin Huang and Zoran Rumboldt
125 Active Multiple Sclerosis
Mariasavina Severino
126 Capillary Telangiectasia
Alessandro Cianfoni
127 Developmental Venous Anomaly
Giulio Zuccoli
128 Immune Reconstitution Inflammatory Syndrome (IRIS)
Zoran Rumboldt
129 Ventriculitis
Zoran Rumboldt and Majda Thurnher
Other Relevant Cases
30 X-linked Adrenoleukodystrophy
Mariasavina Severino
33 Alexander Disease
Mariasavina Severino
37 Spontaneous Intracranial Hypotension
Maria Vittoria Spampinato
86 Sturge–Weber Syndrome
Maria Gisele Matheus
SECTION 4A
A
Abnormalities Without Significant Mass Effect: Primarily Non-Enhancing
B
C
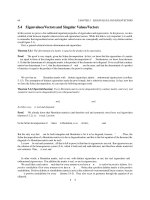
Figure 1. Non-enhanced axial CT image (A) shows hyperdensity in the superior sagittal sinus (arrow). Sagittal T1WI (B) reveals increased
signal within the sinus (arrows). Corresponding (slightly tilted anteriorly) post-contrast T1WI (C) shows lack of normal enhancement (arrows)
within the sinus. Compare to normal enhancing vein of Galen and straight sinus (arrowheads).
A
B
C
Figure 2. Enhanced axial CT image (A) shows a filling defect (arrows) in the superior sagittal sinus. Sagittal T1WI (B) shows increased
intensity of the anterior superior sagittal sinus (arrows). Compare to normal posterior aspect of the sinus (arrowheads). Peripheral enhancement
around the sinus filling defect (arrow) is seen on coronal post-contrast T1WI (C).
Figure 3. Non-enhanced axial CT image
(A) shows hyperdensity of the right sigmoid
sinus (arrow). Posterior right oblique MIP from
post-contrast MRV (B) demonstrates absence
of the right transverse and sigmoid sinuses
as well as the internal jugular vein. Note
normal left transverse sinus (small arrowhead),
sigmoid sinus (large arrowhead), and internal
jugular vein (arrow).
A
200
B
CASE
97
Dural Venous Sinus Thrombosis
GIULIO ZUCCOLI
Specific Imaging Findings
Congenital Hypoplasia/Atresia
Increased density in the occluded sinus leading to a “cord
sign” is the classic imaging finding of dural venous sinus
thrombosis (DVST) on unenhanced CT images. However, a
high variability in the degree of thrombus density is responsible for a low sensitivity of this sign. Thus, evaluation with
CT angiogram, MR and MRV may be required to confirm the
diagnosis. The “empty delta” sign consisting of a triangular
area of enhancement with a relatively low-density center is
seen in 25–30% of cases on contrast-enhanced CT scans. On
MRI, acute thrombus is T1 isointense, T2 and T2* hypointense. Of note, this T2 hypointensity may mimic normal flowvoid. Peripheral enhancement is seen around the acute
hypointense clot corresponding to the empty delta CT sign.
Subacute thrombus becomes T1 and T2 hyperintense. Chronic
thrombus is most commonly T1 isointense and T2 hyperintense. DWI/ADC signal of the thrombus is variable, as is the
degree of enhancement in organized thrombus. Visible serpiginous intrathrombus flow-voids on T2WI, corresponding
areas of flow signal on TOF-MRV, and brightly enhancing
channels on post-contrast MRV are present in most cases of
chronic partial recanalization. Thrombosis shows no flowrelated signal on phase contrast MRV, and absent to diminished enhancement on post contrast MRV and CTV. Engorged
collateral veins may be present, primarily in the chronic phase.
TOF-MRV of a subacute T1 bright clot may potentially misrepresent sinus patency.
• unilateral transverse sinus, variant anatomy of the torcular
herophili
• focal areas of narrowing may be indistinguishable
Pertinent Clinical Information
DVST has a large spectrum of clinical manifestations as it may
present with headache, seizure, papilledema, altered mental
status, and focal neurological deficit including cranial nerve palsies. Unilateral headache is more common than diffuse headache.
However, pain location is not associated with the site of thrombosis. Affected patients may initially show subarachnoid hemorrhage sparing the basal cisterns.
Differential Diagnosis
Normal Dural Venous Sinuses
• blood in venous sinuses is usually slightly hyperdense; especially in newborns, physiologic polycythemia in combination
with unmyelinated brain makes the dural sinuses appear
hyperdense
Acute Subdural Hematoma (133)
• blood along the entire tentorium of the cerebellum, not limited
to the periphery
Prominent Arachnoid Granulations (Pacchioni’s
Granulations) (130)
• typically round or ovoid filling defect of CSF density/intensity
• transverse and superior sagittal sinus locations are typical
Background
DVST is a rare cause of stroke affecting all age groups and
accounting for 1–2% of strokes in adults. While age distribution
is uniform in men, a peak incidence is reported in women aged
20–35 years which may be related to pregnancy and use of
contraceptives. DVST should always be considered in the differential diagnosis in patients with severe headache, focal neurological deficits, idiopathic intracranial hypertension and
intracranial hemorrhage. Many causative conditions have been
described in DVST including infections, trauma, hypercoagulable
states, hyperhomocysteinemia, hematologic disorders, collagenopathies, inflammatory bowel diseases, use of medications, and
intracranial hypotension. Thrombosis most frequently affects the
superior sagittal sinus. However, multiple locations, particularly
in the contiguous transverse and sigmoid sinuses, are found in
as many as 90% of patients. Focal brain abnormalities have
been found in as many as 57% of patients. Bleeding represents
a non-negligible complication of thrombolytic therapy, potentially affecting patients’ outcome.
references
1. Leach JL, Fortuna RB, Jones BV, Gaskill-Shipley MF. Imaging of
cerebral venous thrombosis: current techniques, spectrum of findings,
and diagnostic pitfalls. Radiographics 2006;26(Suppl 1):S19–41.
2. Meckel S, Reisinger C, Bremerich J, et al. Cerebral venous thrombosis:
diagnostic accuracy of combined, dynamic and static, contrast-enhanced
4D MR venography. AJNR 2010;31:527–35.
3. Leach JL, Wolujewicz M, Strub WM. Partially recanalized chronic
dural sinus thrombosis: findings on MR imaging, time-of-flight MR
venography, and contrast-enhanced MR venography. AJNR
2007;28:782–9.
4. Oppenheim C, Domingo V, Gauvrit JY, et al. Subarachnoid
hemorrhage as the initial presentation of dural sinus thrombosis. AJNR
2005;26:614–7.
5. Dentali F, Squizzato A, Gianni M, et al. Safety of thrombolysis in
cerebral venous thrombosis. A systematic review of the literature. Thromb
Haemost 2010;104:1055–62.
201
Brain Imaging with MRI and CT, ed. Zoran Rumboldt et al. Published by Cambridge University Press. © Cambridge University Press 2012.
SECTION 4A
A
Abnormalities Without Significant Mass Effect: Primarily Non-Enhancing
B
C
Figure 1. Axial T2WI (A) shows large tortuous basal veins of Rosenthal (arrows) and vessels within the right temporo-occipital sulci (arrowheads).
Slightly more cephalad (B) a large vein of Galen (black arrow), tortuous sulcal signal voids (arrowhead) and large subgaleal veins (white
arrow) are seen. Post-contrast T1WI (C) shows enhancement of leptomeningeal vessels on the right and bilateral medullary veins (arrows).
Figure 2. Contrast-enhanced MRV reveals
multiple small curvilinear structures (arrows)
on the left. Left transverse and sigmoid
sinuses show areas of narrowing and
occlusion. Normal right transverse and
sigmoid sinuses (arrowheads).
A
C
B
D
Figure 3. 3D TOF MRA source images (A, B) show multiple high-intensity structures
(arrowheads) adjacent to left jugular bulb (arrows) with extension into the bulb. At a more
cephalad level (C, D) bright linear structures (arrowheads) are adjacent and extending into the
left sigmoid sinus (arrow). Note mild hyperintensity of left sigmoid sinus and jugular bulb.
Figure 4. Axial post-contrast T1WI (A) shows
enhancing prominent venous structures
(arrows) and adjacent hypointense edema in
the subcortical white matter. Corresponding
FLAIR image (B) more clearly shows the
hyperintensity of edema (arrows) caused by
venous hypertension.
A
202
B
CASE
98
Dural Arteriovenous Fistula
MA T T H E W O M O JO L A A N D Z O R A N R U M B O L D T
Specific Imaging Findings
Venous Thrombosis (97)
Dural arteriovenous fistula (DAVF) may not be visualized on
routine CT or MRI images. MRI findings of larger or high-flow
DAVFs include: multiple extra axial linear or tortuous flow-voids
on T2WI, either at the base of the brain, around the tentorial
incisura, in the basal cisterns, or in the sulci along the convexity,
which are even better visualized with susceptibility-weighted
imaging (SWI). Major deep and superficial draining veins may
be enlarged. Large tortuous signal voids may be present in the
scalp of the affected side. Post-contrast images may show prominent tortuous vessels within the sulci indicating retrograde cortical venous drainage. Large deep medullary (white matter) veins
and white matter T2 hyperintensity are indicative of venous
hypertension. Perfusion studies show increased relative cerebral
blood volume (rCBV) in all of these patients. CT demonstrates
complications, primarily subarachnoid, subdural, parenchymal,
or occasionally intraventricular hemorrhages. MRA or CTA in the
high-flow DAVF often show enlarged tortuous arterial and
venous structures. Findings of high intensity structures adjacent
to the sinus wall on 3D TOF MRA appear to be diagnostic of
DAVF. MRV confirms enlarged venous structures and may show
evidence of venous sinus thrombosis or occlusion. DSA demonstrates the exact fistula site, is very useful for treatment planning
and offers endovascular treatment options.
• presence of intraluminal clot
• may lead to DAVF
Pertinent Clinical Information
references
DAVFS occur in adults, more commonly females. They may
be clinically silent and incidentally found at imaging. Pulsatile
tinnitus, audible bruit, headache, cognitive impairment, seizures,
cranial nerve palsies and focal neurologic deficit may all occur in
patients with DAVF. Lesions located in the cavernous sinus region
present with ophthalmoplegia, eye pain, orbital congestion or features of carotid cavernous fistula. Development of venous hypertension frequently leads to progressive dementia. Acute symptoms
may be due to intracranial hemorrhages, which occur in DAVFs
with retrograde cortical flow. Therefore, the presence of retrograde
cortical flow represents a clear indication for treatment of these
lesions.
Differential Diagnosis
Arteriovenous Malformation (AVM) (182)
• usually parenchymal in location with a focal nidus (“bag of
worms”) best seen on T2-weighted images
Background
DAVF is thought to represent acquired pachymeningeal connection between arteries and veins without an intervening nidus.
The true incidence is not known, but has been reported to
represent about 10–15% of all intracranial vascular malformations. Common locations are tentorial, parasellar, along the
transverse sinuses and falx. Dural sinus thrombosis and trauma
are considered responsible for development of these lesions.
DAVF may occur and occlude spontaneously. There are various
classification methods of DAVF based upon the venous outflow
pattern and associated outflow restrictions, which might influence
the clinical presentation and treatment outcomes. Retrograde flow
into cortical veins results in deep venous engorgement, leading
to venous hypertension, which in turn leads to ischemia and
hemorrhage.
Recent developments in rapid 4D contrast-enhanced MR angiography technique are very promising and it may eventually
obviate the need for diagnostic catheter angiography.
1. Kwon BJ, Han MH, Kang HS, Chang KH. MR imaging findings of
intracranial dural arteriovenous fistulas: relations with venous drainage
patterns. AJNR 2005;26:2500–7.
2. Noguchi K, Melhem ER, Kanazawa T, et al. Intracranial dural
arteriovenous fistulas: evaluation with combined 3D time-of-flight
MR angiography and MR digital subtraction angiography. AJR
2004;182:183–90.
3. Meckel S, Maier M, San Millan Ruiz D, et al. MR angiography of
dural arteriovenous fistulas: diagnosis and follow-up after treatment
using a time-resolved 3D contrast-enhanced technique. AJNR
2007;28:877–84.
4. Nishimura S, Hirai T, Sasao A, et al. Evaluation of dural arteriovenous
fistulas with 4D contrast-enhanced MR angiography at 3T. AJNR
2010;31:80–5.
5. Noguchi K, Kuwayama N, Kubo M, et al. Intracranial dural
arteriovenous fistula with retrograde cortical venous drainage: use of
susceptibility-weighted imaging in combination with dynamic
susceptibility contrast imaging. AJNR 2010;31:1903–10.
203
Brain Imaging with MRI and CT, ed. Zoran Rumboldt et al. Published by Cambridge University Press. © Cambridge University Press 2012.
SECTION 4A
Abnormalities Without Significant Mass Effect: Primarily Non-Enhancing
B
A
C
Figure 1. Non-enhanced CT (A) shows hyperdensity throughout basal cisterns extending into sylvian (arrows) and interhemispheric
(arrowhead) fissures. A more cephalad CT (B) shows subtle sulcal iso- to hyperdensity (arrowheads). Midsagittal T1WI (C) reveals isodense
material within the cisterns (arrows).
Figure 2. Non-enhanced CT (A) shows hyperintensity
within the right sylvian fissure (arrow) and layering in the
lateral ventricle (arrowhead). CT along the convexity (B)
shows subtle sulcal hyperintensities (arrow), better seen
(arrow) on corresponding FLAIR image (C).
B
A
C
3
A
4
Figures 3 and 4. Non-enhanced CT images
in two patients show perimesencephalic
hemorrhage (arrows), limited to basal cisterns.
204
B
Figure 5. Axial FLAIR image (A) shows subtle hyperintensity of the CSF-containing spaces
along the brain surface (arrow) and within ventricles (arrowhead). Corresponding
hypointensity is not well appreciated on T2*WI (B).
CASE
99
Subarachnoid Hemorrhage
MA T T H E W O M O JO L A
Specific Imaging Findings
Meningitis (120)
On CT, subarachnoid hemorrhage (SAH) characteristically presents as hyperdense material filling the basal cisterns and/or
fissures and cortical sulci. The density and extent depend on the
volume of blood. If sufficiently diluted by the CSF, a small SAH
may not be seen on CT. Dilution and redistribution may lead to
intraventricular extension and the hyperdensity gradually fades
away. Diluted SAH can appear as effacement of the cortical sulci.
Traumatic SAH may be associated with other injuries such as
parenchymal and extra-axial hematomas. The most common
cause of nontraumatic SAH is aneurysmal rupture, usually presenting with diffuse SAH, while a filling defect within the hyperdense clot may indicate the aneurysm location. An associated
parenchymal hematoma may also be present. Nonaneurysmal
SAH (NASAH) is most commonly perimesencephalic, located
almost exclusively in the basal cisterns with possible minimal
extension into the interhemispheric and sylvian fissures. Other
types of NASAH tend to be located along the convexity – apart
from trauma, vasculitis, cortical vein thrombosis, Moyamoya,
and cerebral amyloid angiopathy may present this way. On
MRI, SAH is best seen with FLAIR sequence, which is more
sensitive than CT. T2*WI tend to show hypointensity, but this
is variable. Hyperacute SAH (within the first few hours), similar
to hyperacute hematoma, is extremely T2 hyperintense, brighter
than the CSF; it becomes hypointense in the acute phase. T1
signal varies but is always hyperintense compared to the CSF.
Leptomeningeal enhancement may be present. In patients with
nontraumatic SAH and either the perimesencephalic pattern or
no blood on CT, negative CTA is reliable in ruling out aneurysms.
DSA is indicated for diffuse SAH with negative CTA.
• high protein content of CSF may be indistinguishable from
SAH on FLAIR
• not CT hyperdense, no signal loss on T2* images
Pertinent Clinical Information
Acute nontraumatic SAH typically presents with a sudden onset
“thunderclap” headache described as “the worst headache ever”.
Prodromal or sentinel headache is reported by many patients.
Nausea and vomiting are common, photophobia and neck stiffness may be present. Hydrocephalus and vasospasm are the main
complications of SAH. The presence of three or more separate
areas of SAH in traumatized patients is a poor prognostic
indicator.
Differential Diagnosis
Diffuse Brain Edema
• diffuse hypodensity of the brain with loss of differentiation
between gray and white matter
• cerebellum usually spared, appears relatively hyperdense
• fading SAH may resemble cerebral edema due to effacement of
cortical sulci
Collateral Leptomeningeal Vessels in Arterial Occlusions
(Moyamoya) (122)
• vascular structures can usually be identified
• uncommon in basal cisterns
Cortical Vein Thrombosis (181)
• localized sulcal CT hyperdensity and T2* hypointensity corresponding to cortical vein
• adjacent parenchymal infarct and/or hemorrhage may be
present
Background
The most common cause of nontraumatic SAH is by far rupture
of intracranial aneurysm (about 85% of cases). Mortality of
aneurysmal SAH is very high at about 30–40% with permanent
neurological deficit in another third of patients. Recent advances
in diagnosis and treatment appear to have somewhat mitigated
the morbidity and mortality of SAH. CT is diagnostic in about
100% of patients within the first 12 h of a major SAH. About 10%
of SAH may not be detectable after 24 h. A negative CT scan in
the appropriate clinical setting should be followed by a lumbar
puncture. CTA has become the main technique for detection of
aneurysms. DSA offers both diagnostic confirmation and endovascular embolization treatment. Around 8–10% of patients have
NASAH, most commonly perimesencephalic, which has excellent
prognosis.
references
1. Agid R, Andersson T, Almqvist H, et al. Negative CT angiography
findings in patients with spontaneous subarachnoid hemorrhage:
when is digital subtraction angiography still needed? AJNR
2010;31:696–705.
2. Brinjikji W, Kallmes DF, White JB, et al. Inter and intra observer
agreement in CT characterization of non aneurysmal perimesencephalic
subarachnoid hemorrhage. AJNR 2010;31:1103–5.
3. van Asch CJJ, van der Schaaf IC, Rinkel GJE. Acute hydrocephalus and
cerebral perfusion after aneurysmal subarachnoid hemorrhage. AJNR
2010;31:67–70.
4. Cuvinciuc V, Viguier A, Calviere L, et al. Isolated acute nontraumatic
cortical subarachnoid hemorrhage. AJNR 2010;31:1355–62.
5. Boesiger BM, Shiber JR. Subarachnoid hemorrhage diagnosis by
computed tomography and lumbar puncture: are fifth generation CT
scanners better at identifying subarachnoid hemorrhage? J Emerg Med
2005;29:23–7.
205
Brain Imaging with MRI and CT, ed. Zoran Rumboldt et al. Published by Cambridge University Press. © Cambridge University Press 2012.
SECTION 4A
Abnormalities Without Significant Mass Effect: Primarily Non-Enhancing
A
B
C
Figure 1. Axial non-enhanced CT image (A) a few days following gunshot injury in a young man shows subtle gyral high-density areas
(arrows). Further follow-up CT (B) demonstrates extensive gyral hyperdensity (arrows) in the right hemisphere. Sagittal non-contrast
T1WI (C) reveals gyral hyperintense signal along the parafalcine right parietal cortex (arrows).
Figure 2. Non-enhanced axial CT image (A) in a
patient with sequelae of a remote severe untreated
posterior reversible encephalopathy syndrome
(PRES) shows bilateral predominantly posterior
hypodense areas of encephalomalacia (arrows)
with focal gyral cortical hyperdensities
(arrowheads). Bright cortical lesions (arrowheads)
are more conspicuous on a non-contrast T1WI at
a similar level (B). A more superior T1WI (C) reveals
a prominent left frontal cortical hyperintensity
(arrow), which is further accentuated on the
corresponding FLAIR image (D). Note bilateral areas
of gliosis (arrowheads), with low T1 signal and
hyperintensity on FLAIR image.
206
A
B
C
D
CASE
100
Laminar Necrosis
MA T T H E W O M O JO L A
Specific Imaging Findings
Cortical Calcifications/Mineralization (188, 189, 191)
Acute to subacute laminar necrosis (LN) on CT cannot be
differentiated from brain swelling/edema and often occurs in
the setting of hypoxic–ischemic changes and other lesions that
lead to cerebral edema/swelling. Follow-up CT shows resolution
of edema with possible local volume loss. Chronic LN demonstrates cortical hyperdensity in the affected gyri. MRI of LN in
the acute to subacute setting shows reduced diffusion of the
involved cortical regions, frequently with T2 hyperintensity
and effacement of the sulci. Subcortical U fibers are usually
affected by the edema. There is no evidence of blood products
on T2*-weighted images. Associated deep gray matter changes
may be present depending on the cause of the LN. Gyral
enhancement on post-contrast T1WI may occur, usually in the
subacute stage. Chronic LN is classically visualized as T1 hyperintense gyri with surrounding volume loss. The hyperintensity
may be even more prominent on FLAIR images while diffusion
imaging is unremarkable. Cortical hypointensity is present on
T2* images in some cases. Findings of LN start fading away on
long follow-up studies. Encephalomalacia and gliosis of the
adjacent or other areas of the brain may be present, depending
on the underlying etiology.
• may be permanent on follow-up
• may be indistinguishable on CT and T2*-weighted MRI (calcification and mineralization have been demonstrated in LN)
Specific Clinical Information
LN tends to occur in the setting of hypoxic–ischemic encephalopathy from any cause, infarction, and hypoglycemia. It is seen
with seizures, posterior reversible encephalopathy syndrome
(PRES), mitochondrial disorders, osmotic myelinolysis, CNS
lupus, and brain injury. Extensive changes have a poor prognosis
and tend to be associated with death or vegetative state.
Differential Diagnosis
Cortical Hemorrhage (178, 179, 181)
• usually focal and mass-like
• signal loss on T2* MRI
Hemorrhagic Conversion of Infarct
• usually associated with larger acute infarction
• not limited to the gray matter
• signal loss on T2* MRI
Background
The cortical and deep gray matter is hypermetabolic and as
such is more susceptible to ischemia or anoxia than the white
matter, with the cortical layer 3 being the most vulnerable. LN
is a manifestation of selective vulnerability of the gray matter
and may therefore occur in the absence of white matter
changes. However, severe hypoxic–ischemic changes tend to
also affect the white matter and result in associated encephalomalacia. Histologically, LN has been described as pan necrosis with fat-laden macrophages. Presence of mineralization
such as calcification with traces of iron has also been demonstrated. Acute LN changes could be missed at imaging: brain
swelling may mask the changes on CT while improper
windowing on MR may produce a ‘superscan’ that may initially be mistaken for a normal study. Recently described findings on susceptibility-weighted imaging (SWI) are absence of
blood products in a large proportion of pediatric patients,
while dotted or laminar hemorrhages are found in a minority
of cases. LN in a setting of hypoxic–ischemic encephalopathy,
especially in adults, shows linear gyral and basal ganglia
hypointensities.
references
1. Niwa T, Aida N, Shishikura A, et al. Susceptibility weighted imaging
findings of cortical laminar necrosis in pediatric patients. AJNR
2008;29:1795–8.
2. Kesavadas C, Santhosh K, Thomas B, et al. Signal changes in cortical
laminar necrosis – evidence from susceptibility-weighted magnetic
resonance imaging. Neuroradiology 2009;51:293–8.
3. Siskas N, Lefkopoulos A, Ioannidis I, et al. Cortical laminar necrosis in
brain infarcts: serial MRI. Neuroradiology 2003;45:283–8.
4. McKinney AM, Teksam M, Felice R, et al. Diffusion-weighted imaging
in the setting of diffuse cortical laminar necrosis and hypoxic–ischemic
encephalopathy. AJNR 2004;25:1659–65.
5. Takahashi S, Higano S, Ishii K, et al. Hypoxic brain damage: cortical
laminar necrosis and delayed changes in white matter at sequential MR
imaging. Radiology 1993;189:449–56.
207
Brain Imaging with MRI and CT, ed. Zoran Rumboldt et al. Published by Cambridge University Press. © Cambridge University Press 2012.
SECTION 4A
Abnormalities Without Significant Mass Effect: Primarily Non-Enhancing
Figure 1. Axial T1WI (A) in a child with
seizures shows hyperintense abnormality
(arrow) in the left amygdala, without
significant mass effect or perifocal edema.
T2WI (B) at a similar level fails to reveal any
abnormal signal in the left amygdala (arrow).
A
B
Figure 2. Sagittal T1WI (A) in a neonate
shows hyperintense areas in the cerebellum
(arrowheads) and supratentorial brain (arrow).
Axial IR T1WI (B) also shows the cerebellar
lesions (arrowheads), without mass effect.
T2WI (C) shows a subtle left thalamic
hypointensity (arrow). IR T1WI (D) reveals
corresponding hyperintensity (arrow).
Follow-up IR T1WI at a similar level a year later
(E) shows interval white matter myelination
with decreased conspicuity of the left thalamic
lesion (arrow).
208
A
B
C
D
E
CASE
101
Neurocutaneous Melanosis
MA J D A T HU RNH E R
Specific Imaging Findings
Subarachnoid Hemorrhage (99)
Neurocutaneous melanosis (NCM) appears to involve the brain
in specific locations; most commonly, melanocytic lesions are
detected in the anterior temporal lobe (amygdala) and cerebellum, followed by the pons and medulla oblongata. Round or oval
shaped lesions are best seen on T1-weighted images as areas of
high signal intensity (due to melanin). The lesions are T2 iso- or
hypointense and do not enhance with contrast. The T1 hyperintensity is more conspicuous within the first months of life,
before the myelination appears complete on T1-weighted images.
In patients with leptomeningeal involvement FLAIR images show
sulcal/leptomeningeal hyperintensity and enhancement of the
thickened leptomeninges is seen on post-contrast images, especially prominent along the basal cistern, tentorium, brainstem,
inferior vermis and folia of the cerebellar hemispheres. NCM
lesions are slightly hyperdense on CT; very high density may
suggest associated hemorrhage. Echogenic foci may be seen on
neonatal head ultrasound exam.
• sulcal hyperintensity on FLAIR images is usually more focal
and not diffuse
• typically sudden onset of symptoms
Moyamoya (122)
• prominent flow-voids within the subarachnoid spaces
• parenchymal T1 hyperintensities only if associated with infarct
and/or hemorrhage
Background
NCM typically presents early in childhood. Neurological manifestations of NCM are most commonly related to increased
intracranial pressure, communicating hydrocephalus (due to the
leptomeningeal melanocytic tumors) and epilepsy. Cranial nerve
palsies are frequently associated. The risk for NCM is high in
children with large congenital melanocytic nevi, in particular
those over the trunk and neck with multiple satellite lesions.
The criteria for diagnosing NCM are: (a) large or numerous
pigmented nevi in association with leptomeningeal melanosis,
(b) no evidence of malignant transformation of the cutaneous
lesions, and (c) no malignant melanoma in other organs.
Primary melanocytic lesions of the CNS arise from melanocytes
located within the leptomeninges, and this group includes diffuse melanocytosis and meningeal melanomatosis, melanocytoma, and malignant melanoma. NCM or Touraine syndrome
is a rare, noninherited congenital phakomatosis characterized by
the presence of congenital melanocytic nevi and a benign or
malignant pigmented cell tumor of the leptomeninges. Giant
cutaneous melanocytic nevi (GCMN) and leptomeningeal melanocytosis (LM) are caused by proliferation of melanin-producing cells. Intra-axial benign or malignant melanotic brain
lesions are found in approximately 50% of individuals with
NCM. The overall risk for malignant transformation of nevi is
12%. Symptomatic patients generally have very poor prognosis.
NCM may be associated with other neurocutaneous syndromes
such as Sturge–Weber or von Recklinghausen disease. Features
of Dandy–Walker complex are also present in some cases. NCM
is considered to follow from neurulation disorders, which could
account for the associated developmental malformations.
Although NCM is seen almost exclusively in children with
congenital nevi, rare cases with or without dermatologic lesions
have been described in young adults, in the third and fourth
decades of life.
Differential Diagnosis
references
Pertinent Clinical Information
Metastatic Melanoma (180)
• intracerebral metastases show perifocal edema and/or necrosis
• leptomeningeal enhancement is usually nodular
Meningeal Carcinomatosis (119)
• typically focal linear and/or nodular leptomeningeal contrast
enhancement
• additional parenchymal enhancing lesions are frequently
present
Infectious and Inflammatory Meningeal Processes
(118, 120, 160)
• enhancing meningeal and intraparenchymal enhancing lesions
are T1 hypo- to isointense
• associated hydrocephalus, abscess, and/or empyema may be
present
1. Hayashi M, Maeda M, Maji T, et al. Diffuse leptomeningeal
hyperintensity on fluid-attenuated inversion recovery MR images in
neurocutaneous melanosis. AJNR 2004;25:138–41.
2. Barkovich AJ, Frieden IJ, Williams ML. MR of neurocutaneous
melanosis. AJNR 1994;15:859–67.
3. Smith AB, Rushing EJ, Smirniotopoulos JG. Pigmented lesions of the
central nervous system: radiologic–pathologic correlation. Radiographics
2009;29:1503–24.
4. Sutton BJ, Tatter SB, Stanton CA, Mott RT. Leptomeningeal
melanocytosis in an adult male without large congenital nevi: a rare
and atypical case of neurocutaneous melanosis. Clin Neuropathol
2011;30:178–82.
5. Marnet D, Vinchon M, Mostofi K, et al. Neurocutaneous melanosis
and the Dandy–Walker complex: an uncommon but not so insignificant
association. Childs Nerv Syst 2009;25:1533–9.
209
Brain Imaging with MRI and CT, ed. Zoran Rumboldt et al. Published by Cambridge University Press. © Cambridge University Press 2012.
SECTION 4A
Abnormalities Without Significant Mass Effect: Primarily Non-Enhancing
Figure 1. Axial non-enhanced CT image (A)
in a patient with progressive sensorineural
hearing loss shows only atrophy of the
cerebellum (arrows). Axial T2WI at a similar
level (B) reveals very dark regions (arrows) that
are lining the surface of the superior vermis
and adjacent cerebellar hemispheres (white
arrows) as well as the pons (black arrow).
A
B
Figure 2. Axial FSE T2WI with fat suppression
(A) in another patient shows linear areas of
very low signal in the superior vermis (white
arrowheads) and along the pons (black
arrowheads). Corresponding GRE T2*WI (B)
demonstrates a marked loss of signal intensity
along the superior cerebellum and the
brainstem.
A
B
Figure 3. Axial T2WI reveals dark lining (arrows) along the midbrain
surface. A more subtle dark lining is present along the mesial temporal
lobes and vermis (arrowheads).
210
Figure 4. Axial T2*WI in a young child with history of germinal matrix
hemorrhage shows hypointensity along the surface of the brainstem
and cerebellum (arrows).
CASE
102
Superficial Siderosis
MAURICIO CASTILLO
Specific Imaging Findings
Background
MRI using T2-weighted sequences is the imaging method of
choice, particularly with gradient-recalled echo T2* techniques.
Susceptibility effects induced by superficial siderosis (SS) are
more obvious at 3.0 T than at 1.5 T. A black line follows the
contour of the cerebellum, medulla, pons, and midbrain and to
a lesser extent the supratentorial regions such as the temporal
lobes (particularly the sylvian and interhemispheric fissures). The
cisternal portions of the cranial nerves may also appear dark.
The surface of the spinal cord can also show SS. The cerebellum
commonly shows atrophy particularly in its vermis and the
anterior aspects of the hemispheres. The cerebral hemispheres
may also be atrophic. Occasionally, dystrophic calcifications
develop in areas of chronic SS, which is better seen on CT.
Contrast enhancement may rarely occur. The most important
role of imaging is to look for the underlying cause of SS. If the
brain study does not reveal obvious causes the next step is spinal
MRI. If all MRI studies are non-conclusive a myelogram and
post-myelogram CT may be done to identify causes of CSF
leak in spinal axis. Occasionally cerebral and spinal angiography
may be used as the last resort in attempting to find out the reason
for SS.
SS refers to deposition of chronic blood products, particularly
hemosiderin, in the pia and subpial regions of the brain and
spinal cord. Repeat bouts of hemorrhage are needed for SS to
occur. Chronic exposure of brain cells (particularly microglia
and oligodendrocytes) to hemosiderin leads to their production
of ferritin, which worsens the process. The cells that are more
prone to produce ferritin are found in the cerebellum (Bergman
glia), explaining why SS occurs there with a higher frequency
and severity. The causes of SS are multiple and may include
repeated hemorrhages from amyloidosis, cavernomas, tumors
(ependymoma, meningioma, oligodendroglioma, pineocytoma), dural AV fistulae, aneurysms, AVMs, repeated trauma
(boxing, use of jackhammer), dural tears, post-operative (posthemispherectomy, chronic suboccipital subdural hematoma),
encephalocele, intracranial hypotension, anticoagulation, and
nerve root avulsions. The end result is neuronal loss, gliosis
and demyelination. Schwann cells are particularly prone to
damage, which explains frequent sensorineural hearing loss in
these patients. There is no specific treatment of SS and the
use of chelating drugs is unclear with reports of deferiprone, a
lipid-soluble iron chelator, leading to improvement of symptoms. Treatment should be guided towards the underlying
disease (if identified) that resulted in SS. Because the cochlea
is spared, implantation may improve hearing loss in some
individuals.
Pertinent Clinical Information
Classically, SS presents in adults with progressive gait ataxia and
other cerebellar abnormalities as well as sensorineural hearing
loss and other cranial nerve deficits. Pyramidal signs and loss of
bladder control are observed in a small number of patients and at
the end of the disease, dementia will develop in about 25% of
patients. SS should be excluded in all patients with signs of
cerebellar degeneration. CSF analysis may reveal xanthochromia,
high iron concentrations, red blood cells and increased proteins.
The peripheral nervous system is not affected but involvement of
spinal nerve roots may give rise to conflicting clinical symptoms.
Differential Diagnosis
Leptomeningeal Seeding with Inflammatory, Infectious
and Neoplastic Processes (118, 119, 120, 135)
• prominent contrast enhancement
• T2 hypointensity is rare
• possible nodularity
references
1. Kumar N. Neuroimaging in superficial siderosis: an in-depth look.
AJNR 2010;31:5–14.
2. Linn J, Herms J, Dichgans M, et al. Subarachnoid hemosiderosis and
superficial cortical hemosiderosis in cerebral amyloid angiopathy. AJNR
2008;29:184–6.
3. Hsu WC, Loevner LA, Forman MS, Thaler ER. Superficial siderosis of
the CNS associated with multiple cavernous malformations. AJNR
1999;20:1245–8.
4. Kakeda S, Korogi Y, Ohnari N, et al. Superficial siderosis associated
with a chronic subdural hematoma: T2-weighted MR imaging at 3T.
Acad Radiol 2010;17:871–6.
5. Levy M, Llinas RH. Pilot safety trial of deferiprone in 10 subjects with
superficial siderosis. Stroke 2012;43:120–4.
211
Brain Imaging with MRI and CT, ed. Zoran Rumboldt et al. Published by Cambridge University Press. © Cambridge University Press 2012.
SECTION 4A
Abnormalities Without Significant Mass Effect: Primarily Non-Enhancing
A
B
Figure 1. Sagittal (A) and reconstructed axial (B) T1WIs from a 3D acquisition in a
Figure 2. Coronal IR T1WI shows irregular
3-year-old patient with intractable seizures show a focal area of irregular cortical thickening thickened cortex (arrow) along a deep left
along the right posterior perisylvian region (arrows).
sylvian fissure. There is an adjacent anomalous
enlarged vein (arrowhead).
A
B
C
Figure 3. Axial IR T1WI (A) demonstrates thickened and irregular cortex of the left frontal and parietal lobes with absent or
rudimentary cortical sulci (arrows). Note adjacent large venous structure (arrowhead). A more cephalad image (B) shows corrugated
appearance of the affected cortex (arrowheads) and reduced sulci. Coronal IR T1WI (C) demonstrates indentation of the brain (arrowhead)
in the region of abnormal cortex.
Figure 4. Non-enhanced axial CT image (A) in a
4-month-old child with infantile spasms reveals
diffuse abnormal thickening of the cortical ribbon
(arrowheads), reduced sulcation, and indistinct
gray-white matter junction. Corresponding T2WI
(B) shows diffuse bilateral thickening of the cortex
with the appearance of cortical palisades.
A
212
B
CASE
103
Polymicrogyria
MARIA VITTORIA SPAMPINATO
Specific Imaging Findings
Focal Cortical Dysplasia (FCD) (106)
Polymicrogyria is characterized by an irregular cortical surface,
apparent thickening of the cortex, “stippled” gray–white matter
junction, and a greater than expected number of abnormally
small gyri, usually without T2 signal abnormality in the myelinated brain. High-resolution images reveal that the cortical ribbon
itself is thin, and the apparent thickening results from juxtaposition of the small folds. The perisylvian cortex is the site most
commonly affected by polymicrogyria; however, any region of the
cortical mantle can be involved. Cortical involvement can be
restricted to a single focus or it can affect extended areas, as seen
in cases of uni- or bilateral, symmetrical or asymmetrical, diffuse
polymicrogyria. The imaging appearances of polymicrogyric
cortex can be heterogeneous, ranging from multiple abnormal
small gyri to a relatively smooth cortical surface and an overall
coarse appearance. Diffuse coarse polymicrogyria can have the
appearance of cortical palisades. The sulcation pattern is aberrant, without a recognizable pattern. Sulci may be shallow or
deeply indent the parenchyma. Polymicrogyria may be associated
with schizencephaly, corpus callosum dysgenesis, cerebellar hypoplasia, periventricular and subcortical heterotopias. An imaging
protocol including volumetric T1-weighted images with thin
sections (< 1.5 mm) and reconstruction in the three orthogonal
planes is optimal for evaluation of these abnormalities.
• focal small lesion, frequently at the bottom of a sulcus
• high T2 signal of the cortex and/or underlying white matter is
commonly present
• blurring of the gray–white matter junction in Type I
• tapered linear extension of T2 hyperintensity towards the ventricle (transmantle sign) may be present in Type II
Pertinent Clinical Information
Clinical manifestations and the age of presentation vary
depending on the location of the malformation, the extent of
cortical involvement (focal, multifocal, diffuse, unilateral, or
bilateral), and the presence or absence of associated anomalies.
Patients affected by unilateral or bilateral diffuse polymicrogyria
present with moderate or severe intellectual impairment, mixed
seizure types, and motor dysfunction. Individual clinical features
include hemiparesis or tetraparesis, speech disturbance, dyslexia,
and developmental delay. Neurological and development abnormalities can precede the onset of seizures. Coexistent anomalies
include dysmorphic facial features, hand, foot, skin, palate, and
cardiac abnormalities.
Differential Diagnosis
Classic Lissencephaly (19)
• abnormally thickened cortex (10–15 mm)
• smooth brain surface with areas of agyria and pachygyria
• shallow sylvian fissures
Cobblestone Complex (92)
• mixed cortical malformation with areas of polymicrogyria,
agyria and pachygyria
• hydrocephalus, hypoplastic brain stem and cerebellum, dysplastic corpus callosum
• with congenital muscular dystrophies
Dysembryoplastic Neuroepithelial Tumor (DNET) (108)
• multicystic “bubbly” lesion
• typically sharply demarcated and wedge-shaped extending
toward the ventricle
Low-Grade Glioma (Oligodendroglioma) (161)
• gray and white matter involvement
• presence of mass effect
• T2 hyperintensity
Background
Polymicrogyria is one of the most common malformations of
cortical development. It is caused by disturbance of the late
neuronal migration or early cortical organization. The deep
neuronal layers do not develop normally, leading to overfolding
and abnormal lamination of the cortex. As a result, the polymicrogyric cortex is either four-layered or unlayered. The development of these irregular undulations occurs as early as 18
gestational weeks, before the first primary sulci form at midgestation. Because it is a primary cortical disorder, both connectivity and gyration/sulcation of these regions are very abnormal.
In addition, the overlying meninges are thickened and may demonstrate vascular proliferation of unclear etiology. Causes of
polymicrogyria include congenital infection (especially cytomegalovirus infection), mutations of one or multiple genes, and
in-utero ischemia. It can also occur with several chromosomal
deletion and duplication syndromes (Aicardi, DiGeorge, and
Delleman syndromes, among others).
references
1. Barkovich AJ. Current concepts of polymicrogyria. Neuroradiology
2010;52:479–87.
2. Leventer RJ, Jansen A, Pilz DT, et al. Clinical and imaging
heterogeneity of polymicrogyria: a study of 328 patients. Brain
2010;133:1415–27.
3. Chang B, Walsh CA, Apse K, Bodell A. Polymicrogyria overview. In:
Pagon RA, Bird TD, Dolan CR, Stephens K, eds. GeneReviews [Internet].
Seattle (WA): University of Washington, Seattle; 1993–2005 Apr 18
[updated 2007 Aug 06].
4. Raybaud C, Widjaja E. Development and dysgenesis of the cerebral
cortex: malformations of cortical development. Neuroimaging Clin N Am
2011;21:483–543.
5. Hehr U, Schuierer G. Genetic assessment of cortical malformations.
Neuropediatrics 2011;42:43–50.
213
Brain Imaging with MRI and CT, ed. Zoran Rumboldt et al. Published by Cambridge University Press. © Cambridge University Press 2012.
SECTION 4A
Abnormalities Without Significant Mass Effect: Primarily Non-Enhancing
Figure 1. Coronal
FLAIR image (A) shows
swollen and bright
left amygdala (arrow).
Axial DWI (B) shows
corresponding high
signal intensity (arrow).
A
B
Figure 2. Coronal
T2WI (A) in another
patient after seizures
shows a bright and
somewhat expanded
left hippocampus
(arrow).
Figure 3. ADC map shows a focal low signal
(arrow) in the splenium of corpus callosum.
A
B
C
Figure 4. Axial T2WI (A) at the convexities shows high signal in the left posterior frontal lobe (arrow) involving gray and white matter, which
corresponded to the epileptogenic focus on EEG. Matching FLAIR image (B) confirms findings and shows that the cortex is slightly swollen.
Follow-up FLAIR image 2 months later (C) shows complete resolution of abnormalities.
214
CASE
104
Seizure-Related Changes (Peri-Ictal MRI
Abnormalities)
MAURICIO CASTILLO
Specific Imaging Findings
The cortex involved is expanded and bright on T2 and FLAIR
sequences. DWI shows high signal and on ADC maps values may
be normal to slightly low. Mesial temporal lobes are typically
affected but other parts of the brain may also be involved. Contrast enhancement is rare but has been described. Findings generally disappear from 2 weeks to 2 months after the ictus and the
affected regions return to normal or become atrophic. MR spectroscopy may show normal choline, low n-acetyl aspartate (NAA)
and lactate. Lactate tends to disappear within the first few days
after the ictus. PET studies show increased fluoro-deoxyglucose
uptake in corresponding sites. The abnormality may be localized
in the splenium of the corpus callosum, also showing reduced
diffusion. Occasionally the white matter can be diffusely affected,
with T2 hyperintensity and reduced diffusion in a pattern similar
to diffuse anoxia. In these patients, MR spectroscopy may show
high glutamine and glutamate and low NAA. Patients with persistent low NAA after the first week have worse prognosis. This
syndrome is called acute encephalopathy with biphasic seizures
and late reduced diffusion (AESD).
Pertinent Clinical Information
Most patients have prolonged seizures which may be partial or
generalized. The imaging findings are seen in the first 3 days that
follow the seizure episode and thereafter tend to slowly normalize. Patients tend to be children, but these MRI findings may be
seen at any age. These imaging abnormalities tend to correspond
with sites of electroencephalographic ictal activity and increased
radionuclide uptake on PET studies. Patients with AESD have a
typical clinical course: a prolonged (> 30 min duration) usually
febrile seizure followed by secondary seizures (generally clusters
of partial complex ones) a few days later and encephalopathy.
Infection and associated pathologic changes are considered
responsible for AESD.
Differential Diagnosis
Herpes Encephalitis (20)
• no previous seizures, acute onset
• fever or viral-like illness, positive CSF
Gliomas (165, 166)
• may enhance and contain calcifications
• may be indistinguishable with follow-up needed, tumors that
produce seizures may also induce cortical edema
• MR spectroscopy shows high choline levels
Focal Cortical Dysplasia (106)
• MR spectroscopy and ADC values are normal
• does not change over time
Global Anoxia (13)
• clinical history is typically suggestive of anoxic injury
Background
Seizure-induced abnormalities, also known as (transient)
peri-ictal MRI abnormalities, tend to affect the cortex acutely,
particularly the hippocampi. The hippocampi may be affected by
the seizures directly or as a result of seizure activity elsewhere or
high fever. The abnormalities are due to vasogenic, cytotoxic, or
excitotoxic edema or a combination of any of these three processes. These underlying mechanisms probably include increased
blood flow due to increased activity. This increased blood flow is
unable to compensate the high regional metabolism and the end
result is hypoxia, hypercarbia, lactic acidosis and vasodilation.
Increased permeability may also play a role. Similar findings have
been produced in experimental models of kainic acid-induced
partial status epilepticus. As the condition progresses, the
sodium–potassium pump fails and there is secondary intracellular accumulation of calcium which may induce cell death.
references
1. Kim J-A, Chung JI, Yoon PH, et al. Transient MR signal changes in
patients with generalized tonicoclonic seizure or status epilepticus:
periictal diffusion-weighted imaging. AJNR 2001;22:1149–60.
2. Cox JE, Mathews VP, Santos CC, Elster AD. Seizure-induced transient
hippocampal abnormalities on MR: correlation with positron emission
tomography and electroencephalography. AJNR 1995;16:1736–8.
3. Castillo M, Smith JK, Kwock L. Proton MR spectroscopy in patients
with acute temporal lobe seizures. AJNR 2001;22:152–7.
4. Takanashi J, Tada H, Terada H, Barkovich AJ. Excitotoxicity in acute
encephalopathy with biphasic seizures and late reduced diffusion.
AJNR 2009;30:132–5.
5. Gu¨rtler S, Ebner A, Tuxhorn I, et al. Transient lesion in the splenium
of the corpus callosum and antiepileptic drug withdrawal. Neurology
2005;65:1032–6.
215
Brain Imaging with MRI and CT, ed. Zoran Rumboldt et al. Published by Cambridge University Press. © Cambridge University Press 2012.
SECTION 4A
Abnormalities Without Significant Mass Effect: Primarily Non-Enhancing
A
B
C
Figure 1. Axial DWI (A) and FLAIR image (B) through the level of the centrum semiovale show multiple small foci of cortical and subcortical
hyperintensity (arrowheads) in the frontal and parietal lobes. Axial image from a neck CTA (C) demonstrates a filling defect (arrow) in the right
common carotid artery consistent with a nonocclusive thrombus.
Figure 2. Axial CT image (A) in a patient with atrial
fibrillation shows hypodense infarcts in the left occipital
lobe (black arrow), thalamus (white arrow), and anterior
limb of the internal capsule (arrowheads). DWI (B)
at a higher level reveals many additional lesions
(arrowheads) in bilateral cerebral hemispheres. Note
involvement of multiple vascular territories and varying
size of the lesions.
A
B
Figure 3. Axial DWIs (A) in another patient shows
multiple bilateral small bright areas. Corresponding
ADC map (B) demonstrates low signal (arrowheads)
of the lesions, consistent with reduced diffusion and
representing acute infarcts. Again note involvement
of multiple vascular territories and varying size of
the lesions.
A
216
B
CASE
105
Embolic Infarcts
BENJAMIN HUANG
Specific Imaging Findings
Embolic infarcts may be isolated or multiple and vary in size
depending on the size of the dislodged thrombus. Small acute
embolic infarcts are extremely difficult to detect prospectively on
CT or conventional MR sequences, particularly in patients with
pre-existing chronic ischemic lesions. The infarcts are hypodense
on CT and T2 hyperintense, with little or no mass effect when
small. Diffusion MRI is the most sensitive technique for early
detection of infarcts, which are bright on trace DWI and dark on
ADC maps, consistent with reduced diffusion. The infarcts are
typically located peripherally in the cortex or subcortical white
matter of the cerebral hemispheres, but involvement of deep
structures such as the basal ganglia and centrum semiovale is
not uncommon, as well as location along “watershed” areas
between vascular territories. Most embolic infarcts occur in the
middle cerebral artery territory due to preferential blood flow
through the MCA. The presence of multiple infarctions involving
more than one major arterial territory is highly suggestive of
embolic etiology. Bilaterality and/or involvement of anterior
and posterior circulations suggests a cardiac or aortic source,
while multiple infarcts of differing ages suggest ongoing embolization. Like with other infarcts, enhancement may occur in the
subacute period.
Pertinent Clinical Information
Signs and symptoms of embolic infarcts vary depending upon
the size, number, and location, and can also be asymptomatic.
Patients may present with a history of repeated transient ischemic
attacks (TIAs) and 21–67% of patients presenting with TIA have
focal signal abnormalities on DWI imaging in the acute setting;
additional ischemic events occur in around 15% of these cases.
Further evaluation of the heart and extracranial vessels is mandatory, as an underlying cardiac or vascular abnormality will be
detected in roughly 78% of these patients. Approximately onequarter of patients presenting with classical “lacunar stroke”
syndromes (dysarthria–clumsy hand syndrome, pure motor
stroke, pure sensory stroke, etc.) and normal CT scan show
embolic stroke patterns with multiple lesions on DWI, indicating
that the diagnosis of lacunar infarcts with clinical and CT findings is inaccurate.
Differential Diagnosis
Hemodynamic (Hypoperfusion) Infarctions
• infarcts are located in the watershed regions between vascular
territories
• may be indistinguishable from embolic infarcts
CNS Vasculitis (123)
• can involve gray matter, subcortical white matter or deep white
matter
• MRA frequently shows multifocal stenoses in large and
medium vessel vasculitis
• scattered areas of pial enhancement may be found
• may present with subarachnoid hemorrhage
Small Vessel (Lacunar) Infarct
• a single lesion usually located in deep gray matter, internal
capsule, pons, or corona radiata
• may be indistinguishable from an isolated embolic infaction
Septic Emboli
• often subcortical in location
• (rim) enhancement is commonly present early on (acute phase)
Fat Emboli
• usually history of a long bone fracture; petechial rash and
respiratory distress present
• “starfield pattern” of innumerable punctate lesions predominantly in the “watershed” distribution
Background
Most ischemic cerebral infarcts are due to local thrombosis or
thromboembolism, while a small minority has hemodynamic
etiology. Thrombotic infarction occurs when thrombosis of an
atherosclerotic or otherwise diseased vessel causes luminal occlusion, while embolic infarcts are caused by thrombus dislodgement and distal migration from an upstream location, the most
common being carotid bifurcation and the heart. In patients with
TIAs, early diffusion MRI abnormalities may be reversible and
only evident during the first two days. This is presumably due to
autolysis of clot and vessel recanalization. Diffusion MRI has also
been used for the detection of frequently clinically silent embolic
events associated with vascular and cardiac surgery as well as with
diagnostic and interventional endovascular procedures.
references
1. Kunst MM, Schaefer PW. Ischemic stroke. Radiol Clin North Am
2011;49:1–26.
2. Wessels T, Rottger C, Jauss M, et al. Identification of embolic stroke
patterns by diffusion-weighted MRI in clinically defined lacunar
stroke syndromes. Stroke 2005;36:757–61.
3. Moustafa RR, Izquierdo-Garcia D, Jones PS, et al. Watershed infarcts
in transient ischemic attack/minor stroke with > or = 50% carotid
stenosis: hemodynamic or embolic? Stroke 2010;41:1410–6.
4. Purroy F, Montaner J, Rovira A, et al. Higher risk of further vascular
events among transient ischemic attack patients with diffusion-weighted
imaging acute ischemic lesions. Stroke 2004;35:2313–9.
5. Ryu CW, Lee DH, Kim TK, et al. Cerebral fat embolism:
diffusion-weighted magnetic resonance imaging findings. Acta Radiol
2005;46:528–33.
217
Brain Imaging with MRI and CT, ed. Zoran Rumboldt et al. Published by Cambridge University Press. © Cambridge University Press 2012.
SECTION 4A
A
Abnormalities Without Significant Mass Effect: Primarily Non-Enhancing
B
C
Figure 1. Axial T2WI (A) in a 4-year-old patient with intractable seizures shows a subtle left frontal subcortical hyperintensity (arrow).
Coronal FLAIR image (B) also shows the subcortical hyperintensity (arrow). Coronal IR T1WI (C) reveals a slightly larger area of the
subcortical decreased signal with blurring of the gray matter–white matter junction (arrow).
Figure 2. Axial T2WI (A) in a 35-year-old
patient with epilepsy shows a slightly
thickened gyrus with hyperintense cortex
(arrow). There is a funnel-shaped extension
of the abnormal high signal (arrowhead)
from the cortex to the ventricular surface.
Corresponding FLAIR image (B) better depicts
the swollen hyperintense gyrus (arrow) and
radial extension of the abnormal signal
(arrowhead).
A
A
B
B
Figure 3. Coronal FLAIR image (A) reveals a subtle hyperintense cortical thickening
(arrow) as well as extension of the abnormal signal (arrowhead) toward the ventricle.
A more posterior FLAIR image (B) shows an additional similar lesion (arrowhead).
218
Figure 4. Axial FLAIR shows abnormal left
hemisphere with prominent occipital
hyperintensity (arrows).
CASE
106
Focal Cortical Dysplasia
ZO R A N R U M B O L D T A N D M A R I A G I S E L E M A T H E U S
Specific Imaging Findings
Focal cortical dysplasia (FCD) Type I shows only localized blurring
of the gray–white matter junction and sometimes decreased
volume of the subcortical white matter and cortex that may be
detected with dedicated high spatial resolution heavily T1weighted inversion recovery spin echo and 3D gradient echo
images. The lesions are preferentially located at the bottom of an
abnormally deep sulcus. The subcortical white matter may show
hyperintense T2 signal, best depicted on high-resolution FLAIR
images. These findings can be very subtle, typically not seen on CT
and routine MRI scans, and in a significant number of cases not
even on dedicated MR imaging. Functional studies (PET, SPECT
and MEG) may be able to localize the seizure focus and tailored
MRI of the suspicious area with a surface coil may then depict
the lesion. Co-registration of PET and MR images substantially
increases sensitivity. FCD Type II shows localized cortical
thickening and T2 hyperintensity, which can characteristically
extend in a tapered linear fashion towards the ventricle, known
as the transmantle sign. Gray–white matter junction blurring and
subtle white matter T1 hyointensity may be present. The gyral
pattern may be abnormal with broad gyri and irregular sulci.
A lesion detected on imaging is not necessarily the seizure focus,
and FCD may occur in a multifocal and multilobar distribution.
Pertinent Clinical Information
FCD is the most common cause of epilepsy in children, and one
of the more common etiologies of seizure disorders in adults.
Seizures may start very early in infancy, and usually present
within the first decade of life. Treatment aims at seizure control,
and because the epilepsy is frequently refractory to medications,
detection of the seizure focus is followed by surgical resection.
Surgery is curative in a majority of patients, provided that the
responsible cortical lesion is entirely removed.
Differential Diagnosis
Low Grade Glioma (161, 162)
• presence of mass effect
• absence of linear extension to the ventricular surface
• more common in temporal lobes
Dysembryoplastic Neuroepithelial Tumor (DNET) (108)
• multicystic “bubbly” lesion
• typically sharply demarcated and wedge-shaped
Ganglioglioma (166)
• mass is typically at least partly cystic
• contrast enhancement is usually present
• frequently contains calcifications
• rarely poorly delineated, solid and non-enhancing, but still
with mass effect
• predilection for temporal lobe
Tuberous Sclerosis Complex (TSC) (107)
• cortical tubers are usually multiple
• presence of subependymal nodules, which calcify and may
enhance with contrast
• solitary tuber is indistinguishable from FCD type II (on both
histology and imaging)
• associated additional clinical and extracranial imaging findings
Background
With the improvement and increased utilization of modern
imaging techniques, FCD has been increasingly recognized as a
major cause of epilepsy. A recent consensus classification system
by the International League against Epilepsy, based on the correlation of imaging data, electroclinical features and post-surgical seizure control with neuropathological findings, includes
three subtypes: FCD Type I characterized by aberrant radial
(Ia) or tangential (Ib) lamination of the neocortex affecting
one or multiple lobes; FCD Type II characterized by cortical
dyslamination and dysmorphic neurons without (IIa) or with
balloon cells (IIb); FCD Type III occurs in combination with
hippocampal sclerosis (IIIa), with neoplasms (IIIb), adjacent to
vascular malformations (IIIc), and with other lesions (trauma,
ischemia or encephalitis) obtained in early life (IIId). Histopathological features of FCD Type III are otherwise very similar
to those in Type I. Small FCD not detected with MRI is often
located in the depth of the frontal sulci.
references
1. Colombo N, Salamon N, Raybaud C, et al. Imaging of malformations
of cortical development. Epileptic Disord 2009;11:194–205.
2. Hofman PA, Fitt GJ, Harvey AS, et al. Bottom-of-sulcus dysplasia:
imaging features. AJR 2011;196:881–5.
3. Abdel Razek AA, Kandell AY, Elsorogy LG, et al. Disorders of cortical
formation: MR imaging features. AJNR 2009;30:4–11.
4. Blu¨mcke I, Mu¨hlebner A. Neuropathological work-up of focal cortical
dysplasias using the new ILAE consensus classification system – practical
guideline article invited by the Euro-CNS Research Committee. Clin
Neuropathol 2011;30:164–77.
5. Wagner J, Urbach H, Niehusmann P, et al. Focal cortical dysplasia type
IIb: completeness of cortical, not subcortical, resection is necessary for
seizure freedom. Epilepsia 2011;52:1418–24.
219
Brain Imaging with MRI and CT, ed. Zoran Rumboldt et al. Published by Cambridge University Press. © Cambridge University Press 2012.
SECTION 4A
A
Abnormalities Without Significant Mass Effect: Primarily Non-Enhancing
B
C
Figure 1. Coronal IR T1WI (A) shows bilateral cortico-subcortical areas of very low signal (arrows) and brighter nodules (arrowheads)
protruding into the ventricles. Axial FLAIR image (B) shows multiple patchy cortico-subcortical hyperintensities (arrows). Subependymal
nodules (arrowheads) are not well seen. The nodules (arrowheads) are enhancing on the matching post-contrast T1WI (C). Only one
of the cortico-subcortical lesions enhances (arrow).
Figure 2. Axial FLAIR image (A) in a patient
with epilepsy shows scattered superficial
lesions with patchy hyperintense signal
(arrows). Corresponding T2*WI (B) reveals
a focus of very low signal (arrow) in one
cortical lesion. A number of dark nodules
(arrowheads) along the lateral ventricles are
much better seen than on FLAIR, however the
superficial lesions are not easily discernible.
A
A
B
C
D
B
Figure 3. Non-enhanced axial CT image (A) shows subtle cortico-subcortical hypodensities (arrowheads), one of which contains
a peripheral calcification (arrow). Calcified subependymal nodules (arrow) are seen at a lower level (B). FLAIR (C) and ADC map
(D) show patchy hyperintensity of the cortical tubers (arrows).
220
CASE
107
Tuberous Sclerosis Complex
MA R I A G I S E L E M A T H E U S
Specific Imaging Findings
Subependymal Nodular Heterotopia (117)
Tuberous sclerosis complex (TSC) abnormalities of the CNS are
cortical tubers, subependymal nodules, and subependymal giant
cell astrocytomas (SEGA or SGCA). Cortical tubers are typically
randomly scattered focal cortical and subcortical lesions of high
T2 signal that are iso- to hypointense on T1-weighted images and
primarily affecting supratentorial parenchyma, but may also be
found in the cerebellum. They are best depicted on FLAIR images.
The tubers generally show bright signal of increased diffusivity on
ADC maps and decreased cerebral blood volume on perfusion
studies. Calcifications may be present and some enhance with
contrast. The white matter may show radial bands of hyperintense
T2 signal and cystic degeneration (usually in the deep white matter).
Subependymal nodules are multiple bilateral small (< 12 mm)
sharply demarcated masses indenting the contours of the lateral
ventricles. They show very low T2 signal, are frequently T1 hyperintense and enhance with gadolinium. A vast majority of subependymal nodules calcify and are hence well seen on CT and T2* MR
images, as very bright and very dark nodules, respectively. SEGA are
typically located at the subependymal surface of the caudate nucleus
near the foramen of Monro. They are slow-growing > 12 mm
minimally invasive masses with well-defined margins and avid
homogeneous enhancement. Internal calcification and cysts are
often present. The adjacent parenchyma is typically preserved unless
anaplastic degeneration occurs. Hemimegalencephaly is also found
more frequently in patients with TSC.
• isointense signal to gray matter
• absence of calcifications
• no contrast enhancement
Pertinent Clinical Information
Epilepsy is the most prevalent clinical symptom, usually with
increasing severity and frequency of seizures and poor response
to medical therapy. Surgical excision of the established epileptogenic tubers is the treatment of choice. SEGA-related hydrocephalus is another important clinical concern. Patient is
classified as “Definite TSC” when two major features or one
major feature plus two minor features are present. “Probable
TSC” and “Possible TSC” are also part of the diagnostic classification. Cortical tuber, subependymal nodule and SGCA are three
distinct major features.
Differential Diagnosis
Focal Cortical Dysplasia Type IIb (Taylor’s, Balloon Cell
Type) (106)
• a single focus of cortical dysplasia with associated radial white
matter abnormality
• no subependymal nodules
• FCD and TS are indistinguishable histologically
Congenital CMV Infection (184)
• periventricular calcification with multiple other brain abnormalities (polymicrogyria, white matter lesions)
Background
TSC is the second most common neurocutaneous syndrome,
autosomal dominant with a de-novo mutation rate of up to
70%, characterized by the formation of hamartomatous lesions
in multiple organs. The genes responsible for the disorder are
tumor suppressor genes TSC1 (9q34), which encodes the protein
hamarti, and TSC2 (16p13), which encodes the protein tuberin.
These proteins have a role in regulation of cell growth and
differentiation. The disease has complete penetrance but with a
high phenotypic variability: some patients have obvious signs at
birth, while others remain undiagnosed for many years. SGCA are
primary brain tumors formed by astrocytes and giant cells that
occur in TSC with a prevalence of 1.7–26%. Only a single cortical
tuber may be present in some patients, which is indistinguishable
from Type IIb focal cortical dysplasia (FCD), so TSC should be
considered when FCD is associated with seizure onset in infancy,
family history of seizures, and peridysplastic calcification.
Around 20% of TSC patients do not have either TSC1 or TSC2
mutations. Diffusion tensor imaging unveils the microstructural
abnormalities of the normal-appearing white matter, while FDGPET is very helpful in determining the seizure foci.
references
1. Griffiths PD, Hoggard N. Distribution and conspicuity of intracranial
abnormalities on MR imaging in adults with tuberous sclerosis complex:
a comparison of sequences including ultrafast T2-weighted images.
Epilepsia 2009;50:2605–10.
2. Hirfanoglu T, Gupta A. Tuberous sclerosis complex with a single brain
lesion on MRI mimicking focal cortical dysplasia. Pediatr Neurol
2010;42:343–7.
3. Garaci FG, Floris R, Bozzao A, et al. Increased brain apparent
diffusion coefficient in tuberous sclerosis. Radiology 2004;232:461–5.
4. Widjaja E, Wilkinson ID, Griffiths PD. Magnetic resonance perfusion
imaging in malformations of cortical development. Acta Radiol
2007;48:907–17.
5. Baskin HJ. The pathogenesis and imaging of tuberous sclerosis
complex. Pediatr Radiol 2008;38:936–52.
221
Brain Imaging with MRI and CT, ed. Zoran Rumboldt et al. Published by Cambridge University Press. © Cambridge University Press 2012.
SECTION 4A
A
Abnormalities Without Significant Mass Effect: Primarily Non-Enhancing
B
C
D
Figure 1. Axial CT (A) in a child with seizures shows a cortico-subcortical hypodensity (arrow) without mass effect and with subtle
internal heterogeneity. Sagittal T2WI through the lesion (B) shows its bright cyst-like appearance with internal septations (arrow).
Corresponding FLAIR image (C) reveals bright internal septa and lesion periphery producing a multicystic “bubbly” appearance.
The cyst-like structures are hypointense and there is no enhancement on post-contrast T1WI (D).
Figure 2. A right parietal wedge-shaped hyperintensity (arrow) is detected on sagittal FLAIR image. The lesion shows enlarged
but preserved gyrus-like configuration of the cortex (white arrowheads) with a subcortical pseudocyst (black arrowhead).
A
B
C
Figure 3. Coronal T2WI (A) in a 9-year-old girl shows a mass (arrow) in the right supramarginal gyrus with a multilobular, multicystic
structure. There is no perifocal edema. On axial FLAIR image (B), the typical peripheral hyperintense rim (arrowheads) surrounding a
hypointense core is present. Corresponding ADC map (C) shows the lesion to be very bright (arrow), reflecting a high degree of diffusivity.
222
CASE
108
Dysembryoplastic Neuroepithelial Tumor
(DNT, DNET)
GIOVANNI MORANA
Specific Imaging Findings
On CT, dysembryoplastic neuroepithelial tumor (DNT or DNET)
appears as a low density cortico-subcortical supratentorial area.
Calcifications are rare. Remodeling of the adjacent calvarium is
frequent with superficially located tumors. On MRI, the classic
appearance is of a well-demarcated pseudocystic lesion, strongly
T2 hyperintense and T1 hypointense with variable signal on FLAIR
images. Mass effect is minimal to absent, there is no surrounding
vasogenic edema. DNTs may have a triangular-shaped pattern with
the base along the cortical surface with preserved gyral pattern.
Thin hyperintense signal on FLAIR images is visible both along
the surface (bright rim) and as stripes along thin internal septa,
resulting in a very characteristic multicystic, “bubbly” appearance.
Additional small cysts, separated from the main mass, are often
located in the neighboring cortex or subcortical white matter. Some
lesions may show a more heterogeneous signal consistent with solid,
cystic, or semiliquid structures. Solid components may either be
solitary or form a multinodular pattern interspersed within a cystic
frame. Contrast enhancement is rare, variable, and more often ringlike. Bleeding is also rare. Tumors show increased diffusivity with
high ADC values and low rCBV on perfusion imaging. The MRS
pattern is nonspecific with increase in mI/Cr and Cho/NAA ratios.
Lactate and lipid peaks are usually absent.
Pertinent Clinical Information
DNTs are usually diagnosed in patients under the age of 20 with a
history of seizures that do not respond well to medication. The
natural history of the lesion is characterized by very slow increase
in size over time. The prognosis after complete surgical excision is
favorable, and seizure control dramatically improves; nevertheless, recurrence after surgical removal and/or malignant transformation have been reported.
Differential Diagnosis
Ganglioglioma (166)
• more mass effect and enhancement, edema may be present
• usually a single or a few “cysts”, “bubbly” appearance rare
• calcifications are common
Angiocentric Glioma
• cortical rim of hyperintensity on T1-weighted images
• stalk-like extension to the adjacent ventricle on T2-weighted
images
Focal Cortical Dysplasia (106)
• focal cortical thickening with loss of gray–white matter
demarcation
• funnel-shaped high T2 signal in the subcortical white matter
• no contrast enhancement
• isolated tuber (calcifications extremely common)
Giant Perivascular Spaces; Neuroepithelial
Cyst (168, 169)
• non-enhancing CSF-like cyst with minimal to no surrounding
signal abnormality
Background
DNTs are classified as neuronal and mixed neuronal–glial tumors.
The adjacent cortex usually shows a disordered architecture, with
the tumor originating on a background of cortical dysplasia. They
are preferentially located, in decreasing order, in the temporal,
frontal, parietal, and occipital lobes; less common locations are
extracortical areas such as the caudate nucleus, lateral ventricle,
septum pellucidum, and fornix. Two main histological forms
have been described – simple and complex variants. The simple
form is characterized by a unique specific glioneuronal element,
corresponding to pseudocysts on MRI. This glioneuronal unit
is composed by oligodendrocyte-like tumor cells and floating
neurons within a myxoid tumor matrix. The complex form is
characterized by a more heterogeneous architecture composed of
multiple glial nodules resembling astrocytomas, oligodendrogliomas, or oligoastrocytomas, in addition to the distinctive glioneuronal element. Neuropathological distinction of simple and
complex DNT variants is not fully reflected on MRI, but calcifications, hemorrhage, and contrast enhancement occur only in
complex variants.
references
1. Ostertun B, Wolf HK, Campos MG, et al. Dysembryoplastic
neuroepithelial tumors: MR and CT evaluation. AJNR
1996;17:419–30.
2. Campos AR, Clusmann H, von Lehe M, et al. Simple and complex
dysembryoplastic neuroepithelial tumor (DNT) variants: clinical profile,
MRI, and histopathology. Neuroradiology 2009;51:433–43.
3. Daumas-Duport C. Dysembryoplastic neuroepithelial tumors.
Brain Pathol 1993;3:255–68.
4. Bulakbasi N, Kocaoglu M, Sanal TH, Tayfun C. Dysembryoplastic
neuroepithelial tumors: proton MR spectroscopy, diffusion and
perfusion characteristics. Neuroradiology 2007;49:805–12.
5. Ray WZ, Blackburn SL, Casavilca-Zambrano S, et al.
Clinicopathologic features of recurrent dysembryoplastic neuroepithelial
tumor and rare malignant transformation: a report of 5 cases and review
of the literature. J Neurooncol 2009;94:283–92.
223
Brain Imaging with MRI and CT, ed. Zoran Rumboldt et al. Published by Cambridge University Press. © Cambridge University Press 2012.