Relationship between concentrations of interleukine 6 and TNF-α in patients with systemic lupus erythematosus before and after treatment
Bạn đang xem bản rút gọn của tài liệu. Xem và tải ngay bản đầy đủ của tài liệu tại đây (305.14 KB, 6 trang )
Journal of military pharmaco-medicine no5-2019
RELATIONSHIP BETWEEN CONCENTRATIONS OF
INTERLEUKINE 6 AND TNF-α IN PATIENTS WITH SYSTEMIC
LUPUS ERYTHEMATOSUS BEFORE AND AFTER TREATMENT
Ke Thi Lan Anh1; Nguyen Van Doan2; Do Minh Trung3
SUMMARY
Objectives: To describe levels of serum IL-6 and TNF-α in patients with systemic lupus
erythematosus before and after treatment of acute crisis. Subjects: 34 acute systemic lupus
erythematosus patients who were treated at the Center for Allergy - Clinical Immunology of
Bachmai Hospital from April 2014 to December 2014 and 31 normal controls. Methods:
A longitudinal study, levels of IL-6 and TNF-α in serum samples from 34 patients with systemic
lupus erythematosus and 31 normal controls were determined by enzyme linked immunosorbent
assay. Results: The average age of study participants was 28 ± 10.61. The ratio of females to
males was 5.8. Before treatment, the concentration of reduced C3 was reported in 94.11% of
patients and the concentration of reduced C4 was present in 79.41% of patients, the C3
concentrations were reduced in 55.88% of patients after treatment and the C4 concentrations
were reduced in 20.58% of patients after treatment. The average SLEDAI score before
treatment was high: 16.56 ± 3.91, which decreased after treatment: 9.24 ± 5.2 (p < 0.05).
79.41% of patients were responsive to treatment and 20.58% were non-responsive. The group
of patients responds to treatment: the average of TNF-α was 47.26 ± 30.32 pg/mL and 18.71 ±
10.71 pg/mL (p < 0.05) before and after treatment, respectively. IL-6 concentration before
treatment was 13.78 ± 19.66 pg/mL; after treatment was 0.76 ± 2.21 pg/mL (p < 0.05), there was no
difference between IL-6 serum of patients after treatment and control group (1.3 ± 1.83 pg/mL).
The group of patients without response to treatment: the average of IL-6 after treatment was
18.43 ± 40.74 pg/mL. TNF-α was 92.71 ± 132.65 pg/mL, they were similar to pre-treatment
group (IL-6: 4.31 ± 5.41 pg/mL and TNF-α: 39.42 ± 26.19 pg/mL), p > 0.05. Conclusions: Serum
TNF-α and IL-6 are sensitive markers for systemic lupus erythematosus disease activity. They
may be useful independent markers for prediction of systemic lupus erythematosus disease
activity and to differentiate normal subjects from those having systemic lupus erythematosus.
* Keywords: Systemic lupus erythematosus; Cytokine; Interleukin-6; TNF-α.
INTRODUCTION
Systemic lupus erythematosus (SLE)
is a chronic inflammatory autoimmune
disease with a wide range of clinical
presentations which has an effect on
multiple organ systems. Patients with lupus
experience a loss of self-tolerance as
a result of abnormal immunological
function and the production of autoantibodies,
1. Haiphong University of Medicine and Pharmacy
2. Hanoi Medical University
3. Vietnam Military Medical University
Corresponding author: Ke Thi Lan Anh ()
Date received: 25/03/2019
Date accepted: 22/05/2019
186
Journal of military pharmaco-medicine no5-2019
which lead to the formation of immune
complexes that may adversely affect
normal tissue. Although the precise
etiologic mechanism is unknown, genetic,
hormonal, and environmental factors, as
well as immune abnormalities, have been
identified. Associations between lupus
onset and age, sex, geography, and race
have also been established [2, 3].
Cytokines are central factors in both
innate and adaptive immunity. They are
mostly synthesized by immune cells and
in turn participate in the differentiation,
maturation, and activation of diverse immune
and hematopoietic cells. Abnormalities of
various cytokines have been identified in
patients with SLE and in murine lupus
models. There is growing evidence of
the important role of cytokines in SLE
pathogenesis, as well as their utility as
biomarkers and targets in new therapies.
Particularly high levels of interleukine (IL)
6 and TNF-α increased during acute
episodes [2, 3]. Therefore, this study was
carried out with the following objectives:
To describe levels of serum IL-6 and
TNF-α in patients with SLE before and
after treatment of acute crisis.
SUBJECTS AND METHODS
1. Subjects.
Our study included 34 acute SLE
patients who were treated at the Center
for Allergy - Clinical Immunology of Bachmai
Hospital from April 2014 to December
2014 and 31 matched healthy control
individuals.
* Diagnostic criteria for SLE:
Patients in the study were diagnosed
according to American College of
Rheumatology (ACR) in 1997 [3, 4],
including 11 criteria:
- Malar rash.
- Discoid rash.
- Photosensitivity.
- Oral or nasal ulcer.
- Arthritis.
- Serositis.
- Renal: proteinuria > 0.5 g/24 hour;
hematuria, oval fat bodies and fatty casts
in the urine.
- Neurology.
- Hematology: Hemolytic anemia;
leukopenia < 4 G/L; thrombocytopenia
< 100 G/L.
- Immunologic abnormalities: anti-dsDNA (+); anti-phospholipid (+); anti-Sm (+).
- ANA (+).
* Initial evaluation based on SLEDAI
criteria:
The SLEDAI was evaluated as follows:
- Inactive disease: SLEDAI = 0 points.
- Mildly active disease: SLEDAI
≤ 5 points.
- Average active disease: SLEDAI =
6 - 12 points.
- Strongly active disease: SLEDAI
> 12 points.
2. Methods.
* Study design: Longitudinal study.
* Study content:
- Control group: Taking history, taking
previous history, examination: to exclude
acute and chronic diseases. Quantification
of serum TNF-α, IL-6.
187
Journal of military pharmaco-medicine no5-2019
- Patient: Each patient was provided
with a medical record.
+ Test: Quantification of serum TNF-α,
IL-6 as control group.
+ Taking history, taking previous
history, examination: Fever, malar rash,
fatigue, weight loss, joint pain, hair loss,
blood pressure....
+ After 4 weeks: Physical examination
and quantification of serum TNF-α, IL-6.
* Tests: It is done at Bachmai Hospital
and Vietnam Military Medical University.
RESULTS
Table 1: Age, gender of the patients.
Female
Parameters
Male
n
± SD
Overall
n
± SD
n
± SD
Patients
27.03 ± 10.28
29
33.6 ± 11.99
5
28 ± 10.61
34
Control group
35.45 ± 7.54
22
29.89 ± 7.97
9
33.84 ± 7.96
31
Table 2: Change of C3, C4.
Before treament
After treament
Biological index
p
± SD
C3 (mg/dL)
C4 (mg/dL)
n
%
± SD
n
%
Normal
(0.9 - 1.8)
0.99 ± 0.056
2
5.89
1.15 ± 0.26
15
44.12
Reduction
(< 0.9)
0.35 ± 0.13
32
94.11
0.62 ± 0.2
19
55.88
Overall
0.39 ± 0.19 (1)
34
100
0.86 ± 0.36 (2)
34
100
Normal
(0.1-0.4)
0.13 ± 0.036
7
20.59
0.18 ± 0.062
27
79.41
Reduction
(< 0.1)
0.037 ± 0.02
27
79.41
0.06 ± 0.02
7
20.59
Overall
0.05 ± 0.046
(3)
34
100
0.16 ± 0.08
(4)
34
100
p1:2 < 0.05
p3:4 < 0.05
Table 3: Change of SLEDAI.
SLEDAI
score
Before treament
After treament
± SD
n
%
≤5
0
0
0
6 - 12
10.6 ± 2.6
5
> 12
17.59 ± 3.11
Overall
16.56 ± 3.91 (1)
188
n
%
3.38 ± 1.68
8
23.53
14.7
8.67 ± 1.97
18
52.94
29
85.3
16.38 ± 4.13
8
23.53
34
100
9.24 ± 5.2 (2)
34
100
± SD
p
p1:2 < 0.05
Journal of military pharmaco-medicine no5-2019
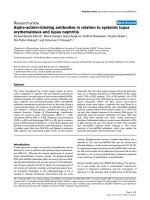
20.58
79.41
Responder
Non Responder
Figure 1: Treatment outcome.
Table 4: Serum level of IL-6 and TNF-α responder subgroup.
Before treament
Cytokine
± SD
After treament
± SD
Control group
p
± SD
IL-6 (pg/mL)
13.78 ± 19.66 (1)
0.76 ± 2.21 (2)
1.3 ± 1.83 (3)
TNF-α (pg/mL)
47.26 ± 30.32 (4)
18.71 ± 10.71 (5)
5.62 ± 5.8 (6)
p(1:2)
p(2:3)
p(4:5)
p(5:6)
< 0.05
> 0.05
< 0.05
< 0.05
Table 5: Serum level of IL-6 and TNF-α non-responder subgroup.
Cytokine
Before treament
± SD
IL-6 (pg/mL)
TNF-α (pg/mL)
After treament
± SD
Control group
p
± SD
4.31 ± 5.41 (1)
18.43 ± 40.74 (2)
1.3 ± 1.83 (3)
39.42 ± 26.19 (4)
92.71 ± 132.65 (5)
5.62 ± 5.8 (6)
p(1:2)
p(2:3)
p(4:5)
p(5:6)
> 0.05
> 0.05
> 0.05
> 0.05
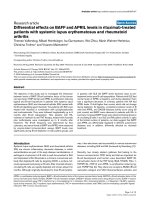
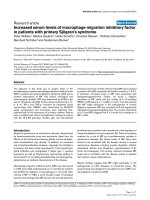
Figure 2: ROC analysis of TNF-α and IL-6 in SLE.
189
Journal of military pharmaco-medicine no5-2019
DISCUSSION
In all studies reviewed, females had a
higher incidence of SLE compared with
males, female/male ratio: 5.8. The mean
age: 28 ± 10.61. The UK estimated SLE
incidence: 7.89/100,000 person/years
(95%CI: 7.46 - 8.31) for females compared
with 1.53/100,000 person/year (95%CI:
1.34 - 1.71) for males [5]. Nguyen Huu Truong
(2017) conducted a study on 128 patients
with SLE at the Center for Allergy - Clinical
Immunology of Bachmai Hospital with
92.9% of female patients. The mean age
was 31.1 ± 9.46 [1].
C3 was a common factor in both
pathways of complement activation,
C4 engaged in classical complement
activation pathway. Both C3 and C4 were
sensitive to lupus diagnosis recommended
by ACR as a standard of diagnostic criteria
[3]. Before treatment: the concentration of
C3 reduced down to 94.11%, that of C4
was decreased in 79.41% of patients, the
C3 concentrations were reduced in 55.88%
of patients after treatment and the C4
concentrations were reduced in 20.58% of
patients after treatment. The mean SLEDAI
score before treatment was 16.56 ± 3.91
points and decreased after treatment
(9.24 ± 4.0), p < 0.05. Also in the study by
Li-jun Song (2013), mean SLEDAI score
before treatment was 11.45 ± 3.76 and
after treatment, it decreased down to
7.9 ± 4.0 [7]. Our research was similar to
Feng Qiu et al’s (2013): SLEDAI scores
ranged from 10 to 23 (15.1 ± 3.8) before
treatment and from 6 to 22 (12.2 ± 4.0)
after treatment [8].
There were 79.41% of patients responding
to treatment and 20.58% of patients were
non-responsive. The group of patients
responded to treatment: The average of
TNF-α was 47.26 ± 30.32 pg/mL and
190
18.71 ± 10.71 pg/mL, respectively (p < 0.05)
before and after treatment, p < 0.05.
Before treatment, the average of IL-6 was
13.78 ± 19.66 pg/mL and post-treatment it
was 0.76 ± 2.21 pg/mL, the difference
was statistically significant (p < 0.05),
there was no difference between IL-6
serum after treatment and control group
(1.3 ± 1.83 pg/mL). The group of patients
did not respond to treatment: The average
IL-6 after treatment was 18.43 ± 40.74
pg/mL, TNF-α was 92.71 ± 132.65 pg/mL,
they were similar to pre-treatment
(IL-6: 4.31 ± 5.41 pg/mL and TNF-α:
39.42 ± 26.19 pg/mL) (p > 0.05). In the
study by Feng Qiu et al (2013): thirty
newly diagnosed severe SLE patients and
30 healthy subjects found that the average
concentration of TNF-α patients pre-treatment
was 89.59 ± 20.27 ng/mL, after treatment
the concentration reduced down to 54.31
± 17.17 ng/mL, the average concentration
of the control group was 37.46 ± 11.63 ng/mL,
the difference was statistically significant
(p < 0.05). Before treatment, the average
concentration of IL-6 serum was 1.56 ±
1.18 pg/mL, after treatment, the average
concentration decreased to 0.97 ± 0.37 pg/mL,
the average concentration of the control
group was 0.7 ± 0.05 pg/mL - the difference
was statistically significant (p < 0.05) [8].
Our research was consistent with Li-jun
Song’s: before treatment, the mean level
of IL-6 was 0.86 (0.7 - 1.72). After
treatment, it was 0.72 (0.58 - 1.18) [3].
We tried to analyze biomarkers to see
whether IL-6 and TNF-α were predictors
of differentiation between healthy people
and patients with SLE. ROC analysis of
TNF-α and IL-6 was used to assess the
discrimination between patients with SLE
and controls, the area under the curve
(AUC) for TNF-α was 0.98, IL-6 was
0.664 (p < 0.001). In the study by Helena
Journal of military pharmaco-medicine no5-2019
Idborg (2018): the AUC for TNF-α was
0.86 (0.83 - 0.89) [9]. They may be useful
independent markers for prediction of
SLE disease activity and to differentiate
normal subjects from those having SLE.
They were increased in the acute phase
of the disease. We propose that the TNFα and IL-6 merit further investigations as
clinically useful biomarkers in SLE.
CONCLUSIONS
From our study, by following up
34 patients with SLE treated in acute crisis,
we draw some conclusions:
There were 79.41% of patients responding
to treatment and 20.58% of patients
non-responsive. The group of patients
responds to treatment: The average of
TNF-α quantity after treatment (18.71 ±
10.71 pg/mL) was reduced in comparison
with that of pre-treatment (47.26 ±
30.32 pg/mL). The concentration of IL-6
before treatment was 13.78 ± 19.66 pg/mL
which reduced to 0.76 ± 2.21 pg/mL after
treatment, the difference was statistically
significant (p < 0.05). The group of patients
did respond to treatment: The average of
IL-6 after treatment was 18.43 ± 40.74 pg/mL,
TNF-α was 92.71 ± 132.65 pg/mL, they
were similar to pre-treatment group
(IL-6: 4.31 ± 5.41 pg/mL and TNF-α:
39.42 ± 26.19 pg/mL), p > 0.05. ROC analysis
of TNF-α and IL-6 was used to assess the
discrimination between patients with SLE
and controls. The AUC for TNF-α was
0.98, IL-6 was 0.664 (p < 0.001). Serum
TNF-α and IL-6 are sensitive markers for
SLE disease activity.
REFERENCES
1. Nguyen Huu Truong. Study the correlation
between the disease activity index and some
autoantibodies in systemic lupus erythematosus.
Hanoi. PhD Thesis. 2017.
2. Yovana Pacheco, Julián Barahona-Correa,
Diana M. Monsalve, Yeny Acosta-Ampudia
at el. Cytokine and autoantibody clusters
interaction in systemic lupus erythematosus.
Journal of Translational Medicine. 2017,
Vol.15, 239, pp.1-15.
3. Li-jun Song, Wei-wei Liu, Yu-chen Fan,
Feng Qiu, Qi-lin Chen et al. The positive
correlations of apolipoprotein E with disease
activity and related cytokines in systemic
lupus erythematosus. Diagnostic Pathology.
2013, Vol.8, 175.
4. Iraj Salehi Abari. 2015 ACR/SLICC
Revised Criteria for Diagnosis of Systemic
Lupus Erythematosus. Autoimmune Diseases
and Therapeutic Approaches. 2015, Vol. 2,
No. 1, pp.1-4/114.
5. Luis M.Amezcua-Guerra, Violeta
Higuera-ortiz et al. Performance of the 2012
Systemic Lupus International Collaborating
Clinics and the 1997 American College of
Rheumatology Classification Criteria for
Systemic Lupus Erythematosus in a Real-Life
Scenario. Arthritis Care & Research. 2015,
March, Vol. 67, No. 3, pp.437-441.
6. Frances Rees, Michael Doherty,
Matthew J. Grainge et al. The worldwide
incidence and prevalence of systemic lupus
erythematosus: A systematic review of
epidemiological studies. Rheumatology. 2017,
Vol. 56, pp.1945-1961.
7. Li-jun Song, Xiao Wang, Xu-ping Wang,
Dong Li et al. Increased Tim-3 expression on
peripheral T lymphocyte subsets and association
with higher disease activity in systemic lupus
erythematosus. Diagnostic Pathology. 2015,
Vol.10, 71, pp.1-9.
8. Feng Qiu, Lijun Song, Feng Ding,
Huaxiang Liu et al. Expression level of the
growth factor progranulin is related with
development of systemic lupus erythematosus.
Diagnostic Pathology. 2013, Vol. 8:88.
9. Helena Idborg, Susanna Eketjäll et al.
TNF-α and plasma albumin as biomarkers of
disease activity in systemic lupus erythematosus.
Lupus Science & Medicine. 2018, Vol. 5,
pp.1-9.
191