Drug resistance and distribution of NAT2 variants in newly diagnosed and recurrent Vietnamese pulmonary tuberculosis patients
Bạn đang xem bản rút gọn của tài liệu. Xem và tải ngay bản đầy đủ của tài liệu tại đây (467.66 KB, 7 trang )
VNU Journal of Science: Medical and Pharmaceutical Sciences, Vol. 35, No. 1 (2019) 81-87
Original Article
Drug Resistance and Distribution of NAT2 Variants in Newly
Diagnosed and Recurrent Vietnamese
Pulmonary Tuberculosis Patients
Vu Thi Thom1,*, Le Thi Luyen1, Le Anh Tuan1,
Pham Thi Hong Nhung1, Nguyen Thi Thu Ha2
1
VNU School of Medicine and Pharmacy, 144 Xuan Thuy, Cau Giay, Hanoi, Vietnam
2
National Hospital of Tropical Diseases, 78 Giai Phong, Dong Da, Hanoi, Vietnam
Received 03 May 2019
Revised 09 May 2019; Accepted 21 June 2019
Abstract: Drug resistant TB is currently a global challenge causing high risk of death and expanding
the disease. This study explores the prevalence of drug resistance in newly diagnosed and recurrent
TB patients and identifies the association between NAT2 gene polymorphism distribution and
acetylator phenotype of NAT2 gene and the two study groups. The study results show that the newly
diagnosed TB had l lower male ratio and younger age in comparison to the recurrent TB. Newly
diagnosed group was more sensitive to first line TB drugs. However, both groups had significant
resistance ratio in relation to INH and SM. Finally, the allele and acetylator phenotype frequency of
NAT2 showed the significant association with TB status. The study concludes that the newly
diagnosed and recurrent TB patients expressed differently in their profiles concerning patient’s
background, drug resistance and NAT2 allele distribution.
Keywords: Drug resistance, INH, NAT2 polymorphism, newly diagnosed TB, recurrent TB1.
1. Introduction
efforts of the world, between 2000 and 2018 it is
estimated that about 53 million people have been
discovered and treated for TB to help reduce the
death rate due to falling to 37%. Despite its focus
on control, tuberculosis is still one of the top 10
Tuberculosis (TB) is a highly contagious
infectious disease, complex clinical diagnosis
and prolonged treatment period. According to
WHO statistics (2018), with the continuous
________
Corresponding author.
Email address:
/>
81
82
V.T. Thom et al. / VNU Journal of Science: Medical and Pharmaceutical Sciences, Vol. 35, No. 1 (2019) 81-87
causes of death and the number one cause of
death due to infectious disease (in HIV).
Vietnam is one of the hot spots of tuberculosis,
ranking 14th out of 30 countries with high TB
burden (WHO, 2018) [1]. In 2017, the total
number of TB cases reported in Vietnam was
105,733 of which about 80% were newly
infected and re-infected patients. Although
worldwide, the incidence of tuberculosis is
decreasing by about 2% per year but so far TB is
still a challenge due to the development and
spread of drug-resistant TB. Patients with drugresistant TB often have long, expensive
treatment periods. In Vietnam, the average cost
of a multidrug-resistant tuberculosis is about
$400, much higher than the cost of more than
$150 for regular TB patients. According to the
latest WHO statistics, 3.5% of new TB cases and
18% of new TB cases are resistant to rifampicin
or multiple resistance to rifampicin and isoniazid
(MDR/ RR-TB) globally. In Vietnam, this figure
is estimated at 4.1% and 17% respectively.
However, this is only an estimate because only
about 32% - 67% are assessed for resistance to
rifampicin (WHO, 2018) [1]. In the first-line
anti-TB drugs, in addition to rifampicin and
isoniazid, the two most important drugs in TB
treatment
regimens
are
streptomycin,
ethambutol, pyrazinamide. In recent years, the
situation of drug resistance with these three
drugs has received little attention. Focusing only
on the two most important drugs, rifampicin and
isoniazid, can ignore the noticeable changes in
drug resistance of these three drugs.
Currently, isoniazid is used in most TB
patients by age, sex, in regimens for treatment of
new TB patients, tuberculosis treatment and
including preventive treatment [2]. Isoniazid is
metabolized by NAT2 enzyme in the liver.
Genetic polymorphism of NAT2 gene is known
to be closely related to response to isoniazid in
patients with TB. Research in South Africa
showed that although more than 98% of patients
adhere to treatment, but the situation of drug
resistance still ocurs and another study also
confirmed that resistance is not only due to noncompliance but also due to other specific
pharmacokinetics of drugs between individuals.
On the other hand, some studies have shown that
a patient's genetic factor may also be one of the
risk factors for TB infection [3-6].
2. Materials and methods
2.1. Study objects
This study enrolled 125 TB patients with 69
newly diagnosis and 56 recurrent TB patients
from 3 hospitals including Vietnam National
Lung Hospital, Hanoi Lung Hospital and
National 74-Hospital from 2017 to 2018. This
process was approved by IRB of School of
Medicine and Pharmacy, Vietnam National
University Hanoi.
2.2. Methods
2.2.1. Data collection and sampling
Patient samples and data was collected by
the guideline of Ministry of Health, Vietnam for
TB. For gene analysis, venous blood was drawn
into EDTA containing tubes, frozened and stored
at -20oC.
2.2.2. NAT2 gene analysis
DNA from each patient was obtained from
venous total blood samples by using E.Z.N.A
blood DNA Mini Kit (Omega-Biotek Inc.,
USA). PCR-RFLP and Sanger’s sequencing
were applied to determine NAT2 genotype by
using a pair of specific primers (5’-GGA ACA
AAT TGG ACT TGG-3’ and 5’-TCT AGC ATG
AAT CAC TCT GC-3’). PCR mixture was
composed of 20 ng/μl DNA template, 0.5 μM of
each primer (Phusa biochem Inc., Vietnam),
Kapa 2G ™ Robust HotStart ReadyMix 2x
(Kapa Biosystems Inc., USA). PCR program
settings included preheating at 95°C for 3 min,
35 cycle of 95°C for 10s, 57°C for 15s, 72°C for
60s, and then extension at 72°C for 10 min.
2.2.3. Data analysis
Sequence analysis was performed by a
BLAST search in the GenBank database and
BioEdit version 7.1.9 software. Data analysis
V.T. Thom et al. / VNU Journal of Science: Policy and Management Studies, Vol. 35, No. 1 (2019) 81-87
was performed with SPSS 20.0. Statistical
properability p<0.05 was considered as
significant difference.
3. Results
3.1. General data of study population
83
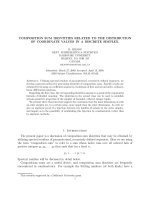
Table 3.1 showed that the general data newly
diagnosis TB and recurrent TB groups. In study
population, male number in comparison to
female number was nearly two times in newly
diagnosis TB group and approximately four
times in recurrent TB group. The age of patients
in recurrent TB was higher than that of newly
diagnosis TB.
Table 3.1. General information of study population
Criteria
̅ ± SD) or (%)
(𝐗
Gender (male/female)
Age (years)
BMI
Bacteria culture period (hours)
Growth unit
Pulmonary Tuberculosis Groups
Newly diagnosis TB (n=69) Recurrent TB (n=56)
63.8/36.2
87.5/12.5
41.11±14.70
48.79±13.58
18.91±2.25
18.65±2.40
210.35±10.37
250.61±13.65
2285.0±658.57
1915.3±748.70
p
0.002
0.003
0.539
0.018
0.711
̅ ± SD: mean ± standard deviation
Note: BMI: Body Mass Index; 𝑿
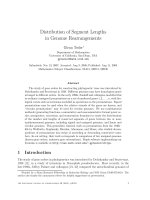
3.2. Drug resistance of TB in study population
In newly diagnosis TB, the ratio of case
sensitive to all drugs (71.1%) was two times
higher than that of recurrent TB group (39.3%)
whereas the ratio of resistant drug in recurrent
TB group (60.7%) was nearly three times higher
than the newly diagnosis TB group (21.7%),
significantly (p<0.05). The results were
presented in table 3.2. In aspect to each first line
TB drug, the resistance ratio of two groups
newly diagnosis and recurrent TB were only
significant difference with isoniazid and
streptomycin treatment with p=0.001 and
p=0.000, respectively.
Table 3.2. Drug resistant ratio in newly diagnosis and recurrent TB
Drug resistance (n, %)
Sensitive to all drugs
Resistant to at least one drug
Sensitive
INH
Resistant
Sensitive
RIF
Resistant
Sensitive
SM
Resistant
Sensitive
EMB
Resistant
Sensitive
PZA
Resistant
Sensitive
MDR(*)
Resistant
Pulmonary Tuberculosis Groups
Newly diagnosis TB (n=69)
Recurrent TB (n=69)
54 (71.1%)
22 (39.3%)
15 (21.7%)
34 (60.7%)
58 (84.1%)
32 (57.1%)
11 (15.9%)
24 (42.9%)
68 (98.6%)
51 (91.1%)
1 (1.4%)
5 (8.9%)
60 (87.0%)
31 (72.8%)
9 (13.0%)
25 (44.6%)
68 (98.6%)
51 (91.1)
1 (1.4%)
5 (8.9%)
68 (98.6%)
52 (92.9%)
1 (1.4%)
4 (7.1%)
68 (98.6%)
51(91.1%)
1 (1.4%)
5 (8.9%)
Statistic tests
χ2=20.931
p=0.000
χ2=11.108
p=0.001
χ2=3.784
p=0.089
χ2=15.588
p=0.000
χ2=3.784
p=0.089
χ2=2.610
p=0.172
χ2=3.784
p=0.089
Note: INH: isoniazid; RIF: rifampicin; SM: streptomycin; EMB: ethambutol, PZA: pyrazinamide;
MDR(*): Resistant to at least RIF and INH
84
V.T. Thom et al. / VNU Journal of Science: Medical and Pharmaceutical Sciences, Vol. 35, No. 1 (2019) 81-87
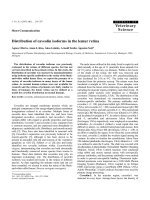
3.3. NAT2 polymorphism and acetylation genotype in newly diagnosis and recurrent TB groups
Table 3.3. NAT2 allele frequency in newly diagnosis and recurrent TB groups
Allele frequency
NAT2 allele
*4
*5
*6
*7
Wildtype allele
Variant allele
Total
(n=125*2)
116 (0.464)
16 (0.064)
78 (0.312)
40 (0.160)
Statistic test
Total
116 (0.464)
134 (0.536)
Statistic test
Newly diagnosis TB
(n=69*2)
73 (0.529)
10 (0.072)
38 (0.276)
17 (0.123)
P=0.069
Newly diagnosis TB
73 (0.529)
65 (0.471)
P=0.022
Recurrent TB
(n=56*2)
43 (0.384)
6 (0.054)
40 (0.357)
23 (0.205)
Recurrent TB
43 (0.384)
69 (0.616)
Table 3.4. NAT2 genotype frequency in newly diagnosis and recurrent TB groups
NAT2
genotype
*4*4
*4*5
*4*6
*4*7
*5*5
*6*6
*7*7
*5*6
*5*7
*6*7
Genotype frequency
Total
(n=125)
34 (27.2%)
7 (5.6%)
28 (22.4%)
13 (10.4%)
1 (1.4%)
15 (12%)
5 (4.0%)
5 (4.0%)
2 (1.6%)
15 (12.0%)
Statistic test
When observed the significant difference in
allele frequency between two groups, we
performed the NAT2 acetylation phenotype
analysis. In general, recurrent TB group
contained most of intermediate and slow NAT2
acetylator (83.9%). Whereas, in newly diagnosis
Newly diagnosis TB
(n=69)
25 (36.2%)
5 (7.2%)
12 (17.4%)
6 (8.7%)
0 (0%)
8 (11.6%)
1 (1.4%)
2 (2.9%)
1 (1.4%)
8 (11.6%)
P=0.206
Recurrent TB
(n=56)
9 (16.1%)
2 (3.6%)
16 (28.6%)
7 (12.5%)
1 (0.8%)
7 (12.5%)
4 (7.1%)
3 (5.4%)
1 (1.8%)
7 (12.5%)
TB group, the NAT2 rapid acetylator for INH
was more abundant with 36.2% while in
recurrent TB group it was only 16.1%. This
reached the statistically significant difference
presented in table 3.5 (p=0.042).
Table 3.5. Association between NAT2 phenotype and INH resistance in TB groups
NAT2 acetylation
phenotype
Rapid
Intermediate
Slow
Statistic test
TB group
Newly diagnosis TB (n=69)
25 (36.2%)
23 (33.3%)
21 (30.4%)
χ2=6.353; p=0.042
Total
Recurrent TB (n=56)
9 (16.1%)
25 (44.6%)
22 (39.3%)
34 (27.2%)
48 (38.4%)
43 (34.4%)
V.T. Thom et al. / VNU Journal of Science: Policy and Management Studies, Vol. 35, No. 1 (2019) 81-87
4. Discussion
According to the WHO report (2018),
around 6 million men have tuberculosis
worldwide, while only about 3.2 million women
have TB. In Vietnam, in 2006-2007, the National
Tuberculosis Program conducted a nationwide
tuberculosis investigation revealed that the
prevalence of male TB is 4-5 times higher than
for women [7]. In our study, the ratio of
men/women was 2.9, significantly higher in
some other domestic studies at 2.4 times [8].
This can be explained by the fact that the study
is limited to patients with pulmonary
tuberculosis, the number of studies is not large
enough and because of recent years the
development of socio-economic conditions people's awareness increases muscle Women's
access to health systems. The male/female
disparity in the new tuberculosis group is 1.76,
approximately equal to 1.92 in the study of
Hoang Thi Phuong (2009) [2]. The ratio of male
to female in the pulmonary tuberculosis retreatment group of the study was 7.0 higher than
in the Hoang Ha study (4.0) (2009) [7]. The
reason may be that men often do not have the
patience to follow the treatment process, along
with high risk factors such as smoking,
alcoholism so often leads to relapse.
The average age in the study of the
pulmonary tuberculosis re-treatment group
(48.79 years) was higher than that of the new
pulmonary tuberculosis group (41.11 years).
The difference in average age between the two
groups was statistically significant (p <0.05).
This reflects the relationship between age and
new TB status lower than remission. The
difference between the two groups may be
because in older people the general resistance
status of the body is inferior to that of young
people.
For anti-tuberculosis drugs, isoniazid,
rifampicin, streptomycin, ethambutol, and
pyrazinamide after more than half a century have
been used, the most resistant strains of bacteria
are found in different levels. Since 1997, the
National Tuberculosis Program has conducted
85
four surveys of the national rate of antituberculosis resistance. In 2005-2006, the third
national drug resistance survey, general drug
resistance was 30.9%; in re-treatment TB, the
rate of drug-resistant TB was 58.9%; multi-drug
resistance is 19.3%; resistance to isoniazid
43.5% and streptomycin is 50.7%; and multidrug resistance 2.7% in new TB [9]. According
to research by Hoang Thi Phuong (2009), there
are 31.6% of patients resistant to any drug
(56/177). Thus, the overall drug resistance rate
of the study is 39.2%, which tends to be higher
than the national rate [2]. This may be because
the patients in this study were patients at three
hospitals in Hanoi area, where the population is
concentrated, and are the facilities that treat
patients with drug-resistant TB. This is also a
noticeable sign in the national tuberculosis
prevention action program, to take measures to
minimize the spread of tuberculosis, especially
drug-resistant TB.
The fourth drug resistance survey of the
national tuberculosis prevention program (20112012), the overall rate of multi-drug resistance is
4%, the re-treatment group is 23.3% [9]. And
according to the latest WHO report (2018) in
2017, the estimated multi-drug resistance rate in
Vietnam in new patients is 4.1% and relapse is
17%. Thus, the multidrug resistance rate in the
re-treatment TB group in this study is much
lower than the rate of the fourth national drug
resistance survey as well as the latest WHO report
(2018) and some studies in other countries [1].
Among the first five anti-tuberculosis drugs,
the highest rate of drug resistance was
streptomycin (44.6%) and followed by isoniazid
(42.9%) on the recurrent tuberculosis group.
From 1996-1997, when Vietnam conducted the
first nationwide drug resistance survey, the rate
of isoniazid resistance was 20%; streptomycin
resistance is 24%. By the fourth survey in 20112012, this rate in re-treatment patients was
43.5% of isoniazid and 50.7% of streptomycin
resistance [9]. Thus, the rate of streptomycin and
isoniazid resistance in the re-treatment patients
of the study is lower than the recent drug
resistance survey and some other domestic
86
V.T. Thom et al. / VNU Journal of Science: Medical and Pharmaceutical Sciences, Vol. 35, No. 1 (2019) 81-87
studies (streptomycin resistance is 79.5%,
isoniazid resistance is 82.2%). [10] but higher
than foreign authors [11]. The rate of isoniazid
in the pulmonary tuberculosis re-treatment group
of the study is lower than many other domestic
studies [7]. This may be the result of efforts to
reduce drug resistance in the national TB
program. But the rate of resistance of isoniazid
is still higher and higher than that of the world
[11], and there is a much higher rate between retuberculosis and new pulmonary tuberculosis.
Therefore, it is necessary to have strict monitoring
measures in the use of isoniazid treatment, to
ensure that isoniazid is still a good source of
medicine for TB treatment and TB prevention.
The distribution frequency of a combination
of 10 genotypes between the new TB group and
the re-treatment TB was not different (p =
0.206). The proportion of wild type homozygous
genotypes accounts for the largest proportion,
followed by alleles in the combination of alleles
* 4 and alleles * 6. The frequency of allele
distribution and the proportion of NAT2
genotypes is also studied in many human
populations around the world. Many studies
have shown that, in Europeans, Europeans,
Indians, Omanis, Moroccans, the frequency of
allele NAT2 * 5 is large, alleles * 4, * 6 and * 7
occupy small percentage [3]. For example, in the
Moroccan population in the study of Guaoua et
al. (2014), the allele distribution frequency * 5
accounted for 53% and genotype combinations
of * 5 such as * 5 * 5, * 4 * 5, * 5 * 6 accounts
for nearly 70%, this is completely different from
the allele distribution and NAT2 genotype in the
Vietnamese patient population in this study [3].
The study of Toure et al (2016) on Senegan
tuberculosis patient populations (Africa) shows
the presence of polymorphs * 4, * 5, * 6, * 7, *
12, * 14 in which frequency Allele distribution *
5, * 6 accounted for the highest proportion
(26.6%) [5]. Studies on Asian populations such
as Korean and Japanese show a much lower ratio
* 5, * 6, * 7 more. However, in Japanese mainly
* 6, * 7 accounts for a very low rate, while in
Korean people the allele ratio of * 6 and * 7 are
similar to our results.
We see the acetylation of NAT2 phenotype in
populations of Europe, Africa and Asia in
general are similar [5-6] In these populations,
mainly isoniazid metabolic phenotypes slow and
medium, fast metabolic phenotype accounts for
less than 20%. In the Americas, the average
metabolic phenotype is the majority, the rate of
metabolism is fast and the same is similar. In
contrast, in the North Asian population, the rate
of rapid and average metabolic phenotypes
accounts for over 80%, few have slow metabolic
phenotype [8]. A study on Thai patients with
anti-tuberculosis resistance and liver damage
showed that 71.7% had a slow metabolic
phenotype, 22.6% had a moderate metabolic
phenotype and 5.7% had a transfer pattern. rapid
metabolism, while slow, medium, and fast NAT2
metabolic phenotype in the control group
without liver damage was 22.4%; 62.4% and
15.3% [8]. Similar to the study of Thailand, the
phenylation phenotype in the Vietnamese TB
population in this study is mainly the medium
and slow metabolic phenotype (> 70%), below
30% with the rate rapid metabolic phenotype. In
the new tuberculosis group, there was a uniform
distribution between the acetylated NAT2
phenotypes, but in the tuberculosis regimen, the
rapid acetylation phenotype was significantly
lower than the other two groups (16%) and similar
to the distribution in Asians in general and lower
than North Asian populations (40%) [3].
5. Conclusion
The overall rate of drug resistance for firstline anti-TB drugs is relatively high at 39.2%.
The rate of Streptomycin and Isoniazid
resistance is high, especially in the recurrent
pulmonary group. NAT2 allele distribution and
NAT2 acetylator phenotype in newly diagnosis
and recurrent TB were significantly difference.
Acknowledgements
This study was supported by a grant from the
Vietnam Ministry of Science and Technology,
V.T. Thom et al. / VNU Journal of Science: Policy and Management Studies, Vol. 35, No. 1 (2019) 81-87
and Newton Fund Vietnam (Grant Number
HNQT/SPĐP/01.06).
References
[1] WHO,
Global
Tuberculossi
report,
/>/en/, 2018 (accessed 16 April 2019).
[2] Hoàng Thị Phượng, Nghiên cứu đặc điểm lâm
sàng, cận lâm sàng, tính kháng thuốc của vi khuẩn
ở bệnh nhân lao phổi mới kết hợp bệnh đái tháo
đường, Luận văn tiến sĩ Y học, trường Đại học Y
Hà Nội, 2009.
[3] S. Guaoua, I. Ratbi, F.Z. Laarabi, S.A. Elalaoui, IC.
Jaouad, A. Barkat, A. Sefiani, Distribution of
allelic and genotypic frequencies of NAT2 and
CYP2E1 variants in Moroccan population, BMC
Genet. 15 (2014) 156.
[4] A. Toure, M. Cabral, A. Niang, C. Diop, A. Garat, L.
Humbert, M. Fall, A. Diouf, F. Broly, M. Lhermitte,
D. Allorge,
Prevention of isoniazid toxicity by
NAT2 genotyping in Senegalese tuberculosis
patients, Toxicol Rep. 3 (2016) 826-831.
[5] M. Majumder, N. Sikdar, S. Ghosh, B. Roy,
Polymorphisms at XPD and XRCC1 DNA repair
loci and increased risk of oral leukoplakia and
cancer among NAT2 slow acetylators, Int J Cancer.
120(10) (2007) 2148-2156.
[6] S. Morita, M. Yano, T. Tsujinaka, Y. Akiyama,
M. Taniguchi, K. Kaneko, H. Miki, T. Fujii,
[7]
[8]
[9]
[10]
[11]
87
K. Yoshino, H. Kusuoka, M. Monden, Genetic
polymorphisms of drug-metabolizing enzymes and
susceptibility to head-and-neck squamous-cell
carcinoma, Int J Cancer. 80(5) (1999) 685-688.
Hoàng Hà, Nghiên cứu một số đặc điểm lâm sàng,
cận lâm sàng, sinh học của vi khuẩn ở bệnh nhân
lao phổi điều trị lại, Luận án tiến sỹ Y học, Trường
Đại học Y Hà Nội, 2009.
S. Wattanapokayakit, T. Mushiroda, H. Yanai, N.
Wichukchinda, C. Chuchottawon, S. Nedsuwan,
A. Rojanawiwat, S. Denjanta, T. Kantima, J.
Wongyai, W.
Suwankesawong, W.
Rungapiromnan, R.
Kidkeukarun, W.
Bamrungram, A. Chaiwong, S. Suvichapanich, S.
Mahasirimongkol, K. Tokunaga, NAT2 slow
acetylator associated with anti-tuberculosis druginduced liver injury in Thai patients, Int J Tuberc
Lung Dis. 20(10) (2016) 1364-1369.
Đinh Ngọc Sỹ, Chiến lược quản lý bệnh lao đa
kháng thuốc tại Việt Nam, Tạp chí khoa học Hội
Phổi Pháp - Việt. 2(3) (2011) 40-42.
Nguyễn Thu Hà, Trần Văn Sáng, Đinh Ngọc Sỹ,
Lâm sàng, cận lâm sàng và tính kháng thuốc của vi
khuẩn lao ở bệnh nhân lao phổi tái phát, JFran Viet
Pneu. 2(3) (2011) 63-67.
D. Tu, L. Zhang, J. Su, Resistance and efficacy of
treatment in relapse pulmonary tuberculosis,
Zhonghua Jie He He Hu Xi Za Zhi. 23 (11) (2000)
666-668.