Ebook Ultrasonography of the pancreas (edition): Part 2
Bạn đang xem bản rút gọn của tài liệu. Xem và tải ngay bản đầy đủ của tài liệu tại đây (12.88 MB, 116 trang )
7
Pancreatitis and Pseudocysts
Steffen Rickes and Holger Neye
7.1
Introduction
Ultrasonography (US) is a noninvasive imaging modality which is often the first imaging technique in the
evaluation of patients with pancreatic diseases. It has
undergone significant advances in recent years. In this
chapter the value of US in the diagnosis of pancreatitis
and pseudocysts will be described and discussed. The
article is focused on B-mode US, Doppler sonography
and contrast-enhanced ultrasound (CEUS).
7.2
Acute Pancreatitis
Acute pancreatitis is a common disease that affects
about 300,000 patients per year in America with a mortality of about 7% [1]. The diagnosis is based on clinical
and laboratory evaluation. The clinical course of acute
pancreatitis varies from a mild transitory form to a severe necrotizing disease. Most episodes of acute pancreatitis are mild and self-limiting. Patients with mild
pancreatitis respond well to medical treatment, requiring
little more than intravenous fluid resuscitation and analgesia. In contrast, severe pancreatitis is defined as pancreatitis associated with organ failure and/or local complications such as necrosis, abscess formation, or
pseudocysts. Severe pancreatitis can be observed in
about 20% of all cases, and requires intensive care and
sometimes surgical or radiologic intervention. Early
S. Rickes ( )
Department of Internal Medicine
AMEOS Hospital St. Salvator, Halberstadt, Germany
e-mail:
correct assessment of the etiology and the severity of
acute pancreatitis allows distinct therapeutic algorithms
and can result in better outcome [1]. Advances in imaging modalities have revolutionized the management
of patients with acute pancreatitis over the past decade.
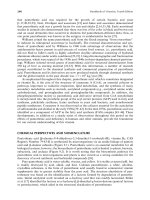
Contrast enhanced computed tomography (CT) is
the criterion standard for diagnosing pancreatic necrosis
and peripancreatic collections, as well as for grading
acute pancreatitis by the Balthazar system [2]. In recent
years the Balthazar grading system has been further developed into the so-called CT severity index (Table 7.1).
This index is an attempt to improve the early prognostic
value of CT by the intravenous administration of contrast
medium. In this way also parenchymal necrosis of the
pancreas can be diagnosed [3, 4]. The CT severity index
can also be used for other imaging procedures.
Table 7.1 Computed tomography grading of severity of acute
pancreatitis [2-4]. This system can also be used for other imaging
modalities
Computed tomography grade
(A) Normal pancreas
(B) Edematous pancreatitis
(C) B plus mild extrapancreatic changes
(D) Severe extrapancreatic changes including
one fluid collection
(E) Multiple or extensive extrapancreatic changes
3
4
Necrosis
None
0
2
4
6
CT severity index = CT grade+necrosis score
Complications
0-3
8%
4-6
35%
7-10
92%
M. D’Onofrio (ed.), Ultrasonography of the Pancreas, © Springer-Verlag Italia 2012
0
1
2
Deaths
3%
6%
17%
83
84
Fig. 7.1 Gallstone at the main bile duct at transabdominal US
Transabdominal US is the imaging method of choice
in patients with acute abdomen due to its wide availability and portability. However, several limitations can
be encountered in patients with acute pancreatitis mainly
related to abdominal pain, which makes compressions
with the probe impossible, and abundant overlying gas
owing to a paralytic ileus. Very often a partial or inadequate transabdominal US visualization of the pancreas
will result. Therefore, CT is still of paramount importance for the first evaluation of the disease. However,
during the course of the disease, US may serve as an
excellent imaging tool for short-term follow-up studies.
Another potential advantage of US is the good visualization of the biliary system. Biliary stones are the most
frequent causes of acute pancreatitis. US can easily detect stones in the gallbladder and in the biliary tract
with high diagnostic accuracy (Fig. 7.1). This is very
useful to triage patients requiring endoscopic retrograde
cholangiopancreatography (ERCP) and sphincterotomy.
However, the diagnosis of a bile duct stone with US is
obviously influenced by operator skill. One German
study demonstrated that experienced examiners achieve
a significantly higher diagnostic accuracy for the detection of choledocholithiasis than less experienced investigators (83% versus 64%) [5]. Other studies showed
that with endoscopic ultrasonography (EUS) (Fig. 7.2)
and magnetic resonance cholangiopancreatography
(MRCP) better results can be achieved [6-8]. However,
these methods should be used only in patients with suspected choledocholithiasis but without detection of
stones at transabdominal US. Finally, interventional procedures, such as aspiration and drainage of fluid collections, may be performed under US guidance.
S. Rickes, H. Neye
Fig. 7.2 Gallstone (calipers) in the main bile duct at EUS
Fig. 7.3 Acute edematous pancreatitis located at the pancreatic
head which appears enlarged and hypoechoic at transabdominal US
In early pancreatitis, the organ may be of normal
size and echotexture. However, in most patients interstitial edema results in an enlargement of the gland and
a subsequent hypoechoic appearance (Fig. 7.3). The
acute inflammation can be focal or diffuse, depending
on the distribution. Focal pancreatitis mostly occurs in
the pancreatic head and presents as a hypoechoic mass
that is sometimes difficult to differentiate from a tumor.
Complications of acute pancreatitis include acute
fluid collections representing exudates, peripancreatic
tissue necrosis or hemorrhage in various combinations,
parenchymal necrosis, and vascular complications.
Acute fluid collections are echopoor or echofree. They
occur most commonly around the pancreas (Fig. 7.4)
and usually spread into both the lesser sac and the anterior pararenal space up to the pericolic region. Furthermore, the enzyme-rich fluid can penetrate into
7 Pancreatitis and Pseudocysts
Fig. 7.4 Acute pancreatitis with enlargement of the pancreatic body
and fluid collections around the pancreas at transabdominal US
85
Fig. 7.5 Acute pancreatitis with peripancreatic fluid collection
and involvement of the left liver lobe at transabdominal US
a
Fig. 7.6 Necrotizing pancreatitis at transabdominal US. The
pancreatic head is destroyed and liquefied. The pancreatic body
is enlarged and inhomogeneous. A peripancreatic fluid collection
can also be appreciated
parenchymal organs, like the spleen or the liver (Fig.
7.5). In acute necrotizing pancreatitis, parts of the pancreas can be destroyed and liquefied (Fig. 7.6).
A major problem of conventional US is the detection
of non-liquefied parenchymal necrosis because it cannot
assess organ perfusion. Through the use of contrast
media, however, even at US the vascular behavior of
the pancreas can nowadays be examined. At CEUS
necrotic areas of the pancreas show no vascular structures (Fig. 7.7). A paper published in 2006 showed that
this method produces excellent results in the staging of
acute pancreatitis severity [9]. This study demonstrated
that the procedure is comparable to CT for the assessment of severe acute pancreatitis and can be recommended as a first-choice imaging procedure, especially
when iodinated contrast medium injection is contraindi-
b
Fig. 7.7 a,b Necrotizing pancreatitis at transabdominal US. a
Conventional US. Echopoor region (not liquefied necrosis) at the
pancreatic body at B-mode US. A differentiation between necrosis
and edema is impossible. b Contrast-enhanced US. The region
shows no vascular structures and can therefore be characterized
as necrotic
cated [9-12]. Ripollés et al. [13] reported that CEUS is
comparable to CT in detecting pancreatic necrosis as
well as predicting its clinical course and that therefore,
86
when CT is contraindicated, CEUS may be a valid alternative. However, it has to be considered that in this
study patients with incomplete US imaging of the pancreas were excluded. In light of the difficulties reported
above regarding the exploration of the pancreas in patients with acute pancreatitis, one role of CEUS may
be considered not in the first (staging) but in the further
evaluation (follow-up) always required in the management of the disease. A positive outcome would be a
significant reduction in the number of CT examinations
performed. However, when CT is contraindicated, magnetic resonance imaging (MRI), with absolutely the
same panoramic view of CT although less available
and more expensive, can be used with good results [14,
15]. For instance, if the definition of a fluid collection
proves difficult both at US and CT, it can be easily obtainable with MRI [14].
The most important complications of acute pancreatitis are infection of necrosis and vascular complications.
Necrotic infection more frequently appears 15–20 days
after the clinical onset of acute pancreatitis [16]. The
probability of infection increases proportionately to the
gravity of the acute pancreatitis at clinical and CT evaluation. Infection can be suspected in the presence of gas
bubbles produced by anaerobic bacteria within the fluid
collections. The detection of gas bubbles within the collections while difficult at US is instead immediate at
CT. This is the reason why when infection of necrosis is
first suspected CT must be performed again. Pancreatic
abscess is a collection of suppurative fluid, surrounded
by a fibrous capsule, adjacent to the pancreatic gland.
An abscess secondary to acute pancreatitis probably
starts off as infection of pancreatic necrosis. An abscess
appears later than infection of the necrosis, usually after
the fourth week [14]. Surgical necrosectomy or percutaneous debridement can be considered in treating infected
pancreatic necrosis. Percutaneous drainage under imaging-guidance is highly efficient in the treatment of pancreatic abscess/infected pancreatic pseudocysts [14]. The
mainly fluid content of the lesion explains the excellent
clinical success of the procedure. Percutaneous drainage
can be carried out under US or CT guidance, although
CT is again preferable [14].
The most common vascular complications are
thrombosis of the portal venous system, hemorrhage
into a pseudocyst, arterial erosions and disruption, formation of collateral vessels or pseudoaneurysms, and
rupture of a pseudoaneurysm (see also the paragraph
about pseudocysts). In patients with a history of pan-
S. Rickes, H. Neye
creatitis, the detection of a cystic lesion at US must be
further evaluated with Doppler to exclude the presence
of vascular complications [14, 17, 18]. The administration of microbubbles could potentially improve the
diagnosis of vascular complications. However, CT evaluation remains mandatory for diagnostic confirmation
and treatment planning. Angiography, playing no relevant role in the diagnostic phase, has to be immediately
used for treating vascular lesions [14].
7.3
Chronic Pancreatitis
Irrespective of its etiology, chronic pancreatitis is described by fibrosis, destruction, and distortion of the
pancreatic ducts with loss of parenchyma. The most
common cause in Europe is alcohol abuse. Other causes
include hereditary, tropical, autoimmune, and idiopathic
pancreatitis. The diagnosis of chronic pancreatitis is
based on clinical findings, laboratory evaluation of endocrine and exocrine pancreatic function, and imaging
findings. Although early morphologic changes of chronic
pancreatitis are difficult to recognize at imaging with
different techniques, the findings of advanced disease
are easily detected [19, 20]. ERCP has long been considered the diagnostic criterion standard in the diagnosis
of chronic pancreatitis. However, today ERCP has been
replaced by MRCP. MRI is nowadays a powerful noninvasive imaging modality for the study of chronic pancreatitis even in the early phase of the disease [15]. A
complete MRI study for chronic pancreatitis includes
imaging of the parenchyma before and after the administration of contrast material, and imaging of the duct
before and after secretin stimulation to evaluate pancreatic exocrine function through the analysis of the pancreatic fluid output. EUS seems also to be highly sensitive
in the detection of early morphologic changes [21]. Technologic advantages and new developments in US (compound and tissue harmonic imaging, high frequency
probes, CEUS and elastography) have improved the
value of US in the diagnosis of pancreatic diseases [22].
In the US study of chronic pancreatitis, alterations
in the size of the pancreas may be seen in about 50%
of patients affected by chronic pancreatitis. However,
the finding of a gland with normal size does not exclude
the diagnosis of chronic pancreatitis. Pancreatic atrophy
and focal alterations in size can be easily identified
(Fig. 7.8). However, these changes in pancreatic volume
are signs of advanced stages of the disease [23]. The
7 Pancreatitis and Pseudocysts
Fig. 7.8 Atrophy of the pancreatic parenchyma at transabdominal
US in a patient with late-stage chronic pancreatitis. The pancreatic
duct is dilated with very small intraductal plugs
87
echogenicity of the pancreas may be increased in
chronic pancreatitis due to fatty infiltration and fibrosis,
although this sign is not absolutely specific. In fact, it
can also be found in obese patients and the elderly.
Parenchymal alteration is a more specific sign of
chronic inflammation and represented by inhomogeneous and coarse lobulated parenchyma pattern due to
the coexistence of hyperechoic and hypoechoic parts
of fibrosis and inflammation, respectively (Fig. 7.9).
These findings can be diagnosed presumably with the
highest sensitivity at EUS [21, 23, 24].
The most important diagnostic sign of chronic pancreatitis is the presence of calcifications (Fig. 7.10)
[25, 26]. These calcifications are calcium carbonate
deposits. At US they appear as hyperechoic spots with
posterior shading. Small calcifications may be hardly
detectable. The diagnosis can be improved by the use
of the so-called twinkling artifact (Fig. 7.11). Twinkling
artifact is characterized by a rapidly fluctuating mixture
of Doppler signals that occurs behind a strongly re-
Fig. 7.9 Early-stage chronic pancreatitis at transabdominal US.
The pancreatic parenchyma is inhomogeneous and coarse (lobulated parenchyma)
a
b
Fig. 7.10 Chronic pancreatitis at transabdominal US with an increased volume of the pancreatic gland and the presence of multiple calcifications
Fig. 7.11 a,b Chronic pancreatitis with small calcifications at
percutaneous B-mode US (a, arrows) which generate typically
twinkling artifacts at color-Doppler mode (b, arrows)
88
S. Rickes, H. Neye
Fig. 7.12 Late-stage chronic pancreatitis at transabdominal US.
The pancreatic duct is dilated (5 mm) and shows an irregular
course. For better delineation the linear probe is used
Fig. 7.13 Early-stage chronic pancreatitis at transabdominal US.
The pancreatic duct (arrow) is not dilated but shows an irregular
course. For better delineation the linear probe is used
flecting granular interface such as pancreatic calcifications [27]. The demonstration of pancreatic calcifications may be improved by the use of harmonic imaging
and high resolution US, by using high US beam frequency, increasing US diagnostic accuracy [15]. Intraductal plugs with little or no calcium carbonate deposits
appear at US as echoic spots almost without posterior
shading (Fig. 7.8). The high spatial and contrast resolution of current US systems allow an accurate identification of pancreatic microcalcifications and microdeposits. Intraductal deposits such as plugs (Fig. 7.8) if
not yet calcified can be better identified by means of
the US than the CT study.
A further important sign of chronic pancreatitis is
the dilatation of the main pancreatic duct of more than
3 mm [28, 29] (Fig. 7.12). However, in chronic pancreatitis the main pancreatic duct can also be not yet
dilated but irregular in course (Fig. 7.13). Former studies have found that for the sonographic diagnosis of
chronic pancreatitis pancreatic duct dilation is the most
easily identified sign with a sensitivity of about 60%–
70% and a specificity of about 80%–90% [28, 29].
Focal pancreatitis typically involves the pancreatic
head [23]. The differentiation of mass-forming pancreatitis from ductal adenocarcinomas is notoriously problematic due to their similar patterns [12]. Mass-forming
pancreatitis usually occurs in patients with a history of
chronic pancreatitis and must be differentiated from
pancreatic ductal adenocarcinoma. The differential diagnosis with a neoplastic disease may be difficult due
to the very similar US features, presenting in most
cases as a hypoechoic mass, and also because mass-
forming pancreatitis and pancreatic cancer may present
with the same symptoms and signs [12]. The presence
of small calcifications at US in the lesion may suggest
its inflammatory nature, but this is low in specificity
[12]. For diagnosis, biopsy is often mandatory. In many
cases fine needle aspiration (FNA) or biopsy is in fact
still necessary and can be US-guided either percutaneously or endoscopically.
CEUS can improve the differential diagnosis between
mass-forming pancreatitis and pancreatic adenocarcinoma [30]. In particular, while ductal adenocarcinoma
remains hypoechoic in all contrast-enhanced phases, due
to its intense desmoplastic reaction with poor mean vascular density of the lesion, the inflammatory mass shows
parenchymal enhancement in the early contrast-enhanced
phase [12, 30]. The CEUS finding consistent with an inflammatory origin is therefore the presence of parenchymal enhancement similar to that of the adjacent pancreas
during the dynamic study. The intensity of this parenchymal enhancement is related to the length of the underlying
inflammatory process. It has been observed that, the
more the inflammatory process is chronic and longstanding, the less intense is the intralesional parenchymal
enhancement, probably in relation to the entity of the
associated fibrosis. As opposed to this, in mass-forming
pancreatitis of more recent onset the enhancement is
usually more intense and prolonged [31-34].
Autoimmune pancreatitis is a rare cause of recurrent
acute or chronic pancreatitis. It is characterized by
periductal inflammation, caused by infiltration of lymphocytes and plasma cells, with evolution to fibrosis
[35, 36]. In most cases, the echogenicity is reduced
7 Pancreatitis and Pseudocysts
Fig. 7.14 Autoimmune pancreatitis at transabdominal ultrasound
with focal enlargements of the pancreatic gland (red arrows) and
compression of the pancreatic duct (white arrows)
(Fig. 7.14), the gland volume shows focal (Fig. 7.14)
or diffuse (sausage-like) enlargement, and the pancreatic duct may be compressed by glandular parenchyma
(Fig. 7.14). US findings are characteristic in the diffuse
form when the entire gland is involved. In the focal
form US features are less characteristic and very similar
to those of mass-forming chronic pancreatitis. Focal
autoimmune pancreatitis at the pancreatic head is often
characterized by the dilation of the common bile duct
alone [37]. The vascularization of autoimmune pancreatitis can be demonstrated at CEUS showing relatively intense parenchymal enhancement. CEUS of autoimmune pancreatitis shows fair and often from
moderate to marked enhancement in the early contrastenhanced phase, though inhomogeneous [37]. The
CEUS findings may be especially useful in the study
of focal forms of autoimmune chronic pancreatitis, in
which differential diagnosis with ductal adenocarcinoma is a priority [30].
7.4
Pseudocysts
Pseudocyst of the pancreas is a fluid collection that
contains pancreatic enzymes, surrounded by a fibrotic
wall with no epithelial layer. They are caused by pancreatic ductal disruption following increased luminal
pressure, either due to stenosis or calculi obstructing
the ductal system, or as a result of parenchymal necrosis. Pseudocysts complicate the course of pancreatitis
in 30% to 40% [38], appearing 3-6 weeks or longer
following fluid collection organization [15].
At US a pseudocyst is seen as a sharply delineated
89
Fig. 7.15 Pancreatic pseudocyst at transabdominal US
and anechoic lesion with distal acoustic enhancement,
and it is typically oval or round (Fig. 7.15). Sometimes
it may have inclusions (debris), thus simulating a cystic
tumor (e.g. cystadenoma or cystadenocarcinoma). Only
if there is a history of acute or chronic pancreatitis or
there are imaging signs of chronic pancreatitis can the
diagnosis of pseudocysts be considered. Pseudocysts
must be differentiated from pancreatic cystic tumors,
especially mucinous cystadenoma, as they require completely different therapeutic approaches. CEUS can improve the differential diagnosis between pseudocysts
and cystic tumors [39, 40]. Differential diagnosis between pseudocysts and cystic tumors of the pancreas is
more reliable thanks to the evaluation of the vascularity
of intralesional inclusions. Even if characterized by an
inhomogeneous content at US, all the inclusions in
pseudocysts are always completely avascular, becoming
homogeneously anechoic during CEUS examination
[40]. In fact, in contrast to CT and MRI the results of
the CEUS study of a pseudocyst may be different. Harmonic microbubble-specific software filter all the background tissue signals during CEUS examination and
this makes the examination accurate for distinguishing
debris from tumoral vegetations. Therefore the accuracy
of CEUS in the diagnosis of pseudocyst is high [39].
The wall of the pseudocysts may be more or less vascular at imaging and also at CEUS [39, 40].
Pseudocyst may be followed up if small in size and
if not complicated and without involvement of adjacent
structures. Otherwise drainage or surgical treatments
have to be considered. The surgical approach is recommended if an open communication between the
pseudocyst and the ductal system exists.
90
S. Rickes, H. Neye
pancreaticus. An additional issue is whether bleeding
is caused by erosion of a vessel wall or because of rupture of a pseudoaneurysm. The splenic artery appears
to be the most common artery involved with major
bleeding (Fig. 7.17). Helpful information can be obtained by Doppler US [43, 44].
References
Fig. 7.16 Pancreatic pseudocyst within the wall of the duodenum
at transabdominal US
Fig. 7.17 Pseudoaneurysm of the splenic artery. With colorDoppler sonography blood flow can be appreciated within the
pseudocyst
Pancreatic pseudocysts can involve adjacent organs
[14] and the duodenum (Fig. 7.16), stomach and colon.
Furthermore, fistulas between pseudocysts and the bile
duct system have been reported [41].
The identification of small cystic formations in a
thickened duodenal wall on the pancreatic side is however a specific finding for cystic dystrophy of the duodenal wall [42]. Cystic dystrophy of the duodenal wall
and groove pancreatitis are in a border site (groove region) between the pancreas and duodenum, a site that
can be correctly evaluated with EUS.
Bleeding is a further severe complication due to erosion and may occur into the pseudocyst or into the gastrointestinal tract or peritoneal cavity. When bleeding
occurs into the pseudocyst, the cyst changes in
echogenicity and may enlarge causing pain and pressure
effects or blood may pass through the main pancreatic
duct into the duodenum, which is known as hemosuccus
1. Rickes S, Uhle C (2009) Advances in the diagnosis of acute
pancreatitis. Postgrad Med J 85:208-212
2. Balthazar EJ (1989) CT diagnosis and staging of acute pancreatitis. Radiol Clin North Am 27:19-37
3. Uhl W, Warshaw A, Imrie C et al (2002) IAP Guidelines for
the surgical management of acute pancreatitis. Pancreatology
2:565-573
4. Balthazar EJ, Freeny PC, van Sonnenberg E (1994) Imaging
and intervention in acute pancreatitis. Radiology 193:297-306.
5. Rickes S, Treiber G, Mönkemüller K, et al (2006) Impact of
operators experience on value of high-resolution transabdominal
ultrasound in the diagnosis of choledocholithiasis: A prospective
comparison using endoscopic retrograde cholangiography as
gold standard. Scand J Gastroenterol 41:838-843
6. de Lédinghen V, Lecesne R, Raymond JM et al (1999) Diagnosis of choledocholithiasis: EUS or magnetic resonance
cholangiography? A prospective controlled study. Gastrointest Endosc 49:26-31
7. Soto JA, Barish MA, Alvarez O, Medina S (2000) Detection
of choledocholithiasis with MR cholangiography: Comparison of three dimensional fast spin-echo and single- and multisection half-Fourier rapid acquisition with relaxation enhancement sequences. Radiology 215:737–745
8. Moo JH, Cho YD, Cha SW et al (2005) The detection of bile
duct stones in suspected biliary pancreatitis: comparison of
MRCP, ERCP, and intraductal US. Am J Gastroenterol
100:1051-1057
9. Rickes S, Uhle C, Kahl S et al (2006) Echo-enhanced ultrasound: a new valid initial imaging approach for severe acute
pancreatitis. Gut 55:74-78
10. Rickes S, Mönkemüller K, Malfertheiner P (2007) Acute severe pancreatitis: contrast-enhanced sonography. Abdom Imaging 32:362-364
11. Rickes S, Rauh P, Uhle C et al (2007) Contrast-enhanced
sonography in pancreatic diseases. Eur J Radiol 64:183-188
12. D´Onofrio M, Zamboni G, Faccioli N et al (2007) Ultrasonography of the pancreas. 4. Contrast-inhanced imaging.
Abdom Imaging 32:171-181
13. Ripollés T, Martínez MJ, López E et al (2010) Contrast-enhanced ultrasound in the staging of acute pancreatitis. Eur
Radiol 20:2518-2523
14. Procacci C (2002) Non-traumatic abdominal emergencies:
imaging and intervention in acute pancreatic conditions. Eur
Radiol 12:2407–2434
15. Balthazar EJ (ed) (2009) Imaging of the pancreas. Acute
and chronic pancreatitis. Springer, Berlin
16. Laws HL, Kent RB III (2000) Acute pancreatitis: management of complicating infection. Am Surg 66:145–152
17. Dörffel T, Wruck T, Rückert RI et al (2000) Vascular com-
7 Pancreatitis and Pseudocysts
18.
19.
20.
21.
22.
23.
24.
25.
26.
27.
28.
29.
30.
31.
plications in acute pancreatitis assessed by color duplex ultrasonography. Pancreas 21:126-33
Kinney TP, Freeman ML (2008) Recent advances and novel
methods in pancreatic imaging. Minerva Gastroenterol Dietol
54:85-95
Choueiri NE, Alkaade S, Burton FR, Balci NC (2010) Advanced imaging of chronic pancreatitis. Curr Gastroenterol
Rep 12:114-120
Aheed JS, Miller F (2007) Chronic pancreatitis: ultrasound,
computed tomography, and magnetic resonance imaging features. Semin Ultrasound CT MR 28:384-394
Kahl S, Glasbrenner B, Leodolter A et al (2002) EUS in the
diagnosis of early chronic pancreatitis: a prospective followup study. Gastrointest Endosc 55:507-511
Rickes S, Böhm J, Malfertheiner P (2006) SonoCT improves on
conventional ultrasound in the visualization of the pancreatic
and bile duct: A pilot study. J Gastroenterol Hepatol 21:552-555
Martinez-Noguera A, D´Onofrio M (2007) Ultrasonography
of the pancreas. 1. Conventional imaging. Abdom Imaging
32:136-149
Bolondi L, Priori P, Gullo L et al (1987) Relationship between
morphological changes detected by ultrasonography and pancreatic exocrine function in chronic pancreatitis. Pancreas
2:222-229
Homma T, Harada H, Koizumi M (1997) Diagnostic criteria
for chronic pancreatitis by the Japan Pancreas Society. Pancreas 15:14-15
Ring EJ, Eaton SB, Ferrucci JT, Short WF (1973) Differential
diagnosis of pancreatic calcification. Am J Roentgenol Radium Ther Nucl Med 117:446–452
Kim HC, Yang DM, Jin W et al (2010) Color Doppler twinkling artifacts in various conditions during abdominal and
pelvic sonography. J Ultrasound Med 29:621-632
Niederau C, Grendell JH (1985) Diagnosis of chronic pancreatitis. Gastroenterology 88:1973–1995
Hessel ST, Siegelman SS, McNeil BJ et al (1982) A prospective evaluation of computer tomography and ultrasound of
the pancreas. Radiology 143:129–133
D’Onofrio M, Zamboni G, Tognolini A et al (2006) Massforming pancreatitis: value of contrast-enhanced ultrasonography. World J Gastroenterol 12:4181-4184
Rickes S, Unkrodt K, Neye H et al (2002) Differentiation of
pancreatic tumours by conventional ultrasound, unenhanced
91
32.
33.
34.
35.
36.
37.
38.
39.
40.
41.
42.
43.
44.
and echo-enhanced power Doppler sonography. Scand J Gastroenterol 37:1313-1320
Rickes S, Unkrodt K, Wermke W et al (2000) Evaluation of
Doppler sonographic criteria for the differentiation of pancreatic tumours. Ultraschall in Med 20:253–258
Rickes S, Mönkemüller K, Malfertheiner P (2006) Contrastenhanced ultrasound in the diagnosis of pancreatic tumors. J
Pancreas 7:584-592
Rickes S, Unkrodt K, Ocran K et al (2003) Differentiation
of neuroendocrine tumours from other pancreatic lesions by
echo-enhanced power Doppler sonography and somatostatin
receptor scintigraphy. Pancreas 26:76-81
Neuzillet C, Lepère C, El Hajjam M et al (2010) Autoimmune
pancreatitis with atypical imaging findings that mimicked
an endocrine tumor. World J Gastroenterol 21:2954-2958
Khan KJ (2010) Prevalence, diagnosis, and profile of autoimmune pancreatitis presenting with features of acute or
chronic pancreatitis. Clin Gastroenterol Hepatol 8:639-640
Numata K, Ozawa Y, Kobayashi N et al (2004) Contrast enhanced sonography of autoimmune pancreatitis. Comparison
with pathologic findings. J Ultrasound Med 23:199-206
Habashi S, Draganov PV (2009) Pancreatic pseudocyst.
World J Gastroenterol 15:38-47
Rickes S, Wermke W (2004) Differentiation of cystic pancreatic neoplasms and pseudocysts by conventional and
echo-enhanced ultrasound. J Gastroenterol Hepatol 19:761766
D’Onofrio M, Barbi E, Dietrich C et al (2011) Pancreatic
multicenter ultrasound study (PAMUS). Eur J Radiol
doi:10.1016/j.ejrad.2011.01.053
Rickes S, Mönkemüller K, Peitz U et al (2006) Sonographic
diagnosis and endoscopic therapy of a biliopancreatic fistula
complicating a pancreatic pseudocyst. Scand J Gastroenterol
41:989-992
Procacci C, Graziani R, Zamboni G et al (1997) Cystic dystrophy of the duodenal wall: radiologic findings. Radiology
205:741–747
Rickes S, Kolfenbach S, Kahl S, Malfertheiner P (2004)
Gastrointestinal bleeding and pancreatic pseudocysts. J Gastroenterol Hepatol 19:711
Rickes S, Mönkemüller K, Venerito M, Malfertheiner P
(2006) Pseudoaneurysm of the splenic artery. Dig Surg
23:156–158
8
Solid Pancreatic Tumors
Christoph F. Dietrich, Michael Hocke, Anna Gallotti
and Mirko D’Onofrio
8.1
Introduction
Diagnostic imaging plays a crucial role in the study of
pancreatic tumors, with the primary aims being their
correct detection and characterization [1, 2]. A further
accurate staging is of fundamental importance for treatment planning. Ultrasonography (US) is often the noninvasive imaging modality chosen for the first evaluation of the pancreas, as it is inexpensive, easy to perform
and widely available [3]. The more precise and accurate
the initial evaluation, the more appropriate the management of the patient will be. In recent decades, the
introduction of new technologies has improved the image quality of conventional imaging with very high
spatial and contrast resolution [4-6]. Adenocarcinoma
is the most common primary malignancy of the pancreas, thus each single pancreatic solid mass detected
at US has a high probability of being an adenocarcinoma. Otherwise not all the solid pancreatic masses
detected at US are adenocarcinoma [7]. Therefore improving the US capability for the characterization and
differential diagnosis will lead to both a faster diagnosis
of ductal adenocarcinoma and a more accurate differential diagnosis in respect to other pancreatic tumor
histotypes or non-neoplastic mass-forming conditions.
This chapter is focused on the actual possibility of
detection and characterization, considering the most
clinically relevant differential diagnoses, and staging
of pancreatic ductal adenocarcinoma by means of US.
C.F. Dietrich ( )
Department of Clinical Medicine
Caritas-Krankenhaus, Bad Mergentheim, Germany
e-mail:
8.2
Pathology and Epidemiology
Ductal adenocarcinoma is the most common primary
malignancy of the pancreas, accounting for 80% of malignant pancreatic tumors and almost three-fourths of
all pancreatic cancers [8-10]. Macroscopically, pancreatic ductal adenocarcinoma is a white-yellow and firm
mass owing to the presence of fibrosis and desmoplasia,
with infiltration of the ductal epithelium [7]. Microscopically, it is composed of infiltrating glands surrounded by dense and reactive fibrous tissue [11]. The
presence of intratumoral fibrosis and necrosis, typical
for highly aggressive types with a reduction in the microvascular density and in perfusion, the presence of
perineural invasion and distant metastases (commonly
in the liver, lungs, peritoneum and adrenal glands) predict
a worse survival [9, 10, 12-14].
In more than 95% of cases, regardless of the site of
localization, pancreatic ductal adenocarcinoma is diagnosed at an advanced stage, with locally advanced
or metastatic disease requiring palliative therapy [1214]. Only 10 to 20% of patients are candidates for surgery [11]. The prognosis and the treatment approach
are based on whether the tumor is resectable or non-resectable at presentation, which is mostly dependent on
the time of diagnosis [2].
8.3
Adenocarcinoma
8.3.1
Detection
The detection of a pancreatic ductal adenocarcinoma at
transabdominal US is basically related to both explo-
M. D’Onofrio (ed.), Ultrasonography of the Pancreas, © Springer-Verlag Italia 2012
93
94
a
C.F. Dietrich et al.
b
c
Fig. 8.1 a-c Small pancreatic adenocarcinoma. US (a) incidental detection of a small hypoechoic nodule (arrow) in the uncinate
process of the pancreas appearing hypovascular (arrow) at CEUS (b) with final diagnosis of small ductal adenocarcinoma (arrow)
at pathology (c)
a
b
Fig. 8.2 a,b Small pancreatic adenocarcinoma. US (a) direct identification of a ductal adenocarcinoma of the pancreatic body appearing hypoechoic (arrow), but isoattenuating (arrow) at CT (b)
ration of the pancreatic region and conspicuity of the
lesion in terms of size and echogenicity. Good visualization of the gland, which is difficult in the presence of
tympanites or in obese patients, can be achieved by applying compression with the probe. Filling the stomach
with water is not useful and makes compression more
difficult. Moreover air bubbles are ingested together
with the water generating artifacts. Patient position is
also important. Changing the patient decubitus, such as
on the left or right flank or in orthostasis, can provide a
good visualization of the pancreatic region. These operations take time but very often a good result can be
obtained [3, 15, 16]. On the other hand, a good conspicuity of the lesion is almost always instantaneous at
US [1]. The high spatial resolution makes the US examination able to detect even very small pancreatic adenocarcinoma (Fig. 8.1). In fact, it has been argued that
acoustic impedance of ductal adenocarcinoma is very
low, with a significant difference between the lesion
and the pancreatic adjacent parenchyma always present
[3]. This is the reason why the adenocarcinoma is usually
markedly hypoechoic with respect to the pancreas (Fig.
8.2). Moreover this difference in impedance between
the lesion and the adjacent parenchyma is sometimes
greater than that observed at CT between beam attenuation in both pre- and post-contrast enhancement phases
[3, 17, 18]. This could be experimentally proved by
measuring and comparing the difference in echogenicity
in respect to Hounsfield Units (HU) of the same lesion
(Fig. 8.3) and explain some results already reported in
the literature [17]. Pancreatic lesions are detectable at
CT if a difference of 10-15 HU exists [18]. It has been
reported that up to 11% of pancreatic adenocarcinoma
at CT show no difference in attenuation compared to
the surrounding pancreatic tissue, the so-called isoattenuating pancreatic adenocarcinoma [19-21]. Yoon et
al. [20] reported that 27% of small (≤20 mm) pancreatic
adenocarcinoma are isoattenuating at CT so not directly
8 Solid Pancreatic Tumors
95
a
b
c
d
Fig. 8.3 a-d Pancreatic adenocarcinoma. a,b High difference in echogenicity between the pancreatic head lesion appearing
hypoechoic (ROI in a) with respect to the pancreatic body (ROI in b). c,d Low difference in Hounsfield unit of the same lesion (ROI
in c) with respect to the body-tail (ROI in d)
visible without the use of some secondary signs. But
direct visualization (Fig. 8.2) is essential for the assessment of tumor dimensions and local staging. Moreover
small well-differentiated pancreatic adenocarcinomas,
which are associated with a better survival rate after resection, are isoattenuating in more than 50% of cases
[20, 22]. Magnetic resonance imaging (MRI) and
PET/CT, but also US (Figs. 8.2, 8.3) and contrast-enhanced ultrasound (CEUS) (Fig. 8.4), may be useful
for detecting the lesion invisible at CT or if CT findings
are inconclusive or when the patient is only suspected
of having the lesion at CT [21]. In these cases in fact a
simple US can cover the role of problem solving, in the
same examination session, as the lesion can usually be
immediately detected owing to its hypoechoic appearance and better conspicuity (Figs. 8.2-8.4) [17]. Hence
the integration of different imaging modalities is sometimes better for tumor detection yet in the first examination session to gain faster diagnosis [1].
The sensitivity and specificity of US in the detection
of pancreatic adenocarcinoma varies in the medical literature, owing to the obvious impact of operator experience on the results. The mean sensitivity ranges from
72% to 98%, lower than that reported for CT, whereas
specificity exceeds 90% [8, 17, 23, 24].
Regarding size, tumors smaller than 1 cm and limited
to the ductal epithelium are considered early pancreatic
duct adenocarcinoma [25, 26]. The imaging method with
the highest possible resolution to visualize pancreatic tumors is endoscopic ultrasound (EUS), which takes advantage of the direct exploration of the gland [27-31].
Consequently all the described aspects of US detection of
96
a
C.F. Dietrich et al.
b
c
d
Fig. 8.4 a-d Pancreatic adenocarcinoma. US (a) direct identification of a ductal adenocarcinoma of the pancreatic neck appearing
hypoechoic next to the superior mesenteric vein (blue) and hypoenhancing (arrow) at CEUS (b). Diagnosis of adenocarcinoma confirmed at pathology (c). The tumor is isoattenuating at CT (d)
pancreatic adenocarcinoma give better results. Tumors
even smaller than 5 mm can be detected [8]. However,
EUS cannot be used as a screening imaging method because of its mini-invasive approach. In addition, the procedure is complex to perform and different results have
been reported in the literature, also in this case strongly
correlated with the experience of the investigator [32, 33].
Even though the detection of pancreatic adenocarcinoma is a crucial point, most of the up to date diagnostic
imaging methods show good sensitivity in an otherwise
unchanged gland. The real problem for the differential
diagnosis arises when the pancreatic tissue shows inflammatory changes. In comparative studies, the specificity of the major diagnostic tools are as low as 6080%, not enough to guide clinical decisions [27]. Thus,
the main efforts nowadays should focus on appropriate
selection of the patient population at risk of developing
pancreatic cancer requiring adequate diagnostic methods
rather than increasing resolution of the imaging method.
At US, pancreatic adenocarcinoma almost always
presents as a solid and markedly hypoechoic mass (Fig.
8.5) in comparison to the adjacent pancreatic parenchyma
due to the very low US acoustic impedance of the tumor
[3]. The main pancreatic duct is often infiltrated and dilated upstream. A tumor located in the pancreatic head
also determines the dilation of the common bile duct
(double-duct sign) [34, 35]. Thus, the identification of
duct dilation with abrupt cutoff has to be considered a
secondary sign suspicious of pancreatic cancer. Moreover
due to the fact that the most common pancreatic tumor
is the adenocarcinoma and most of them are localized in
the head of the gland, a dilated pancreatic duct with
abrupt cutoff is the most important sign for early detection even if the tumor itself cannot be visualized [36].
As a consequence, patients with unexplained dilatation
of the pancreatic duct with abrupt cutoff should be referred to more specific imaging methods.
The newer US applications able to evaluate tissue
stiffness could be used in the near future also to detect
pancreatic lesions not visible at conventional US based
on differences in acoustic impedance with respect to
the adjacent parenchyma (Fig. 8.6).
8 Solid Pancreatic Tumors
97
a
b
c
d
e
Fig. 8.5 a-e Pancreatic adenocarcinoma. US: hypoechoic pancreatic head mass (a). CEUS: hypovascular pancreatic head mass (b).
Pathology: adenocarcinoma of the pancreas with marked desmoplasia (c), high fibrous changes (d) and low mean vascular density
(e) at CD34 immunohistochemical staining
Fig. 8.6 Small focal pancreatic lesion. Isoechoic small pancreatic
focal lesion detected at ARFI US imaging
8.3.2
Characterization and Differential
Diagnosis
Pancreatic adenocarcinoma, as previously reported, typically presents at conventional US as a solid hypoechoic
lesion with upstream dilation of the main pancreatic
duct. The tumor is characterized by infiltrative margins
and early diffusion of the tumor in the adjacent
parenchyma and structures, justifying the often lack of
clear-cut margins at US [1, 3]. As a result, sometimes
the lesion can be difficult to identify or delineate. Harmonic US and compound techniques may improve the
correct identification of the margins of the tumor [4].
The double duct sign can be observed in the presence
of lesions located in the pancreatic head [34]. In highly
aggressive form, necrosis and liquefaction are common,
resulting from the difference between tumor growth
rate and formation of new microvessels from neoangiogenesis [1]. The necrotic/liquid part of the tumor is
mainly located centrally.
Real-time elastography [Hitachi Medical Systems,
Tokyo, Japan] is a real-time technique able to improve
the differential diagnosis between pancreatic lesions,
displaying the mechanical hardness of examined tissues
thus providing important additional information [31,
37, 38]. Basically, as a result of marked desmoplasia
which is very often present in pancreatic adenocarci-
98
a
C.F. Dietrich et al.
b
c
Fig. 8.7 a-c Small pancreatic adenocarcinoma. US incidental detection of a pancreatic small stiff (black) hypoechoic nodule at
ARFI imaging (a) with high wave velocity value (Vs=3.54) at ARFI quantification (b) in respect to the normal adjacent pancreatic
parenchyma (c)
a
b
c
Fig. 8.8 a-c Dynamic study using high and low mechanical index (MI) CE-EUS and endoscopic elastography of pancreatic adenocarcinoma. a Elastography of a pancreatic carcinoma, the dense structure of the carcinoma is shown in blue codification of the elastography.
b Only few vessels are visible using high MI CE-EUS in color-Doppler mode. c Poor enhancement of the lesion using low MI CE-EUS
a
b
Fig. 8.9 a,b Pancreatic adenocarcinoma. Hypoechoic pancreatic head mass (arrow) without intralesional vascular signals at colorDoppler examination (a) appearing typically markedly hypovascular, hypoenhancing (arrow) at CEUS (b)
noma, the tumor appears stiff at transabdominal (Fig.
8.7) and endoscopic (Fig. 8.8) elastographic evaluation
[1, 39, 40]. The quantitative analysis i.e. by means of
Virtual touch tissue quantification (Siemens, Erlangen,
Germany), makes the results more objective and reproducible. The wave velocity value measured inside a
pancreatic ductal adenocarcinoma is higher (usually
>3 m/s; Fig. 8.7) than that in the adjacent parenchyma
(mean value in the healthy pancreas of 1.4 m/s) [1, 6].
At Doppler study, the detection of tumor vessels
within the lesion often characterizes hypervascular
masses (i.e. endocrine tumors), while no tumor vessels
are usually observed within hypovascular ones, such
as pancreatic ductal adenocarcinoma (Fig. 8.9) [5, 41].
8 Solid Pancreatic Tumors
99
Table 8.1 Accuracy of hypoenhancement as a sign of ductal adenocarcinoma
Hypoenhancemement as a sign of adenocarcinoma
Hyperenhancement as a sign of non-adenocarcinoma
Sensitivity [%] Specificity [%] PPV [%]
90.0
100
100
(80.5-95.9)
(91.6-100)
(94.3-100)
100
90.0
85.7
(91.6-100)
(80.5-95.9)
(72.8-94.1)
The introduction of contrast agents has significantly
strengthened US, increasing the accuracy of the firstline examination in the characterization of pancreatic
tumors (especially pancreatic adenocarcinoma) [12, 4245]. To discriminate between the most common focal
pancreatic lesions, transabdominal and EUS studies
with contrast agents achieve similar results [1, 46-48].
Ductal adenocarcinoma shows poor enhancement
in all phases at transabdominal (Figs. 8.1, 8.5, 8.9) and
contrast-enhanced EUS (CE-EUS) (Fig. 8.8). In fact
the mean vascular density (MVD) is low and often inferior to the normal pancreatic parenchyma [12, 49,
50]. The marked desmoplasia (Fig. 8.5) and the low
MVD of the lesion, together with the presence of necrosis or mucin justify the typical imaging features [12].
So at CEUS ductal adenocarcinoma typically presents
as a hypoenhancing mass (Figs. 8.5, 8.9) compared to
the adjacent parenchyma. This pattern is present in
about 90% of cases [43, 51, 52]. As reported in the PAMUS multicenter study (Pancreatic Multicenter Ultrasound Study) among the 987 adenocarcinomas included, 891 (90%) were hypovascular [52]. In a
personal series of 112 solitary undetermined pancreatic
masses, the hypoenhancemement as a sign of ductal
adenocarcinoma showed a sensitivity of 90%, specificity of 100% and an accuracy of 93.8% (Table 8.1).
The MVD of pancreatic adenocarcinoma is influenced by different degrees of tumor differentiation. It
has been shown that the enhancement pattern at CEUS
correlates with tumor differentiation, aggressiveness
and prognosis [12]. In particular, a markedly hypovascular pattern with avascular intratumoral areas identifies
undifferentiated adenocarcinoma. And for this reason,
this pattern of enhancement appears as a useful parameter for preoperative prognostic stratification. Moreover,
CEUS can demonstrate changes in tumor vascularity
during chemotherapy, raising the hope for a future application in clinical practice [49, 53].
Moreover, during CEUS examination tumor margins
and size are better visible (Fig. 8.10), as well as the relations with peripancreatic arterial and venous vessels
NPV [%] Accuracy [%]
85.7
93.8
(72.8-94.1) (87.6-97.5)
100
93.8
(94.3-100) (87.6-97.5)
Fig. 8.10 Pancreatic adenocarcinoma. Pancreatic head mass hypoechoic at US (right) and hypoenhancing at CEUS (left) with
different dimension (diameter 1 vs 2) at the two examinations
for local staging and presence of metastatic lesions for
liver staging [1, 44, 45, 54, 55].
Compared to US, CEUS can also improve the differential diagnosis between mass-forming pancreatitis
and pancreatic adenocarcinoma. In particular, while
ductal adenocarcinoma remains hypoenhanced during
all the dynamic phases, the inflammatory mass shows
a parenchymal enhancement, as reported by published
data from the Verona group [56]. The presence of a
parenchymal enhancement somewhat similar to that of
the adjacent pancreas during the dynamic study is therefore a CEUS finding consistent with an inflammatory
origin. The intensity of this parenchymal enhancement
is related to the length of the underlying inflammatory
process [57]: the more chronic and long-standing the
inflammatory process, the less intense the intralesional
parenchymal enhancement. It is likely that this is related
to the entity of the associated fibrosis. In contrast, in
acute mass-forming pancreatitis the enhancement is
usually more intense and prolonged [56].
It can be concluded that the use of CEUS can increase the differential diagnosis between pancreatic lesions by far and should be recommended in patients
with a visualization of the gland at US. Contrast enhanced transabdominal and EUS are nowadays reported
100
C.F. Dietrich et al.
a
b
Fig. 8.11 a,b Local staging of pancreatic adenocarcinoma. a US local staging of a hypoechoic pancreatic head mass (T) infiltrating
the superior mesenteric vein (arrow) with focal disappearance of the echoic interface between the tumor and the lumen of the vessel.
b Intraoperative confirmation of a neoplastic tangential infiltration of the superior mesenteric vein
a
b
Fig. 8.12 a,b Local staging of pancreatic adenocarcinoma. a Color-Doppler US local staging of a hypoechoic pancreatic head mass
(T) infiltrating the superior mesenteric vein (colored) with typical teardrop deformation. b Color-Doppler US local staging of a hypoechoic pancreatic head mass (T) infiltrating the superior mesenteric artery (colored)
in the literature as valuable imaging methods for the
characterization of pancreatic lesions.
In summary, at CEUS examination pancreatic ductal
adenocarcinoma usually presents as an ill-defined mass,
showing poor enhancement in all dynamic phases. So
a solid hypovascular pancreatic mass at CEUS has to
be considered a ductal adenocarcinoma until proven
otherwise.
8.3.3
Local and Liver Staging
The pancreatic study must include the evaluation of
the adjacent vascular structures, mainly to distinguish
between resectable and non-resectable lesions. The preserved echogenic fatty interface between tumor and
vessels or a short contiguity between them suggest the
resectability of the lesion, whereas the infiltration or
compression or encasement imply unresectability, especially from an oncologic point of view [17, 58-61].
At conventional US, the vascular invasion is defined
by a focal disappearance of the echogenic interface
(Fig. 8.11) forming the vessel wall, or by a narrow lumen [1]. In cases of pancreatic head tumor, the simple
evaluation of the site of potential resection for a duodenopancreatectomy can immediately indicate unresectability. In particular, if the dilated pancreatic duct
stops at the same level as the superior mesenteric vein
the pancreatic neck can be involved making pancreatic
resection unsafe at this level.
To improve the visualization of tumor margins and
8 Solid Pancreatic Tumors
a
101
b
Fig. 8.13 a,b Local staging of pancreatic adenocarcinoma. a Doppler based US imaging of a hypoechoic head-uncinate process
pancreatic mass (T) infiltrating the superior mesenteric vein with millimetric focal disappearance (arrow) of the echoic interface between the tumor and the lumen of the vessel. b Confirmation on the specimen of the focal tumoral infiltration resulting in a
millimetric interruption (arrow) of the surface for the superior mesenteric vein
vessel walls, harmonic, compound and Doppler-based
imaging can be used; the aim is not only to gain the best
visualization of the tumor margins but also to gain a
better evaluation of the relationship between them and
major peripancreatic vessels (Fig. 8.12). At harmonic
and compound imaging the conspicuity of the lesion is
increased with a better delineation of the tumor, while
some Doppler based imaging such as Clarify Vascular
Enhancement (Acuson, Siemens) enhances the B-mode
display with information derived from power-Doppler,
clearly differentiating vascular anatomy from acoustic
artifacts and surrounding tissue (Fig. 8.13) [59, 62].
At Doppler, localized aliasing and mosaic pattern are
waveform changes due to increased flow velocities and
turbulent blood flow at the site of a vascular stenosis,
due to the presence of a pancreatic lesion involvement,
which can be confirmed with duplex Doppler interrogation [60, 61]. Downstream from the infiltrated tract the
flow velocity decreases, with the typical parvus et tardus
waveform [17]. However, these hemodynamic changes
usually occur in advanced tumors only, when vascular
involvement is usually obvious at grey scale as well.
Color-Doppler has contributed to assessing the involvement of the major peripancreatic arteries and of the portal
venous system. The arterial infiltration of the tumor can
involve the superior mesenteric, the splenic, celiac, hepatic
and left renal arteries, in descending order of frequency.
Venous involvement can affect the superior mesenteric,
splenic, portal and left renal veins. In the presence of tumor encasement of the superior mesenteric vein, changes
in blood flow velocity at Doppler study can be detected.
However, a normal waveform does not exclude infiltration
of the superior mesenteric and portal veins [1].
Several studies have evaluated the role of colorDoppler in assessing the arterial involvement by pancreatic cancer, suggesting its accuracy greater than grayscale US [5, 17, 58-60]. In fact, color-Doppler US allows
recognition of vessels that are barely visible with grey
scale US because of small caliber or deep location.
Combining grey scale and color-Doppler US, sensitivity, specificity, and overall accuracy of 79%, 89%,
and 84% have been reported for the diagnosis of vascular involvement from pancreatic tumor [5]. When involvement of the portal vein is considered, sensitivity,
specificity and overall accuracy of 74%, 95%, and 89%
have been reported [60]. When in contrast only peripancreatic arteries are considered, sensitivity of 60%,
specificity of 93% and overall accuracy of 87% were
found [63]. Most false negative results occur in patients
with limited venous involvement of the portal-mesenteric junction [5].
New technologies that use digitally encoding techniques to suppress tissue clutter and improve sensitivity
for direct visualization of blood reflectors have been
developed such as Bflow imaging (GE Medical Systems
Co., Milwaukee, WI, USA) and eflow imaging (Aloka,
Tokyo, Japan) [5]. The weak signals from blood echoes
are enhanced and correlated with the corresponding signals of the adjacent frames to suppress non-moving tissues. The rest of the data processing is essentially the
same as in conventional grey-scale imaging. In comparison with Doppler techniques these new US flow
102
C.F. Dietrich et al.
imaging modalities are not affected by aliasing and have
the advantages of a significantly lower angle dependency
and better spatial resolution with reduced overwriting
[64]. As a consequence, evaluation of vessel profiles is
markedly improved.
Usually tumor involvement of adjacent vessels established by means of US and Doppler study can be
confirmed at CEUS. CEUS is reported to be very useful
in establishing non-resectable patients already considered
resectable on primary radiologic image material [65].
Moreover at CEUS, the evaluation of the whole liver
is mandatory after pancreatic study [45, 55]. The late
phase of enhancement, 120 s after bolus injection, is
the best for the detection of metastatic liver lesions and
each solid hypoechoic focal liver lesion detected during
the late phase should be considered a metastasis until
otherwise proven [45, 54, 55].
These tumors are classified as functioning or non(hyper)functioning based on the presence or absence of
symptoms related to hormone production. Insulinomas
and gastrinomas are the most common functioning islet
cell tumors and are usually small at the time of diagnosis [1, 66]. Insulinomas are usually benign and solitary
lesions, while gastrinomas tend to be larger, malignant
and multiple. Nonfunctioning tumors are frequently
large at presentation and often malignant [67].
The diagnosis is usually based on clinical and biochemical work-up. Diagnostic imaging is needed to localize the tumor and to study the relations with vital
structures for potential surgical resection. Abdominal
US can detect only about 60% of isolated islet cell tumors. Better results in tumor detection are reported for
EUS [67].
8.4.1
8.4
Neuroendocrine Tumor
Pancreatic neuroendocrine tumors or islet cell tumors
arise from the neuroendocrine cells of the pancreas.
Functioning
Insulinomas are the most frequently found functioning
neuroendocrine tumor of the pancreas (about 60% of
all neuroendocrine tumors) and in the majority of cases
are benign (85-99%) and solitary (93-98%) [3]. Preop-
a
b
c
d
Fig. 8.14 a-d Pancreatic insulinoma. US (a) detection of a small hypoechoic nodule (caliper) with small intralesional vessels at
color-Doppler evaluation (b). At CEUS (c) the nodule is hypervascular hypoenhancing (arrow) in the early dynamic phases.
Resected specimen (d) with final diagnosis of insulinoma
8 Solid Pancreatic Tumors
erative US detection of insulinomas is sometimes difficult but possible. The US detection rate of insulinomas
has steadily increased in recent years, thanks to the increase in spatial, lateral and contrast resolution provided
by technologic developments [68]. The majority of insulinomas appear at US as hypoechoic nodules, usually
capsulated, and hyperenhancing at CEUS (Fig. 8.14).
Sometimes very small calcifications can be present, especially in the larger lesions [66, 67]. At the time of
clinical presentation 50% of the tumors are smaller
than 1.5 cm [68, 69]. When rarely malignant, they are
generally greater than 3 cm and about a third of these
have metastases at the time of diagnosis [3].
Gastrinomas are the second most frequently found
functioning neuroendocrine tumors of the pancreas
(about 20% of all neuroendocrine tumors) and differ
from insulinomas by site, size and vascularity [1, 69,
70]. They occur within the gastrinoma triangle (junction
of the cystic duct and common bile duct – junction of
the second and third parts of duodenum – junction of
the head and neck of the pancreas) of which only the
pancreatic side can be correctly explored by US [3].
Identification of pancreatic gastrinomas can be easy
considering their moderate size. Liver metastases are
present in 60% of cases at the time of diagnosis [69].
The other functioning neuroendocrine tumors
(VIPoma, glucagonoma and somatostatinoma) are rare;
all together they account for about 20% of the functioning neuroendocrine tumors of the pancreas [67-69].
8.4.2
Non(hyper)functioning
Nonfunctioning islet cell tumors (NFETs) account for up
to 33% of the neuroendocrine tumors of the pancreas
ranging from 1 to 20 cm in diameter and showing a high
malignancy rate, up to 90% [7]. They are, however, less
aggressive than ductal adenocarcinoma. The clinical presentation of NFETs is nonspecific being due to the mass
effect. In fact, these tumors, predominantly characterized
by expansive growth, are clinically silent until adjacent
viscera and structures are involved [67]. At US they
appear well marginated and usually easy to detect thanks
to their large size which justify their tendency to necrosis
and hemorrhage giving them a typical nonhomogeneous
appearance, sometimes with very small internal calcifications [4, 66, 71]. Larger nonfunctioning islet cell tumors
show cystic degeneration or cystic change [69]. A wellorganized relationship between neoplastic cells and
neovessels travelling into the tumor stroma exists and
103
Fig. 8.15 Non hyperfunctionning neuroendocrine tumor. US:
solid hypoechoic mass (N) of the pancreatic body. Color-Doppler
US: small intralesional vessels (arrow). CEUS: hypervascular
mass (*) of the pancreatic body
explains the hypervascular pattern [72]. For this reason
the characterization depends on the demonstration of
their hypervascularity [70-72]. Imaging differential diagnosis between NFETs and ductal adenocarcinoma is
fundamental for therapeutic strategy and prognosis. At
color- and power-Doppler US a spotted pattern can be
demonstrated inside the endocrine tumors [5]. However,
Doppler silence can be present in hypervascular endocrine
tumors because of the small size of the lesion or of the
tumor vascular network [1, 5]. At CEUS different enhancement patterns can be observed in relation to the
size of the tumor and its vessels [42]. NFETs show a
rapid intense enhancement in the early dynamic phases
at transabdominal (Fig. 8.15) and endoscopic (Fig. 8.16)
CEUS, with exclusion of the necrotic intralesional areas,
and microbubble entrapment in the late phase [42, 70].
In moderate-size tumors a capillary blush enhancement
can be present in the early phase, mirroring the most
characteristic angiographic feature of these tumors [72].
Considering that the characterization of NFETs at imaging
is mainly linked to their frequent hypervascularity, a high
sensitivity in the detection of tumor macrocirculation and
microcirculation is required [42, 71]. Last but not least,
nonfunctioning neuroendocrine tumors can be hypovascular [70]. This is directly related to the amount of stroma
inside the lesion which is dense and hyalinized. However,
104
a
C.F. Dietrich et al.
b
c
Fig. 8.16 a-c Dynamic study using high and low mechanical index (MI) contrast-enhanced endosonography and endoscopic elastography of neuroendocrine tumor. a Elastography of a neuroendocrine tumor: the tumor shows a dense structure in relation to the
surrounding pancreas. b High MI CE-EUS: many microvessels are visible using color-Doppler mode. c Low MI CE-EUS: hypervascular appearance of the lesion (arrow) resulting hyperechoic
in some pancreatic neuroendocrine tumors appearing hypodense at dynamic CT, a clear enhancement is visible
at CEUS [70]. The high capability of CEUS in demonstrating pancreatic tumor vascularity is a result of the
high resolution power of the state-of-the-art US imaging,
combined with the size and the distribution (blood pool)
of the microbubbles [1, 30]. CEUS may improve identification and characterization of endocrine tumors allowing
an accurate locoregional and hepatic staging as reported
by Malagò et al. [72]. In the same paper, the authors reported good positive correlation between CEUS pattern
and Ki67 index, which is considered the most reliable
independent predictor of tumor malignancy. A prognostic
stratification based on CEUS evaluation of whole tumor
could therefore be considered.
8.5
Incidental Solid Pancreatic Lesion:
Risk Factor and Management
At conventional US the detection of a solid hypoechoic
mass in the pancreatic gland should be considered a
ductal adenocarcinoma until proven otherwise, so requiring rapid and adequate management. However, US
can occasionally still be not accurate in defining the
solid or cystic nature of the lesion.
CEUS is a safe and feasible imaging method to
better characterize pancreatic lesions immediately after
US detection. At US the detection of a focal pancreatic
lesion requires a first mandatory differentiation between
its solid or cystic nature and CEUS is able to best solve
this task (Fig. 8.17), thus playing a key role in the management of patients.
A solid lesion requires multidetector computed tomography (MDCT) confirmation, while a cystic lesion
Fig. 8.17 CEUS in the work-up algorithm proposed for focal
pancreatic tumors detected at conventional ultrasonography
should be investigated with MRI. Therefore, the injection of contrast agents can improve the accuracy of the
first line investigation. Immediate diagnosis is very important especially when dealing with pancreatic ductal
adenocarcinoma [1].
Pancreatic ductal adenocarcinoma typically shows
poor enhancement during all the dynamic phases.
Therefore, at CEUS the detection of a solid hypoechoic,
hypovascular mass in the pancreatic gland has to be
considered a ductal adenocarcinoma until proven otherwise. After immediate and mandatory CT staging,
surgical treatment can be more rapidly applied.
8 Solid Pancreatic Tumors
8.6
Special Topics
8.6.1
Mean Vascular Density (MVD)
of Solid Tumor and Microvessel
CEUS is the only imaging method able to provide a
real-time evaluation of enhancement throughout all the
dynamic phases [1]. Real-time evaluation of enhancement is possible by maintaining the same scanning frame
rate of the previous conventional B-mode examination
[42]. Dynamic observation of the contrast-enhanced
phases (early arterial, arterial, pancreatic, portal/venous
and late/sinusoidal phases) begins immediately after the
injection of a second generation contrast medium.
Pancreatic solid lesions, even if poorly vascular or
characterized by rapid-flow circulation, always show intratumoral micro- and macrovasculature. Taking advan-
105
tage of a continuous observation of the contrast-enhanced
phases, CEUS allows a real-time study of the tumor vascular network [1]. As a consequence, the study of tumor
vasculature shows better results at CEUS than at CT
[73]. Moreover, the correlation between CEUS pattern
and MVD of pancreatic tumors can be so strong that a
prognostic stratification, based on CEUS features, can
be proposed both for ductal adenocarcinoma [11] and
endocrine tumors [70]. In fact, association between MVD
and tumor aggressiveness has been already proved:
markedly hypovascular lesions, usually characterized by
necrotic degeneration, turn out to be undifferentiated at
pathology and having a worse prognosis [1].
To obtain a more objective evaluation of tumor perfusion at CEUS, a quantification analysis can nowadays
be obtained directly on the US scanner (Fig. 8.18). The
resulting color maps (Fig. 8.19) actually seem very
similar to those obtained at perfusion CT.
Fig. 8.18 Pancreatic
adenocarcinoma: quantitative
perfusion analysis at CEUS.
The pancreatic tumor (blue
colored on the maps) shows
low enhancement (ROI
placed in the tumor) in
respect to the adjacent
parenchyma (ROI placed in
the pancreas), thus providing
an objective characterization
of the lesion based on the
evaluation of tumor
vascularity
106
C.F. Dietrich et al.
Fig. 8.19 Non-hyperfunctioning neuroendocrine tumor of the pancreas: quantitative perfusion analysis at CEUS. Pancreatic head
mass with large necrotic avascular central area (colored in blue on the map); surrounded by viable neoplastic tissue irregular in
thickness and vasculature (colored in green and red on the map). Enhancement quantification of the highest vascular portion of the
tumor can be obtained by drafting a ROI in a selected area on the colored map
a
b
c
d
e
f
Fig. 8.20 a-f Differential diagnosis of pancreatic carcinoma and chronic pancreatitis. Chronic pancreatitis (a-c). CE-EUS in high
MI Doppler mode with microvessel analysis (a), elastography (b) and CE-EUS in low MI mode (c): multiple vessels with venous
signal in high MI mode, honeycomb pattern in elastography and contrast enhancing effect in low MI mode. Pancreatic adenocarcinoma
(d-f). CE-EUS in high MI Doppler mode with microvessel analysis (d), elastography (e) and CE-EUS in low MI mode (f): only a
few arterial vessels are visible using pulse waved Doppler mode, blue color meaning dense structure in elastography and non
contrast enhancing effect in low MI mode
Microvessels in pancreatic tumor are generally hard
to detect by unenhanced power or color-Doppler mode
with the exception of lesion with neuroendocrine origin.
However, US contrast enhancers can be used as signal
improving agents in high mechanical color-Doppler
mode especially during endoscopic study [47, 48]. Preliminary results were published by Bhutani et al. [74].
The advantage of EUS in comparison to all other diagnostic methods is the high resolution, allowing the de-
scription of the vessel system and the discrimination between arterial and venous vessels. This could open up
new diagnostic possibilities. Chronic inflammatory pancreatic tissue can be differentiated from cancer tissue
just by analyzing those microvessels [28, 75-77]. The
typical finding of a chronic pancreatitis is a netlike rich
vessel system with regular appearance and arterial and
venous vessels side by side. On the other hand, the typical
finding of pancreatic cancer is a rarefication of irregular
8 Solid Pancreatic Tumors
107
Table 8.2 Results of contrast enhanced endosonography regarding criteria of hyper- and hypovascularity as well as vessel structure
and visibility of venous vessels
Sum
Hypervascularity
Hypovascularity
Irregular vessels
Venous vessels
Chronic pancreatitis
73
55
18
21
70
Pancreatic adenocarcinoma
121
28
93
97
10
vessels and, using the contrast enhanced endoscopic
Doppler mode, no visible venous vessels in the lesion.
The visible difference between normal and cancerous
vessels can be described by pathology as well [78]. However, no investigation about arterial or venous microvessels is ongoing due to the major difficulty in discriminating vessels in microscopic dimensions without
immunostaining. The sensitivity and specificity of EUS
in the discrimination of chronic pancreatitis could be
improved to 91.7 and 95.9% using those criteria [48].
The results of our study are shown in Table 8.2.
The principle of the phenomenon consists of the invasive and compressive behavior of the pancreatic tumor. Therefore, the analysis of arterial and venous vessels by contrast enhanced Doppler US is a reliable
method for discriminating chronic pancreatitis from
pancreatic carcinoma (Fig. 8.20).
In PanIN-2 mucinous epithelial cells form flat lesions, but cell abnormalities are always present. The
nuclei are enlarged and show signs of pseudo-stratifications. Mitosis is seldom.
PanIN-3 is a polypoid lesion in a papillary or micropapillary structure with signs of necrosis. The nuclei are often
irregular and an increased mitosis rate is reported.
Whereas PanIN 1–2 lesions are invisible at EUS, there
is a chance of visualizing PanIN-3 lesions due to the pancreatic duct irregularities (Fig. 8.21), which can be cytologically confirmed after fine needle aspiration [81].
As in PanINs, different types of intraductal papillary-mucinous neoplasms (IPMN) can be discriminated
ranging from benign to invasive lesions. Becoming invasive, some of these tumors appear as ductal adenocarcinoma, others as colloid carcinoma with a much
better prognosis [82, 83].
8.6.2
8.6.3
Pancreatic Intraepithelial Neoplasia
(PanIN)
During the last few years due to the fatal prognosis of
pancreatic carcinoma, great efforts have been made to
investigate precursor lesions of invasive neoplasia. Pancreatic intraepithelial neoplasias (PanIN) have been
recognized as precursor lesions of ductal adenocarcinoma, and are classified into different grades from
PanIN-1 to PanIN-3 [79]. Molecular analyses have
helped to define a progression model for pancreatic
neoplasia. The most important step seems to be the occurrence of a PanIN-3 lesion which defines a high risk
of malignant transformation [80].
PanIN-1A is a flat lesion with cylindrical epithelium
with small round nuclei and plenty of supranuclear
mucin. There is a broad overlap in histology to nonneoplastic lesions and neoplastic lesions without atypical epithelium.
PanIN-1B is an epithelial lesion with papillar and micropapillar structures and straight architecture, otherwise
those lesions are comparable to the PanIN-1A lesions.
Autoimmune pancreatitis
The diagnosis of autoimmune pancreatitis (AIP) can
be difficult in cases of tumor like lesions mimicking
ductal adenocarcinoma of the pancreas. Real-time elas-
Fig. 8.21 PanIN-3. PanIN-3 lesion (arrow) visible in EUS
108
tography [84] is helpful in the differential diagnosis.
Patients with AIP typically present with a unique pattern
of mainly blue (stiff) colour signals not only in the tumour but also evenly spread over the surrounding pancreatic parenchyma. Using contrast enhanced ultrasound AIP is typically hyperenhancing [85, 86].
References
1. D’Onofrio M, Gallotti A, Pozzi Mucelli R (2010) Imaging
techniques in pancreatic tumors. Expert Rev Med Devices
7:257-273
2. Sahani DV, Shan ZK, Catalano OA et al (2008) Radiology
of pancreatic adenocarcinoma: current status of imaging. J
Gastroenterol Hepatol 23:23-33. Review
3. Martinez-Noguera A, D’Onofrio M (2007) Ultrasonography
of the pancreas. 1. Conventional imaging. Abdom Imaging
32:136-149
4. Hohl C, Schmidt T, Honnef D et al (2007) Ultrasonography
of the pancreas. 2. Harmonic imaging. Abdom Imaging
32:150-160
5. Bertolotto M, D’Onofrio M, Martone E et al (2007) Ultrasonography of the pancreas. 3. Doppler imaging. Abdom
Imaging 32(2):161-170
6. Gallotti A, D’Onofrio M, Pozzi Mucelli R (2010) Acoustic
radiation force impulse (ARFI) technique in the ultrasound
study with Virtual Touch tissue quantification of the superior
abdomen. Radiol Med 115:889-897
7. Procacci C, Biasiutti C, Carbognin G et al (2001) Pancreatic
neoplasms and tumor-like conditions. Eur Radiol 11[Suppl
2]:S167-S192
8. Schima W, Ba-Ssalamah A, Kölblinger C et al (2007) Pancreatic adenocarcinoma. Eur Radiol 17:638-649. Review
9. Cubilla AL, Fitzgerald PJ (1984) Tumors of the exocrine
pancreas. 2nd Series Ed. Washington, DC: Armed Forces
Institute of Pathology
10. O’Connor TP, Wade TP, Sunwoo YC et al (1992) Small cell
undifferentiated carcinoma of the pancreas. Report of a patient with tumor marker studies. Cancer 70:1514-1519
11. Cameron JL (2001) Atlas of clinical oncology. Pancreatic
Cancer. American Cancer Society. London, BC Decker Inc
Hamilton
12. D’Onofrio M, Zamboni G, Malagò R et al (2009) Resectable
pancreatic adenocarcinoma: is the enhancement pattern at
contrast-enhanced ultrasonography a pre-operative prognostic
factor? Ultrasound Med Biol 35:1929-1937
13. Nagakawa T, Mori K, Nakano T et al (1993) Perineural invasion of carcinoma of the pancreas and biliary tract. Br J
Surg 80:619-621
14. Drapiewski JF (1994) Carcinoma of the pancreas: a study of
neoplastic invasion of nerves and its possible clinical significance. Am J Clin Pathol 14:549-556
15. Martínez-Noguera A, Montserrat E, Torrubia S et al (2001)
Ultrasound of the pancreas: update and controversies. Eur
Radiol 11:1594-1606
16. Abu-Yousef MM, El-Zein Y (2000) Improved US visualization of the pancreatic tail with simethicone, water, and patient
rotation. Radiology 217:780-785
C.F. Dietrich et al.
17. Minniti S, Bruno C, Biasiutti C et al (2003) Sonography
versus helical CT in identification and staging of pancreatic
ductal adenocarcinoma. J Clin Ultrasound 31:175-182
18. Baron RL (1994) Understanding and optimizing use of contrast material for CT of the liver. Am J Roentgenol 163:323331
19. Prokesch RW, Chow LC, Beaulieu CF et al (2002) Isoattenuating pancreatic adenocarcinoma at multi-detector row CT:
secondary signs. Radiology 224:764-768
20. Yoon SH, Lee JM, Cho JY et al (2011= Small (<=20 mm)
pancreatic adenocarcinomas: analysis of enhancement patterns and secondary signs with multiphasic multidetector
CT. Radiology 259:442-452
21. Kim JH, Park SH, Yu ES et al (2010) Visually isoattenuating
pancreatic adenocarcinoma at dynamic-enhanced CT: frequency, clinical and pathologic characteristics, and diagnosis
at imaging examinations. Radiology 257:87-96
22. Barugola G, Partelli S, Marcucci S et al (2009) Resectable
pancreatic cancer: who really benefits from resection? Ann
Surg Oncol 16:3316-3322
23. Niederau C, Grendell JH (1992) Diagnosis of pancreatic carcinoma. Imaging techniques and tumor markers. Pancreas
7:66-86. Review
24. Karlson BM, Ekbom A, Lindgren PG et al (1999) Abdominal
US for diagnosis of pancreatic tumor: prospective cohort
analysis. Radiology 213:107-111
25. Rosewicz S, Wiedenman B (1997) Pancreatic carcinoma.
Lancet 349:485-489
26. Ichikawa T, Haradome H, Hachiya J et al (1997) Pancreatic
ductal adenocarcinoma: preoperative assessment with helical
CT versus dynamic MR imaging. Radiology 202:655-662
27. Chaya CT, Bhutani MS (2007) Ultrasonography of the pancreas. 6. Endoscopic imaging Abdom Imaging 32:191-199
28. Brand B, Pfaff T, Binmoeller KF et al (2000) Endoscopic ultrasound for differential diagnosis of focal pancreatic lesions,
confirmed by surgery. Scand J Gastroenterol 35:1221-1228
29. Dietrich CF, Jenssen C, Allescher HD et al (2008) Differential
diagnosis of pancreatic lesions using endoscopic ultrasound.
Z Gastroenterol 46:601-617
30. Becker D, Strobel D, Bernatik T et al (2001) Echo-enhanced
color- and power-Doppler EUS for the discrimination between focal pancreatitis and pancreatic carcinoma. Gastrointest Endosc 53:784-789
31. Hirche TO, Ignee A, Barreiros AP et al (2008) Indications
and limitations of endoscopic ultrasound elastography for
evaluation of focal pancreatic lesions. Endoscopy 40:910917
32. Muller MF, Meyenberger C, Bertschinger P et al (1994) Pancreatic tumors: evaluation with endoscopic US, CT, and MR
imaging. Radiology 190:745-751
33. Mesihovic R, Vanis N, Husic-Selimovic A et al (2005) Evaluation of the diagnostic accuracy of the endoscopic ultrasonography results in the patients examined in a period of
three years. Med Arh 2005;59:299-302
34. Menges M, Lerch MM, Zeitz M (2000) The double duct
sign in patients with malignant and benign pancreatic lesions.
Gastrointest Endosc 52:74-77
35. Dearden JC, Ayaru L, Wong V et al (2004) The double duct
sign. Lancet 364:302
36. Tanaka S, Nakao M, Ioka T et al (2010) Slight dilatation of
the main pancreatic duct and presence of pancreatic cysts as