Ebook Principles of biochemistry (5/E): Part 2
Bạn đang xem bản rút gọn của tài liệu. Xem và tải ngay bản đầy đủ của tài liệu tại đây (32.19 MB, 495 trang )
Introduction
to Metabolism
I
n the preceding chapters, we described the structures and functions of the major
components of living cells from small molecules to polymers to larger aggregates
such as membranes. The next nine chapters focus on the biochemical activities that
assimilate, transform, synthesize, and degrade many of the nutrients and cellular components already described. The biosynthesis of proteins and nucleic acids, which represent
a significant proportion of the activity of all cells, will be described in Chapters 20–22.
We now move from molecular structure to the dynamics of cell function. Despite
the marked shift in our discussion, we will see that metabolic pathways are governed by
basic chemical and physical laws. By taking a stepwise approach that builds on the foundations established in the first two parts of this book, we can describe how metabolism
operates. In this chapter, we discuss some general themes of metabolism and the thermodynamic principles that underlie cellular activities.
10.1 Metabolism Is a Network of Reactions
Metabolism is the entire network of chemical reactions carried out by living cells.
Metabolites are the small molecules that are intermediates in the degradation or biosynthesis of biopolymers. The term intermediary metabolism is applied to the reactions
involving these low-molecular-weight molecules. It is convenient to distinguish between
reactions that synthesize molecules (anabolic reactions) and reactions that degrade
molecules (catabolic reactions).
Anabolic reactions are those responsible for the synthesis of all compounds needed
for cell maintenance, growth, and reproduction. These biosynthesis reactions make
simple metabolites such as amino acids, carbohydrates, coenzymes, nucleotides, and
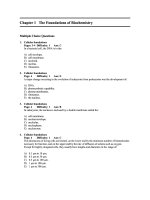
Top: The fundamental principles of metabolism are the same in animals and plants and in all other organisms.
294
For most metabolic sequences neither
the substrate concentration nor the
product concentration changes
significantly, even though the flux
through the pathway may change
dramatically.
—Jeremy R. Knowles (1989)
10.1 Metabolism Is a Network of Reactions
Light
(photosynthetic
organisms only)
Figure 10.1
Anabolism and catabolism. Anabolic
reactions use small molecules and chemical
energy in the synthesis of macromolecules
and in the performance of cellular work.
Solar energy is an important source of metabolic energy in photosynthetic bacteria and
plants. Some molecules, including those
obtained from food, are catabolized to release
energy and either monomeric building
blocks or waste products.
᭣
Organic
molecules
Organic
molecules
(food)
Cellular
Anabolism
work Catabolism
(Biosynthesis)
Energy
Energy
Building
blocks
Wastes
Inorganic
molecules
fatty acids. They also produce larger molecules such as proteins, polysaccharides,
nucleic acids, and complex lipids (Figure 10.1).
In some species, all of the complex molecules that make up a cell are synthesized from
inorganic precursors (carbon dioxide, ammonia, inorganic phosphates, etc.)(Section 10.3).
Some species derive energy from these inorganic molecules or from the creation of
membrane potential (Section 9.11). Photosynthetic organisms use light energy to drive
biosynthesis reactions (Chapter 15).
Catabolic reactions degrade large molecules to liberate smaller molecules and
energy. All cells carry out degradation reactions as part of their normal cell metabolism
but some species rely on them as their only source of energy. Animals, for example, require organic molecules as food. The study of these energy-producing catabolic reactions
in mammals is called fuel metabolism. The ultimate source of these fuels is a biosynthetic pathway in another species. Keep in mind that all catabolic reactions involve the
breakdown of compounds that were synthesized by a living cell—either the same cell, a
different cell in the same individual, or a cell in a different organism.
There is a third class of reactions called amphibolic reactions. They are involved in
both anabolic and catabolic pathways.
Whether we observe bacteria or large multicellular organisms, we find a bewildering variety of biological adaptations. More than 10 million species may be living on
Earth and several hundred million species may have come and gone throughout the
course of evolution. Multicellular organisms have a striking specialization of cell types
or tissues. Despite this extraordinary diversity of species and cell types the biochemistry of
living cells is surprisingly similar not only in the chemical composition and structure of
cellular components but also in the metabolic routes by which the components are
modified. These universal pathways are the key to understanding metabolism. Once
you’ve learned about the fundamental conserved pathways you can appreciate the additional pathways that have evolved in some species.
The complete sequences of the genomes of a number of species have been determined.
For the first time we are beginning to have a complete picture of the entire metabolic
network of these species based on the sequences of the genes that encode metabolic enzymes.
Escherichia coli, for example, has about 900 genes that encode enzymes used in intermediary metabolism and these enzymes combine to create about 130 different pathways.
295
KEY CONCEPT
Most of the fundamental metabolic
pathways are present in all species.
296
CHAPTER 10 Introduction to Metabolism
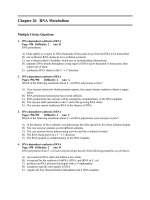
Figure 10.2 ᭤
A protein interaction network for yeast
(Saccharomyces cerevisiae). Dots represent
individual proteins, colored according to
function. Solid lines represent interactions
between proteins. The colored clusters
identify the large number of genes involved
in metabolism.
Mitochondria
Peroxisome
Ribosome &
translation
Metabolism &
amino acid
biosynthesis
RNA
processing
Secretion &
vesicle
transport
Chromatin &
transcription
Protein folding
& glycosylation
Cell wall
biosynthesis
Nuclearcytoplasmic
transport
Nuclear
migration
& protein
degradation
Cell polarity &
morphogenesis
Mitosis & chr.
segregation
DNA replication
& repair
These metabolic genes account for 21% of the genes in the genome. Other species of
bacteria have a similar number of enzymes that carry out the basic metabolic reactions.
Some species contain additional pathways. The bacterium that causes tuberculosis,
Mycobacterium tuberculosis, has about 250 enzymes involved in fatty acid metabolism—
five times as many as E. coli.
The yeast Saccharomyces cerevisiae is a single-celled member of the fungus kingdom. Its genome contains 5900 protein-encoding genes. Of these, 1200 (20%) encode
enzymes involved in intermediary and energy metabolism (Figure 10.2). The nematode
Caenorhabditis elegans is a small, multicellular animal with many of the same specialized cells and tissues found in larger animals. Its genome encodes 19,100 proteins of
which 5300 (28%) are thought to be required in various pathways of intermediary
metabolism. In the fruit fly, Drosophila melanogaster, approximately 2400 (17%) of its
14,100 genes are predicted to be involved in intermediary metabolic pathways and
bioenergetics. The exact number of genes required for basic metabolism in humans is
not known but it’s likely that about 5000 genes are needed. (The human genome has
approximately 22,000 genes.)
There are five common themes in metabolism.
1. Organisms or cells maintain specific internal concentrations of inorganic ions,
metabolites, and enzymes. Cell membranes provide the physical barrier that segregates cell components from the environment.
2. Organisms extract energy from external sources to drive energy-consuming reactions. Photosynthetic organisms derive energy from the conversion of solar energy
to chemical energy. Other organisms obtain energy from the ingestion and catabolism
of energy-yielding compounds.
3. The metabolic pathways in each organism are specified by the genes it contains in
its genome.
4. Organisms and cells interact with their environment. The activities of cells must be
geared to the availability of energy, organisms grow and reproduce. When the supply of energy from the environment is plentiful. When the supply of energy from
the environment is limited, energy demands can be temporarily met by using internal stores or by slowing metabolic rates as in hibernation, sporulation, or seed formation. If the shortage is prolonged, organisms die.
5. The cells of organisms are not static assemblies of mtneylecules. Many cell components are continually synthesized and degraded, that is, they undergo turnover, even
10.2 Metabolic Pathways
297
though their concentrations may remain virtually constant. The concentrations of
other compounds change in response to changes in external or internal conditions.
The metabolism section of this book describes metabolic reactions that operate in
most species. For example, enzymes of glycolysis (the degradation of sugar) and of gluconeogenesis (biosynthesis of glucose) are present in almost all species. Although most
cells possess the same set of central metabolic reactions, cell and organism differentiation
is possible because of additional enzymatic reactions specific to the tissue or species.
10.2 Metabolic Pathways
The vast majority of metabolic reactions are catalyzed by enzymes so a complete
description of metabolism includes not only the reactants, intermediates, and products of
cellular reactions but also the characteristics of the relevant enzymes. Most cells can perform hundreds to thousands of reactions. We can deal with this complexity by systematically subdividing metabolism into segments or branches. In the following chapters, we
begin by considering separately the metabolism of the four major groups of biomolecules: carbohydrates, lipids, amino acids, and nucleotides. Within each of the four areas
of metabolism, we recognize distinct sequences of metabolic reactions, called pathways.
A. Pathways Are Sequences of Reactions
A metabolic pathway is the biological equivalent of a synthesis scheme in organic chemistry. A metabolic pathway is a series of reactions where the product of one reaction
becomes the substrate for the next reaction. Some metabolic pathways may consist of
only two steps while others may be a dozen steps in length.
It’s not easy to define the limits of a metabolic pathway. In the laboratory, a chemical synthesis has an obvious beginning substrate and an obvious end product but cellular pathways are interconnected in ways that make it difficult to pick a beginning and an
end. For example, in the catabolism of glucose (Chapter 11), where does glycolysis
begin and end? Does it begin with polysaccharides (such as glycogen and starch), extracellular glucose, glucose 6-phosphate, or intracellular glucose? Does the pathway end
with pyruvate, acetyl CoA, lactate, or ethanol? Start and end points can be assigned
somewhat arbitrarily, often according to tradition or for ease of study, but keep in mind
that reactions and pathways can be linked to form extended metabolic routes. This network is very obvious when you examine the large metabolic charts that are sometimes
posted on the walls outside professors’ offices (Figure 10.3).
Individual metabolic pathways can take different forms. A linear metabolic pathway,
such as the biosynthesis of serine, is a series of independent enzyme-catalyzed reactions
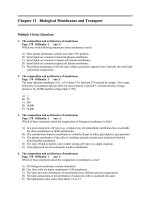
Figure 10.3
Part of a large metabolic chart published by
Roche Applied Science.
᭣
298
CHAPTER 10 Introduction to Metabolism
(a)
(b)
(c)
Acetyl CoA
CoA
3-Phosphoglycerate
Oxaloacetate
3-Phosphohydroxypyruvate
S CoA
O
Citrate
S CoA
Malate
O
Fumarate
O
Succinate
᭡ Figure 10.4
Forms of metabolic pathways. (a) The biosynthesis of serine is an example of a linear
metabolic pathway. The product of each step
is the substrate for the next step. (b) The sequence of reactions in a cyclic pathway
forms a closed loop. In the citric acid cycle,
an acetyl group is metabolized via reactions
that regenerate the intermediates of the
cycle. (c) In fatty acid biosynthesis, a spiral
pathway, the same set of enzymes catalyzes
a progressive lengthening of the acyl chain.
S CoA
Isocitrate
3-Phosphoserine
Serine
O
CO2
a-Ketoglutarate
Succinyl CoA
S CoA
CO2
in which the product of one reaction is the substrate for the next reaction in the pathway
(Figure 10.4a). A cyclic metabolic pathway, such as the citric acid cycle, is also a sequence
of enzyme-catalyzed steps, but the sequence forms a closed loop, so the intermediates
are regenerated with every turn of the cycle (Figure 10.4b). In a spiral metabolic pathway,
such as the biosynthesis of fatty acids (Section 16.6), the same set of enzymes is used repeatedly for lengthening or shortening a given molecule (Figure 10.4c).
Each type of pathway may have branch points where metabolites enter or leave. In
most cases, we don’t emphasize the branching nature of pathways because we want to
focus on the main routes followed by the most important metabolites. We also want to
focus on the pathways that are commonly found in all species. These are the most fundamental pathways. Don’t be misled by this simplification. A quick glance at any metabolic
chart will show that pathways have many branch points and that initial substrates and final
products are often intermediates in other pathways. The serine pathway in Figure 10.3 is
a good example. Can you find it?
B. Metabolism Proceeds by Discrete Steps
KEY CONCEPT
The limitations of chemistry and physics
dictate that metabolic pathways consist
of many small steps.
Intracellular environments don’t change very much. Reactions proceed at moderate
temperatures and pressures, at rather low reactant concentrations, and at close to neutral pH. We often refer to this as homeostasis at the cellular level.
These conditions require a multitude of efficient enzymatic catalysts. Why are so
many distinct reactions carried out in living cells? In principle, it should be possible to
carry out the degradation and the synthesis of complex organic molecules with far
fewer reactions.
One reason for multistep pathways is the limited reaction specificity of enzymes.
Each active site catalyzes only a single step of a pathway. The synthesis of a molecule—
or its degradation—therefore follows a metabolic route defined by the availability of
suitable enzymes. As a general rule, a single enzyme-catalyzed reaction can only break
or form a few covalent bonds at a time. Often the reaction involves the transfer of a single chemical group. Thus, the large number of reactions and enzymes is due, in part, to
the limitations of enzymes and chemistry.
Another reason for multiple steps in metabolic pathways is to control energy input
and output. Energy flow is mediated by energy donors and acceptors that carry discrete
quanta of energy. As we will see, the energy transferred in a single reaction seldom
exceeds 60 kJ mol-1. Pathways for the biosynthesis of molecules require the transfer of
energy at multiple points. Each energy-requiring reaction corresponds to a single step
in the reaction sequence.
The synthesis of glucose from carbon dioxide and water requires the input of
~2900 kJ mol-1 of energy. It is not thermodynamically possible to synthesize glucose in
a single step (Figure 10.5). Similarly, much of the energy released during a catabolic
process (such as the oxidation of glucose to carbon dioxide and water, which releases
the same 2900 kJ mol-1) is transferred to individual acceptors one step at a time rather
10.2 Metabolic Pathways
Glucose + 6 O2
(a)
Impossible
one-step
synthesis
Glucose + 6 O2
(b)
Multistep
pathway
299
Uncontrolled
combustion
Multistep
pathway
Energy
Energy
Energy
Energy
Energy
Energy
Energy
Figure 10.5
Single-step versus multistep pathways. (a) The
synthesis of glucose cannot be accomplished
in a single step. Multistep synthesis is coupled to the input of small quanta of energy
from ATP and NADH. (b) The uncontrolled
combustion of glucose releases a large
amount of energy all at once. A multistep
enzyme-catalyzed pathway releases the
same amount of energy but conserves much
of it in a manageable form.
᭣
Energy
Energy
Energy
6 CO2 + 6 H2O
6 CO2 + 6 H2O
Anabolism
(Biosynthesis)
Catabolism
than being released in one grand, inefficient explosion. The efficiency of energy transfer
at each step is never 100%, but a considerable percentage of the energy is conserved in
manageable form. Energy carriers that accept and donate energy, such as adenine
nucleotides (ATP) and nicotinamide coenzymes (NADH), are found in all life forms.
A major goal of learning about metabolism is to understand how these “quanta” of
energy are used. ATP and NADH—and other coenzymes—are the “currency” of metabolism. This is why metabolism and bioenergetics are so closely linked.
C. Metabolic Pathways Are Regulated
Metabolism is highly regulated. Organisms react to changing environmental conditions
such as the availability of energy or nutrients. Organisms also respond to genetically
programmed instructions. For example, during embryogenesis or reproduction, the
metabolism of individual cells can change dramatically.
The responses of organisms to changing conditions range from small changes to
drastically reorganizing the metabolic processes that govern the synthesis or degradation of biomolecules and the generation or consumption of energy. Control processes
can affect many pathways or only a few, and the response time can range from less than
a second to hours or longer. The most rapid biological responses, occurring in millisec2+
onds, include changes in the passage of small ions (e.g., Na ᮍ , K ᮍ , and Ca~
) through
cell membranes. Transmission of nerve impulses and muscle contraction depend on ion
movement. The most rapid responses are also the most short-lived; slower responses
usually last longer.
It is important to understand some basic concepts of pathways in order to see how
they are regulated. Consider a simple linear pathway that begins with substrate A and
ends with product P.
E1
E2
E3
E4
E5
A Δ B Δ C Δ D Δ E Δ P
(10.1)
300
CHAPTER 10 Introduction to Metabolism
The precise technical term for the condition where cellular pathways are not
in a dynamic steady-state condition
is . . . dead.
Each of the reactions is catalyzed by an enzyme and they are all reversible. Most reactions in living cells have reached equilibrium so the concentrations of B, C, D, and E do
not change very much. This is similar to the steady state condition we encountered in
Section 5.3A. The steady state condition can be visualized by imagining a series of
beakers of different sizes (Figure 10.6). Water flows into the first beaker from a tap and
when it fills up the water spills over into another beaker. After filling up a series of
beakers, there will be a steady flow of water from the tap onto the floor. The rate of flow
is analogous to the flux through a metabolic pathway. The flux can vary from a trickle to
a gusher but the steady state levels of water in each beaker don’t change. (Unfortunately,
this analogy doesn’t allow us to see that in a metabolic pathway the flux could also be in
the opposite direction.)
Flux through a metabolic pathway will decrease if the concentration of the initial
substrate falls below a certain threshold. It will also decrease if the concentration of the
final product rises. These are changes that affect all pathways. However, in addition to
these normal concentration effects, there are special regulatory controls that affect the
activity of particular enzymes in the pathway. It is tempting to visualize regulation of a
pathway by the efficient manipulation of a single rate limiting enzymatic reaction,
sometimes likened to the narrow part of an hourglass. In many cases, however, this is an
oversimplification. Flux through most pathways depends on controls at several steps.
These steps are special reactions in the pathways where the steady state concentrations
of substrates and products are far from the equilibrium concentrations so the flux tends
to go only in one direction. A regulatory enzyme contributes a particular degree of control over the overall flux of the pathway in which it participates. Because intermediates
or cosubstrates from several sources can feed into or out of a pathway, the existence of
multiple control points is normal; an isolated, linear, pathway is rare.
There are two common patterns of metabolic regulation: feedback inhibition and
feed-forward activation. Feedback inhibition occurs when a product (usually the end
product) of a pathway controls the rate of its own synthesis through inhibition of an
early step, usually the first committed step (the first reaction that is unique to the pathway).
A
E1
B
E2
C
E3
D
E4
E
E5
P
(10.2)
The advantage of such a regulatory pattern in a biosynthetic pathway is obvious. When
the concentration of P rises above its steady state level, the effect is transmitted back
through the pathway and the concentrations of each intermediate also rise. This causes
flux to reverse in the pathway, leading to a net increase in the production of product A
from reactant P. Flux in the normal direction is restored when P is depleted. The pathway is inhibited at an early step; otherwise, metabolic intermediates would accumulate
unnecessarily. The important point in Reaction 10.2 is that the reaction catalyzed by
enzyme E1 is not allowed to reach equilibrium. It is a metabolically irreversible reaction
because the enzyme is regulated. Flux through this point is not allowed to go in the opposite direction.
Feed-forward activation occurs when a metabolite produced early in a pathway activates an enzyme that catalyzes a reaction further down the pathway.
A
᭡ Figure 10.6
Steady state and flux in a metabolic pathway.
The rate of flow is equivalent to the flux in a
pathway, and the constant amount of water
in each beaker is analogous to the steady
state concentrations of metabolites in a
pathway.
E1
B
E2
C
E3
D
E4
E
E5
P
(10.3)
In this example, the activity of enzyme E1 (which converts A to B) is coordinated with
the activity of enzyme E4 (which converts D to E). An increase in the concentration of
metabolite B increases flux through the pathway by activating E4. (E4 would normally
be inactive in low concentrations of B.)
In Section 5.10, we discussed the modulation of individual regulatory enzymes.
Allosteric activators and inhibitors, which are usually metabolites, can rapidly alter the
10.2 Metabolic Pathways
activity of many of these enzymes by inducing conformational changes that affect catalytic activity. We will see many examples of allosteric modulation in the coming chapters.
The allosteric modulation of regulatory enzymes is fast but not as rapid in cells as it can
be with isolated enzymes.
The activity of interconvertible enzymes can also be rapidly and reversibly altered
by covalent modification, commonly by the addition and removal of phosphoryl
groups as described in Section 5.9D. Recall that phosphorylation, catalyzed by protein
kinases at the expense of ATP, is reversed by the action of protein phosphatases, which
catalyze the hydrolytic removal of phosphoryl groups. Individual enzymes differ in
whether their response to phosphorylation is activation or deactivation. Interconvertible enzymes in catabolic pathways are generally activated by phosphorylation and deactivated by dephosphorylation; most interconvertible enzymes in anabolic pathways
are inactivated by phosphorylation and reactivated by dephosphorylation. The activation of kinases with multiple specificities allows coordinated regulation of more than
one metabolic pathway by one signal. The cascade nature of intracellular signaling
pathways, described in Section 9.12, also means that the initial signal is amplified
(Figure 10.7).
The amounts of specific enzymes can be altered by increasing the rates of specific
protein synthesis or degradation. This is usually a slow process relative to allosteric or
covalent activation and inhibition. However, the turnover of certain enzymes may be
rapid. Keep in mind that several modes of regulation can operate simultaneously within
a metabolic pathway.
301
In Part 4 of this book, we examine
more closely the regulation of gene
expression and protein synthesis.
D. Evolution of Metabolic Pathways
The evolution of metabolic pathways is an active area of biochemical research. These
studies have been greatly facilitated by the publication of hundreds of complete genome
sequences, especially prokaryotic genomes. Biochemists can now compare pathway
enzymes in a number of species that show a diverse variety of pathways. Many of these
pathways provide clues to the organization and structure of the primitive pathways that
were present in the first cells.
There are many possible routes to the formation of a new metabolic pathway. The
simplest case is the addition of a new terminal step to a preexisting pathway. Consider
the hypothetical pathway in Equation 10.1. The original pathway might have terminated with the production of metabolite E after a four-step transformation from substrate A. The availability of substantial quantities of metabolite E might favor the evolution
of a new enzyme (E5 in this case) that could use E as a substrate to make P. The pathways
Initial signal
Signal
transduction
HO
Protein
Protein
ATP
P
ADP
Protein
Protein
OH
Cellular
response
P
Protein
OH
ATP
Protein
kinase
ADP
Figure 10.7
Regulatory role of a protein kinase. The effect
of the initial signal is amplified by the signaling cascade. Phosphorylation of different
cellular proteins by the activated kinase
results in coordinated regulation of different
metabolic pathways. Some pathways may
be activated, whereas others are inhibited.
P represents a protein-bound phosphate
group.
᭣
Protein
ATP ADP
Cellular
response
Cellular
response
P
302
CHAPTER 10 Introduction to Metabolism
leading to synthesis of asparagine and glutamine from aspartate and glutamate pathways are examples of this type of pathway evolution. This forward evolution is thought
to be a common mechanism of evolution of new pathways.
In other cases, a new pathway can form by evolving a branch to a preexisting pathway. For example, consider the conversion of C to D in the Equation 10.1 pathway. This
reaction is catalyzed by enzyme E3. The primitive E3 enzyme might not have been as
specific as the modern enzyme. In addition to producing product D, it might have synthesized a smaller amount of another metabolite, X. The availability of product X might
have conferred some selective advantage to the cell favoring a duplication of the E3
gene. Subsequent divergence of the two copies of the gene gave rise to two related
enzymes that specifically catalyzed C : D and C : X. There are many examples of
evolution by gene duplication and divergence (e.g., lactate dehydrogenase and malate
dehydrogenase, Section 4.7). (We have mostly emphasized the extreme specificity of
enzyme reactions but, in fact, many enzymes can catalyze several different reactions
using structurally similar substrates and products.)
Some pathways might have evolved “backwards.” A primitive pathway might have
utilized an abundant supply of metabolite E in the environment in order to make product P. As the supply of E became depleted over time there was selective pressure to
evolve a new enzyme (E4) that could make use of metabolite D to replenish metabolite
E. When D became rate limiting, cells could gain a selective advantage by utilizing C to
make more metabolite D. In this way the complete modern pathway evolved by
retroevolution, successively adding simpler precursors and extending the pathway.
Sometimes an entire pathway can be duplicated and subsequent adaptive evolution
leads to two independent pathways with homologous enzymes that catalyze related reactions. There is good evidence that the pathways leading to biosynthesis of tryptophan
and histidine evolved in this manner. Enzymes can also be recruited from one pathway
for use in another without necessarily duplicating an entire pathway. We’ll encounter
several examples of homologous enzymes that are used in different pathways.
Finally, a new pathway can evolve by “reversing” an existing pathway. In most cases,
there is one step in a pathway that is essentially irreversible. Let’s assume that the third
step in our hypothetical pathway (C : D) is unable to catalyze the conversion of D to C
because the normal reaction is far from equilibrium. The evolution of a new enzyme
that can catalyze D : C would allow this entire pathway to reverse direction, converting
P to A. This is how the glycolysis pathway evolved from the glucose biosynthesis (gluconeogenesis) pathway. There are many other examples of evolution by pathway reversal.
All of these possibilities play a role in the evolution of new pathways. Sometimes a
new pathway evolves by a combination of different mechanisms of adaptive evolution.
The evolution of the citric acid cycle pathway, which took place several billion years ago,
is an example (Section 12.9). New metabolic pathways are evolving all the time in
response to pesticides, herbicides, antibiotics, and industrial waste. Organisms that can
metabolize these compounds, thus escaping their toxic effects, have evolved new pathways and enzymes by modifying existing ones.
10.3 Major Pathways in Cells
This section provides an overview of the organization and function of some central
metabolic pathways that are discussed in subsequent chapters. We begin with the anabolic, or biosynthetic, pathways since these pathways are the most important for growth
and reproduction. A general outline of biosynthetic pathways is shown in Figure 10.8. All
cells require an external source of carbon, hydrogen, oxygen, nitrogen, phosphorus, and
sulfur plus additional inorganic ions (Section 1.2). Some species, notably bacteria and
plants, can grow and reproduce by utilizing inorganic sources of these essential elements.
These species are called autotrophs. There are two distinct categories of autotrophic
species. Heterotrophs, such as animals, need an organic carbon source (e.g., glucose).
Biosynthetic pathways require energy. The most complex organisms (from a biochemical perspective!) can generate useful metabolic energy from sunlight or by oxidizing inorganic molecules such as NH4ᮍ , H2, or H2S. The energy from these reactions is
10.3 Major Pathways in Cells
Starch
Glycogen
Other
carbohydrates
Pentose phosphate
pathway (12.5)
DNA
RNA
DNA (20)
RNA (21)
Nucleotides
Ribose,
deoxyribose
Nucleotide
synthesis
Glucose
Amino
acids
CO2
Photosynthesis (15)
ATP
NADPH
Gluconeogenesis (12.1)
Pyruvate
Acetyl CoA
Fatty acid
synthesis (16.1)
ADP + Pi
NADP + H
(16)
Fatty
acids
Glyoxylate
pathway (13.7)
Lipids
Membranes
NH4
Citric acid
cycle (13)
Figure 10.8
Overview of anabolic pathways. Large molecules are synthesized from smaller ones by
adding carbon (usually in the form of CO2)
and nitrogen (usually as NH4ᮍ ). The main
pathways include the citric acid cycle,
which supplies the intermediates in amino
acid biosynthesis, and gluconeogenesis, which
results in the production of glucose. The
energy for biosynthetic pathways is supplied
by light in photosynthetic organisms or by the
breakdown of inorganic molecules in other
autotrophs. (Numbers in parentheses refer
to the chapters and sections of this book.)
᭣
Starch synthesis (15.5) Light
Glycogen synthesis (12.5)
Calvin
cycle (15.4)
303
Amino acid
synthesis (17)
Amino
acids
Protein
synthesis (22)
Proteins
Nitrogen
fixation (17.1)
N2, NH4
used to synthesize the energy-rich compound ATP and the reducing power of NADH.
These cofactors transfer their energy to biosynthetic reactions.
There are two types of autotrophic species. Photoautotrophs obtain most of their energy by photosynthesis and their main source of carbon is CO2. This category
includes photosynthetic bacteria, algae, and plants. Chemoautotrophs obtain their energy
by oxidizing inorganic molecules and utilizing CO2 as a carbon source. Some bacterial
species are chemoautotrophs but there are no eukaryotic examples.
Heterotrophs can be split into two categories. Photoheterotrophs are photosynthetic
organisms that require an organic compound as a carbon source. There are several
groups of bacteria that are capable of capturing light energy but must rely on some
organic molecules as a carbon source. Chemoheterotrophs are nonphotosynthetic organisms that require organic molecules as carbon sources. Their metabolic energy is usually
derived from the breakdown of the imported organic molecules. We are chemoheterotrophs, as are all animals, most protists, all fungi, and many bacteria.
The main catabolic pathways are shown in Figure 10.9. As a general rule, these
degradative pathways are not simply the reverse of biosynthesis pathways. Note that the
citric acid cycle is a major pathway in both anabolic and catabolic metabolism. The
main roles of catabolism are to eliminate unwanted molecules and to generate energy
for use in other processes.
We will examine metabolism in the next few chapters. Our discussion of metabolic
pathways begins in Chapter 11 with glycolysis, a ubiquitous pathway for glucose catabolism.
There is a long-standing tradition in biochemistry of introducing students to glycolysis
before any other pathways are encountered. We know a great deal about the reactions in
this pathway and they will illustrate many of the fundamental principles of biochemistry. In glycolysis, the hexose is split into two three-carbon metabolites. This pathway
can generate ATP in a process called substrate level phosphorylation. Often, the product
of glycolysis is pyruvate, which can be converted to acetyl CoA for further oxidation.
Chapter 12 describes the synthesis of glucose, or gluconeogenesis. This chapter also
covers starch and glycogen metabolism and outlines the pathway by which glucose is
oxidized to produce NADPH for biosynthetic pathways and ribose for the synthesis of
nucleotides.
The citric acid cycle (Chapter 13) facilitates complete oxidation of the acetate carbons
of acetyl CoA to carbon dioxide. The energy released from this oxidation is conserved in
Chemoautotrophs in Yellowstone National
Park. There are many species of Thiobacillus
that derive their energy from the oxidation of
iron or sulfur. They do not require any organic
molecules. The orange and yellow colors
surrounding this hot spring in Yellowstone
National Park are due to the presence of
Thiobacillus. See Chapter 14 for an explanation of how such organisms generate energy from inorganic molecules.
᭡
304
CHAPTER 10 Introduction to Metabolism
Starch
Glycogen
Other
carbohydrates
Figure 10.9 ᭤
Overview of catabolic pathways. Amino acids,
nucleotides, monosaccharides, and fatty
acids are formed by enzymatic hydrolysis
of their respective polymers. They are then
degraded in oxidative reactions and energy
is conserved in ATP and reduced coenzymes
(mostly NADH). (Numbers in parentheses
refer to the chapters and sections of this
book.)
RNA
DNA
Nucleases (20)
Starch degradation (15.5)
Glycogen degradation (12.5)
Pentose
phosphate
pathway
(12.5)
Glucose
Ribose
deoxyribose
Glycolysis (11)
Nucleotides
Pyruvate
Pyrimidine
catabolism (18.9)
Acetyl CoA
(16)
b-Oxidation (16.7) Fatty
acids
Purine
catabolism
(18.8)
Uric acid,
urea, NH4+
Citric acid
cycle (13)
QH2
ATP
ADP + Pi
Electron
transport
Amino acid
degradation (17)
NH3
Lipids
Amino
acids
Proteases (6.8)
Proteins
NADH
the formation of NADH and ATP. As mentioned above, the citric acid cycle is an essential part of both anabolic and catabolic metabolism.
The production of ATP is one of the most important reactions in metabolism.
The synthesis of most ATP is coupled to membrane-associated electron transport
(Chapter 14). In electron transport, the energy of reduced coenzymes such as NADH is
used to generate an electrochemical gradient of protons across a cell membrane. The potential energy of this gradient is harnessed to drive the phosphorylation of ADP to ATP.
ADP + Pi ¡ ATP + H2O
(10.4)
We will see that the reactions of membrane-associated electron transport and coupled
ATP synthesis are similar in many ways to the reactions that capture light energy during
photosynthesis (Chapter 15).
Three additional chapters examine the anabolism and catabolism of lipids, amino
acids, and nucleotides. Chapter 16 discusses the storage of nutrient material as triacylglycerols and the subsequent oxidation of fatty acids. This chapter also describes the
synthesis of phospholipids and isoprenoid compounds. Amino acid metabolism is discussed in Chapter 17. Although amino acids were introduced as the building blocks of
proteins, some also play important roles as metabolic fuels and biosynthetic precursors.
Nucleotide biosynthesis and degradation are considered in Chapter 18. Unlike the other
three classes of biomolecules, nucleotides are catabolized primarily for excretion rather
than for energy production. The incorporation of nucleotides into nucleic acids and of
amino acids into proteins are major anabolic pathways. Chapters 20 to 22 describe these
biosynthetic reactions.
10.4 Compartmentation and Interorgan
Metabolism
Some metabolic pathways are localized to particular regions within a cell. For example,
the pathway of membrane-associated electron transport coupled to ATP synthesis takes
place within the membrane. In bacteria this pathway is located in the plasma membrane
and in eukaryotes it is found in the mitochondrial membrane. Photosynthesis is
another example of a membrane-associated pathway in bacteria and eukaryotes.
10.4 Compartmentation and Interorgan Metabolism
305
Cytosol:
fatty acid synthesis,
glycolysis, most
gluconeogme:s reaction
pentose phosphase
pathwwary
Golgi apparatus P
(end-on view)
sorting and secretion
of some proteins
Nucleus:
nucleic acid synthesis
Mitochondria:
citric acid cycle,
electron transport +
ATP synthesis, fatty
acid degradation
Endoplasmic reticulum:
delivery of proteins and
synthesis of lipids for
membranes
Lysosome:
degradation of proteins,
lipids, etc.
Nuclear membranes
Plasma membrane
Figure 10.10 ᭡
Compartmentation of metabolic processes within a eukaryotic cell. This is a colored electron micrograph of a cell showing the nucleus (green), mitochondria (purple), lysosomes (brown), and extensive endoplasmic reticulum (blue). (Not all pathways and organelles are shown.)
In eukaryotes, metabolic pathways are localized within several membrane-bound
compartments (Figure 10.10). For example, the enzymes that catalyze fatty acid synthesis are located in the cytosol, whereas the enzymes that catalyze fatty acid breakdown
are located inside mitochondria. One consequence of compartmentation is that separate pools of metabolites can be found within a cell. This arrangement permits the
simultaneous operation of opposing metabolic pathways. Compartmentation can also
offer the advantage of high local concentrations of metabolites and coordinated regulation of enzymes. Some of the enzymes that catalyze reactions in mitochondria (which
have evolved from a symbiotic prokaryote) are encoded by mitochondrial genes; this
origin explains their compartmentation.
There is also compartmentation at the molecular level. Enzymes that catalyze some
pathways are physically organized into multienzyme complexes (Section 5.11). With
these complexes, channeling of metabolites prevents their dilution by diffusion. Some
enzymes catalyzing adjacent reactions in pathways are bound to membranes and can
diffuse rapidly in the membrane for interaction.
Individual cells of multicellular organisms maintain different concentrations of
metabolites, depending in part on the presence of specific transporters that facilitate the
entry and exit of metabolites. In addition, depending on the cell-surface receptors and
signal-transduction mechanisms present, individual cells respond differently to external
signals.
In multicellular organisms, compartmentation can also take the form of specialization of tissues. The division of labor among tissues allows site-specific regulation of
metabolic processes. Cells from different tissues are distinguished by their complement
of enzymes. We are very familiar with the specialized role of muscle tissue, red blood
cells, and brain cells but cell compartmentation is a common feature even in simple
species. In cyanobacteria, for example, the pathway for nitrogen fixation is sequestered
in special cells called heterocysts (Figure 10.11). This separation is necessary because
nitrogenase is inactivated by oxygen and the cells that carry out photosynthesis produce
lots of oxygen.
Figure 10.11
Anabaena spherica. Many species of cyanobacteria form long, multicellular filaments. Some
specialized cells have adapted to carry out
nitrogen fixation. These heterocysts have
become rounded and are surrounded by a
thickened cell wall. The heterocysts are connected to adjacent cells by internal pores.
The formation of heterocysts is an example
of compartmentation of metabolic pathways.
᭡
306
CHAPTER 10 Introduction to Metabolism
10.5 Actual Gibbs Free Energy Change, Not
Standard Free Energy Change, Determines
the Direction of Metabolic Reactions
The Gibbs free energy change is a measure of the energy available from a reaction (Section 1.4B). The standard Gibbs free energy change for any given reaction (ΔG° ¿ reaction) is
the change under standard conditions of pressure (1 atm), temperature (25°C = 298 K),
and hydrogen ion concentration (pH = 7.0). The concentration of every reactant and
product is 1 M under standard conditions. For biochemical reactions, the concentration
of water is assumed to be 55 M.
The standard Gibbs free energy change in a reaction can be determined by using
tables that list the Gibbs free energies of formation (Δf G° ¿ ) of important biochemical
molecules.
¢G °¿ reaction = ¢ f G °¿ products - ¢ f G °¿ reactants
(10.5)
Keep in mind that Equation 10.5 only applies to the free energy change under standard
conditions where the concentrations of products and reactants are 1 M. It’s also important to use tables that apply to biochemical reactions. These tables correct for pH and
ionic strength. The Gibbs free energies of formation under cellular conditions are often
quite different from the ones used in chemistry and physics.
The actual Gibbs free energy change (ΔG) for a reaction depends on the real concentrations of reactants and products, as described in Section 1.4B. The relationship
between the standard free energy change and the actual free energy change is given by
¢Greaction = ¢G°¿ reaction + RT ln
[products]
[reactants]
(10.6)
For a chemical or physical process, the free energy change is expressed in terms of the
changes in enthalpy (heat content) and entropy (randomness) as the reactants are converted to products at constant pressure and volume.
¢G = ¢H - T¢S
(10.7)
ΔH is the change in enthalpy, ΔS is the change in entropy, and T is the temperature in
degrees Kelvin.
When ΔG for a reaction is negative, the reaction will proceed in the direction it is
written. When ΔG is positive, the reaction will proceed in the reverse direction—there will
be a net conversion of products to reactants. For such a reaction to proceed in the direction written, enough energy must be supplied from outside the system to make the free
energy change negative. When ΔG is zero, the reaction is at equilibrium and there is no
net synthesis of product.
Because changes in both enthalpy and entropy contribute to ΔG, the sum of these
contributions at a given temperature (as indicated in Equation 10.7) must be negative for
a reaction to proceed. Thus, even if ΔS for a particular process is negative (i.e., the products are more ordered than the reactants), a sufficiently negative ΔH can overcome the
decrease in entropy, resulting in a ΔG that is less than zero. Similarly, even if ΔH is positive (i.e., the products have a higher heat content than the reactants), a sufficiently
positive ΔS can overcome the increase in enthalpy, resulting in a negative ΔG. Reactions
that proceed because of a large positive ΔS are said to be entropy driven. Examples of
entropy-driven processes include protein folding (Section 4.10) and the formation
of lipid bilayers (Section 9.8A), both of which depend on the hydrophobic effect
(Section 2.5D). The processes of protein folding and lipid-bilayer formation result in
states of decreased entropy for the protein molecule and bilayer components, respectively. However, the decrease in entropy is offset by a large increase in the entropy of
surrounding water molecules.
For any enzymatic reaction within a living organism, the actual free energy change
(the free energy change under cellular conditions) must be less than zero in order for
10.5 Actual Gibbs Free Energy Change, Not Standard Free Energy Change, Determines the Direction of Metabolic Reactions
the reaction to occur in the direction it is written. Many metabolic reactions have
standard Gibbs free energy changes (ΔG° ¿ reaction) that are positive. The difference
between ΔG and ΔG° ¿ depends on cellular conditions. The most important condition
affecting free energy change in cells is the concentrations of substrates and products of a
reaction. Consider the reaction
A + B Δ C + D
[C][D]
= ¢G°¿ reaction + RT ln Q
[A][B]
[C][D]
a where Q =
b
[A][B]
KEY CONCEPT
Metabolically irreversible reactions are
catalyzed by enzymes whose activity is
regulated in order to prevent the reaction
from reaching equilibrium.
(10.8)
At equilibrium, the ratio of substrates and products is by definition the equilibrium
constant (Keq) and the Gibbs free energy change under these conditions is zero.
[C][D]
(at equilibrium)
Keq =
¢G = 0
(10.9)
[A][B]
When this reaction is not at equilibrium, a different ratio of products to substrates is
observed and the Gibbs free energy change is derived using Equation 10.6.
¢Greaction = ¢G°¿ reaction + RT ln
307
Consider a sample reaction X = Y
under standard conditions of pressure,
temperature, and concentration.
Assume that ΔG ° œ is negative.
X
Y
1M
1M
ΔG ° œ
(10.10)
negative
Inside the cell, the reaction will likely
be at equilibrium and ΔG = 0
X
Q is the mass action ratio. The difference between this ratio and the ratio of products to
substrates at equilibrium determines the actual Gibbs free energy change for a reaction.
In other words, the free energy change is a measure of how far from equilibrium the
reacting system is operating. Consequently, ΔG, not ΔG° ¿ , is the criterion for assessing
the direction of a reaction in a biological system.
We can divide metabolic reactions into two types. Let Q represent the steady-state
ratio of product and reactant concentrations in a living cell. Reactions for which Q is
close to Keq are called near-equilibrium reactions. The free energy changes associated with
near-equilibrium reactions are small, so these reactions are readily reversible. Reactions
for which Q is far from Keq are called metabolically irreversible reactions. These reactions
are greatly displaced from equilibrium, with Q usually differing from Keq by two or
more orders of magnitude. Thus, ΔG is a large negative number for metabolically irreversible reactions.
When flux through a pathway changes by a large amount, there may be short-term
perturbations of metabolite concentrations in the pathway. The intracellular concentrations of metabolites vary, but usually over a range of not more than two- or threefold
and equilibrium is quickly restored. As mentioned above, this is called the steady state
condition and it’s typical of most of the reactions in a pathway. Most enzymes in a pathway catalyze near-equilibrium reactions and have sufficient activity to quickly restore
concentrations of substrates and products to near-equilibrium conditions. They can accommodate flux in either direction. The Gibbs free energy change for these reactions is
effectively zero.
In contrast, the activities of enzymes that catalyze metabolically irreversible reactions are usually insufficient to achieve near-equilibrium status for the reactions. Metabolically irreversible reactions are generally the control points of pathways, and the
enzymes that catalyze these reactions are usually regulated in some way. In fact, the regulation maintains metabolic irreversibility by preventing the reaction from reaching
equilibrium. Metabolically irreversible reactions can act as bottlenecks in metabolic
traffic, helping control the flux through reactions further along the pathway.
Near-equilibrium reactions are not usually suitable control points. Flux through a
near-equilibrium step cannot be significantly increased since it is already operating
under conditions where the concentrations of products and reactants are close to the
equilibrium values. The direction of near-equilibrium reactions can be controlled by
changes in substrate and product concentrations. In contrast, flux through metabolically
irreversible reactions is relatively unaffected by changes in metabolite concentration; flux
through these reactions must be controlled by modulating the activity of the enzyme.
Y
ΔG = 0
(ΔG ° œ negative)
For a reaction in which ΔG ° œ is
positive,
X
Y
1M
1M
ΔG ° œ positive
at equilibrium, the concentration of
reactant will be higher than that of the
product.
X
Y
ΔG = 0
(ΔG ° œ positive)
The standard Gibbs free energy change
does not predict whether a reaction
will proceed in one direction or another.
Instead, it predicts the steady state
concentrations of reactants and products in near-equilibrium reactions.
308
CHAPTER 10 Introduction to Metabolism
Because so many metabolic reactions are near-equilibrium reactions, we have chosen not to emphasize ΔG° ¿ values in our discussions of most reactions. Those values are
not relevant except when they are used to calculate steady state concentrations.
SAMPLE CALCULATION 10.1 Calculating Standard Gibbs Free Energy Change
from Energies of Formation
For any reaction, the standard Gibbs free energy change for the reaction is given by
ΔG° ¿ reaction = Δf G° ¿ products − Δf G° ¿ reactants
For the oxidation of glucose,
(CH2O)6 + 6O2 : 6CO2 + 6H2O
you obtain the standard Gibbs free energies of formation from biochemical tables.
Δf G° ¿ (glucose) = -426 kJ mol-1
Δf G° ¿ (O2) = 0
Δf G° ¿ (CO2) = -394 kJ mol-1
Δf G° ¿ (H2O) = -156 kJ mol-1
ΔG° ¿ reaction = 6(-394) + 6(-156) - (-426)
= -2874 kJ mol-1
Glucose is an energy-rich organic molecule and its oxidation releases a great deal
of energy. Nevertheless, all living cells routinely synthesize glucose from simple
precursors. In many cases, the precursors are CO2 and H2O in the reverse of the
reaction shown here. How do they do it?
Section 7.2 A described the structure
and functions of nucleoside triphosphates.
Another example of the role of
pyrophosphate is discussed in Section 10.7C. Hydrolysis of pyrophosphate is often counted as one ATP
equivalent in terms of energy currency.
Table 10.1 Free Energies of Formation
(Δf G °œ )
kJ mol-1
ATP
-2102
ADP
-1231
AMP
-360
Pi
-1059
H2O
-156
2+
(1 mM Mg~
, ionic strength of 0.25 M)
10.6 The Free Energy of ATP Hydrolysis
ATP contains one phosphate ester formed by linkage of the α-phosphoryl group to the
5 ¿ -oxygen of ribose and two phosphoanhydrides formed by the α,β and β,γ linkages between phosphoryl groups (Figure 10.12). ATP is a donor of several metabolic groups,
usually a phosphoryl group, leaving ADP, or an AMP group, leaving inorganic
pyrophosphate (PPi). Both reactions require the cleavage of a phosphoanhydride linkage. Although the various groups of ATP are not transferred directly to water, hydrolytic
reactions provide useful estimates of the Gibbs free energy changes involved. Table 10.1
lists the free energies of formation of the various reactants and products under standard
conditions, 1 mM Mg2+, and an ionic strength of 0.25 M. Table 10.2 lists the standard
Gibbs free energies of hydrolysis (ΔG° ¿ hydrolysis) for ATP and AMP, and Figure 10.9
shows the hydrolytic cleavage of each of the phosphoanhydrides of ATP. Note from
Table 10.2 that cleavage of the ester releases only 13 kJ mol-1 under standard conditions
but cleavage of either of the phosphoanhydrides releases at least 30 kJ mol-1 under standard conditions.
Table 10.2 also gives the standard Gibbs free energy change for hydrolysis of
pyrophosphate. All cells contain an enzyme called pyrophosphatase that catalyzes this
reaction. The cellular concentration of pyrophosphate is maintained at a very low concentration as a consequence of this highly favorable reaction. This means that the
hydrolysis of ATP to AMP + pyrophosphate will always be associated with a negative
Gibbs free energy change even when the AMP concentration is significant.
Nucleoside diphosphates and triphosphates in both aqueous solution and at the active sites of enzymes are usually present as complexes with magnesium (or sometimes
manganese) ions. These cations coordinate with oxygen atoms of the phosphate groups,
forming six-membered rings. A magnesium ion can form several different complexes
with ATP; the complexes involving the α and β and the β and γ phosphate groups are
shown in Figure 10.13. Formation of the β,γ complex is favored in aqueous solutions.
We will see later that nucleic acids are also usually complexed with counterions such as
10.6 The Free Energy of ATP Hydrolysis
NH 2
O
O
P
O
g
O
P
O
N
O
b
O
P
O
a
O
5‘
CH 2
O
H
H
H
OH
OH
Adenosine 5′ -triphosphate (ATP
H2O
O
P
b
(1)
(2)
O
P
O
H
)
H
O
a
O
O
Adenosine
O
O
P
a
O
Adenosine
O
Adenosine 5‘-diphosphate (ADP
3
)
Adenosine 5‘-monophosphate (AMP
+
2
)
+
O
HO
N
H2O
H
O
4
Figure 10.12
Hydrolysis of ATP to (1) ADP and inorganic
phosphate (Pi) and (2) AMP and inorganic
pyrophosphate (PPi).
᭣
N
N
O
O
P
O
HO
O
P
O
Inorganic phosphate (Pi )
O
Pg
O
O
O
Pb
O
P
O
O
Inorganic pyrophosphate (PPi)
O
O
O
Mg
Pa
O
O
Pg
O
O
Mg
2
Pb
O
Adenosine
a, b complex of MgATP
O
Adenosine
b, g complex of MgATP
O
O
O
O
Pa
O
Table 10.2 Standard Gibbs free energies
of hydrolysis for ATP, AMP, and
pyrophosphate
Reactants
and products
¢G o ¿ hydrolysis
(kJ mol-1)
ATP + H2O :
ADP + Pi + H {
-32
ATP + H2O :
AMP + PPi + H {
-45
AMP + H2O :
Adenosine + Pi + H {
-13
PPi + H2O : 2Pi
-29
2Pi(inorganic phosphate) = HPO4~
3PPi(pyrophosphate) = HP2O7~
Figure 10.13
2+
Complexes between ATP and Mg~
.
᭣
2
O
The release of a free proton in these
reactions depends on the conditions
since the pKa values of the various
components are close to the value
inside cells (see Figure 2.19).
O
2+
Mg~
or cationic proteins. For convenience, we usually refer to the nucleoside triphosphates as adenosine triphosphate (ATP), guanosine triphosphate (GTP), cytidine
triphosphate (CTP), and uridine triphosphate (UTP), but remember that these mole2+
cules actually exist as complexes with Mg~
in cells.
Several factors contribute to the large amount of energy released during hydrolysis
of the phosphoanhydride linkages of ATP.
1. Electrostatic repulsion. Electrostatic repulsion among the negatively charged oxygen atoms of the phosphoanhydride groups of ATP is less after hydrolysis. [In cells,
2+
ΔG° ¿ hydrolysis is actually increased (made more positive) by the presence of Mg~
,
which partially neutralizes the charges on the oxygen atoms of ATP and diminishes
electrostatic repulsion.]
2. Solvation effects. The products of hydrolysis, ADP and inorganic phosphate, or
AMP and inorganic pyrophosphate, are better solvated than ATP itself. When ions
O
309
310
CHAPTER 10 Introduction to Metabolism
A quantitative definition of a “high
energy” compound is presented in
Section 10.7A.
KEY CONCEPT
The large free energy change associated
with hydrolysis of ATP is only possible if
the system is far from equilibrium.
are solvated, they are electrically shielded from each other. Solvation effects are
probably the most important factor contributing to the energy of hydrolysis.
3. Resonance stabilization. The products of hydrolysis are more stable than ATP.
The electrons on terminal oxygen atoms are more delocalized than those on bridging oxygen atoms. Hydrolysis of ATP replaces one bridging oxygen atom with two
new terminal oxygen atoms.
Because of the free energy change associated with the cleavage of their phosphoanhydrides, ATP and the other nucleoside triphosphates (UTP, GTP, and CTP) are often
referred to as energy-rich compounds, but keep in mind that it’s the system, not the molecule, that contributes free energy to biochemical reactions. ATP, by itself, is not really a
high energy compound. It can only work if the system (reactants and products) is far
from equilibrium. The ATP currency becomes worthless if the reaction reaches equilibrium and ΔG = 0. We will find it useful to refer to “energy-rich” or “high energy” molecules in the jargon of biochemistry but we will put the terms in quotation marks to remind you that it is jargon.
All the phosphoanhydrides of nucleoside triphosphates have nearly equal standard
Gibbs free energies of hydrolysis. We occasionally express the consumption or formation
of the phosphoanhydride linkages of nucleoside triphosphates in terms of ATP equivalents.
ATP is usually the phosphoryl group donor when nucleoside monophosphates and
diphosphates are phosphorylated. Of course, the intracellular concentrations of individual nucleoside mono-, di-, and triphosphates differ, depending on metabolic needs.
For example, the intracellular levels of ATP are far greater than deoxythymidine
triphosphate (dTTP) levels. ATP is involved in many reactions, whereas dTTP has fewer
functions and is primarily a substrate for DNA synthesis.
A series of kinases (phosphotransferases) catalyze interconversions of nucleoside
mono-, di-, and triphosphates. Phosphoryl group transfers between nucleoside phosphates have equilibrium constants close to 1.0. Nucleoside monophosphate kinases are
a group of enzymes that catalyze the conversion of nucleoside monophosphates to
nucleoside diphosphates. For example, guanosine monophosphate (GMP) is converted
to guanosine diphosphate (GDP) by the action of guanylate kinase. GMP or its deoxy
analog dGMP is the phosphoryl group acceptor in the reaction, and ATP or dATP is the
phosphoryl group donor.
GMP + ATP Δ
GDP + ADP
(10.11)
Nucleoside diphosphate kinase acts in the conversion of nucleoside diphosphates
to nucleoside triphosphates. This enzyme, present in both the cytosol and mitochondria
of eukaryotes, is much less specific than nucleoside monophosphate kinases. All nucleoside diphosphates, regardless of the purine or pyrimidine base, are substrates for nucleoside diphosphate kinase. Nucleoside monophosphates are not substrates. Because of
its relative abundance, ATP is usually the phosphoryl-group donor in cells:
GDP + ATP Δ
Table 10.3 Theoretical changes in
concentrations of adenine
nucleotides
ATP
ADP
AMP
(mM)
(mM)
4.8
0.2
0.004
4.5
0.5
0.02
3.9
1.0
0.11
3.2
1.5
0.31
(mM)
[Adapted from Newsholme. E. A., and Leech, A. R.
(1986). Biochemistry for the Medical Science (New
York: John Wiley & Sons), p. 315.]
GTP + ADP
(10.12)
Although the concentration of ATP varies among cell types, the intracellular ATP
concentration fluctuates very little within a particular cell, and the sum of the concentrations of the adenine nucleotides remains nearly constant. Intracellular ATP concentrations are maintained in part by the action of adenylate kinase that catalyzes the following near-equilibrium reaction:
AMP + ATP Δ
2 ADP
(10.13)
When the concentration of AMP increases, AMP can react with ATP to form two molecules of ADP. These ADP molecules can be converted to two molecules of ATP. The
overall process is
AMP + ATP + 2 Pi Δ
2 ATP + 2 H2O
(10.14)
ATP concentrations in cells are greater than ADP or AMP concentrations, and relatively minor changes in the concentration of ATP can result in large changes in the concentrations of the di- and monophosphates. Table 10.3 shows the theoretical increases in
10.6 The Free Energy of ATP Hydrolysis
311
[ADP] and [AMP] under conditions in which ATP is consumed, assuming that the total
adenine nucleotide concentration remains 5.0 mM. Note that when the ATP concentration decreases from 4.8 mM to 4.5 mM (a decrease of about 6%), the ADP concentration
increases 2.5-fold and the AMP concentration increases 5-fold. In fact, when cells are well
supplied with oxidizable fuels and oxygen, they maintain a balance of adenine nucleotides
in which ATP is present at a steady concentration of 2 to 10 mM, [ADP] is less than 1 mM,
and [AMP] is even lower. As we will see, ADP and AMP are often effective allosteric modulators of some energy-yielding metabolic processes. ATP, whose concentration is relatively constant, is generally not an important modulator under physiological conditions.
One important consequence of the concentrations of ATP and its hydrolysis products in vivo is that the free energy change for ATP hydrolysis is actually greater than the
standard value of -32 kJ mol-1. This is illustrated in Sample Calculation 10.2 using
measured concentrations of ATP, ADP, and Pi from rat liver cells. The calculated Gibbs
free energy change is close to the value determined in many other types of cells.
As mentioned above, ATP hydrolysis is an example of a metabolically irreversible
reaction. The activities of various enzymes are regulated so they become inactive as ATP
concentrations fall below a minimal threshold. Thus, the reverse of the hydrolysis reaction, leading to ATP synthesis, does not occur except under special circumstances
(Chapter 14). We will see in Chapter 14 that ATP is synthesized by another pathway.
The importance of maintaining a high concentraion of ATP cannot be overemphasized. It is required in order to get a large free energy change from ATP hydrolysis. Cells
will die if the reactants and products reach equilibrium.
10.7 The Metabolic Roles of ATP
The energy produced by one biological reaction or process, such as the synthesis of
X ¬ Y in Reaction 10.15, is often coupled to a second reaction, such as the hydrolysis
of ATP. The first reaction would not otherwise occur spontaneously.
X + Y Δ
ATP + H2O Δ
X¬Y
ADP + Pi + H ᮍ
(10.15)
SAMPLE CALCULATION 10.2 Gibbs Free Energy Change
Q: In a rat hepatocyte, the concentrations of ATP, ADP, and
Pi are 3.4 mM, 1.3 mM, and 4.8 mM, respectively. Calculate
the Gibbs free energy change for hydrolysis of ATP in this cell.
How does this compare to the standard free energy change?
A: The actual Gibbs free energy change is calculated according to Equation 10.10.
¢Greaction = ¢G°¿reaction + RT ln
3ADP43Pi4
3ATP4
= ¢G°reaction + 2.303 RT log
3ADP43Pi4
3ATP4
When known values and constants are substituted (with concentrations expressed as molar values), assuming pH7.0 and 25°C.
(1.3 * 10-3)(4.8 * 10-3)
¢G = -32000 J mol-1 + (8.31 JK-1mol-1)(298 K) c2.303 log
d
(3.4 * 10-3)
¢G = -32000 J mol-1 + (2480 J mol-1) 32.303 log (1.8 * 10-3)4
¢G = -32000 J mol-1 - 16 000 J mol-1
¢G = -48 000 J mol-1 = -48 kJ mol-1
The actual free energy change is about 11/2 times the standard free energy change.
312
CHAPTER 10 Introduction to Metabolism
The sum of the Gibbs free energy changes for the coupled reactions must be negative
for the reactions to proceed. This does not mean that both of the individual reactions
have to be favored in isolation (ΔG < 0). The advantage of coupled reactions is that the
energy released from one of them can be used to drive the other even when the second
reaction is unfavorable by itself (ΔG > 0). (Recall that the ability to couple reactions is
one of the key properties of enzymes.)
Energy flow in metabolism depends on many coupled reactions involving ATP. In
many cases, the coupled reactions are linked by a shared intermediate such as a phosphorylated derivative of reactant X.
X + ATP Δ
X ¬ P + Y + H2O Δ
X ¬ P + ADP
X ¬ Y + Pi + H ᮍ
(10.16)
Transfer of either a phosphoryl group or a nucleotidyl group to a substrate
activates that substrate (i.e., prepares it for a reaction that has a large negative Gibbs
free energy change). The activated compound 1X ¬ P2, can be either a metabolite or
the side chain of an amino acid residue in the active site of an enzyme. The intermediate
then reacts with a second substrate to complete the reaction.
A. Phosphoryl Group Transfer
The synthesis of glutamine from glutamate and ammonia illustrates how the “high
energy” compound ATP drives a biosynthetic reaction. This reaction, catalyzed by glutamine synthetase, allows organisms to incorporate inorganic nitrogen into biomolecules
as carbon-bound nitrogen. In this synthesis of an amide bond, the γ-carboxyl group of
the substrate is activated by synthesis of an anhydride intermediate.
Glutamine synthetase catalyzes the nucleophilic displacement of the γ-phosphoryl
group of ATP by the γ-carboxylate of glutamate. ADP is released, producing enzymebound γ-glutamyl phosphate as an intermediate (Figure 10.14). γ-Glutamyl phosphate is
unstable in aqueous solution but is protected from water in the active site of glutamine
synthetase. In the second step of the mechanism, ammonia acts as a nucleophile, displacing the phosphate (a good leaving group) from the carbonyl carbon of γ-glutamyl
phosphate to generate the product, glutamine. Overall, one molecule of ATP is converted
to ADP + Pi for every molecule of glutamine formed from glutamate and ammonia.
BOX 10.1 THE SQUIGGLE
Fritz Lipmann (1899–1986) won the Nobel Prize in Physiology and Medicine in 1953
for discovering coenzyme A. He also made important contributions to our understanding of ATP as an energy currency. In 1941 he introduced the idea of a high
energy bond in ATP by drawing it as a squiggle (~). For the next several decades,
biochemistry textbooks often depicted ATP with two high energy bonds.
AMP~P~P
We know now that this depiction is misleading since there’s nothing special
about the covalent bonds in phosphoanhydride linkages. It’s the overall system of reactants and products that makes the ATP currency so valuable and not the energy of
individual bonds. However, it’s true that the three main explanations for the high energy of ATP (electrostatic repulsion, solvation effects, and resonance stabilization) are
due mostly to the phosphoanhydride linkages so the focus on that particular linkage
isn’t entirely wrong. The squiggle used to be very common in the older scientific literature and in textbooks but it’s much less common today.
Source: Lipmann, F. (1941) Metabolic generation and utilization of phosphate bond energy. Advances in
Enzymology 1:99–162.
10.7 The Metabolic Roles of ATP
COO
H3 N
C
COO
H3 N
H
ATP
CH 2
COO
H
H3 N
NH 3
CH 2
CH 2
ADP
O
O
Glutamate
O
H
CH 2
O
C
C
CH 2
CH 2
C
O
C
313
P
Pi
O
C
O
NH 2
Glutamine
O
g-Glutamyl phosphate
(10.17)
We can calculate the predicted standard Gibbs free energy change for the reaction
that is not coupled to ATP hydrolysis.
Glutamate + NH4ᮍ Δ
glutamine + H2O
¢G°¿ reaction = +14 kJ mol
(10.18)
-1
This is a standard free energy change so it doesn’t necessarily reflect the actual Gibbs
free energy change given cellular concentrations of glutamate, glutamine, and ammonia. The hypothetical Reaction 10.18 might be associated with a negative free energy
change inside the cell if the concentrations of glutamate and ammonia were high relative to the concentration of glutamine. But this is not the case. The steady-state concentrations of glutamate and glutamine must be kept nearly equivalent in order to support
protein synthesis and other metabolic pathways. This means that the Gibbs free energy
change for the hypothetical Reaction 10.18 cannot be negative. Furthermore, the concentration of ammonia is very low relative to glutamate and glutamine. In both bacteria
and eukaryotes, ammonia must be efficiently incorporated into glutamine even when
the concentration of free ammonia is very low. Thus Reaction 10.18 is not possible in
living cells due to the requirement for a high steady-state concentration of glutamine
and due to a limiting supply of ammonia. Glutamine synthesis must be coupled to
hydrolysis of ATP in order to drive it in the right direction.
Glutamine synthetase catalyzes a phosphoryl group transfer reaction in which the
phosphorylated compound is a transient intermediate (Reaction 10.17). There are other
reactions that produce a stable phosphorylated product. As we have seen, kinases catalyze
Figure 10.14
Glutamine synthetase bound to ADP and a transition state analog. Glutamine synthetase
from Mycobacterium tuberculosis is a complex enzyme consisting of two hexameric
rings on top of each other. Only one ring is
shown in this figure. The active site is occupied by ADP and a transition state analog
(L-methionine-S-sulfoximine phosphate) that
resembles γ-glutamyl phosphate.
[PDB 2BVC]
᭣
314
CHAPTER 10 Introduction to Metabolism
Table 10.4 Standard Gibbs free energies
of hydrolysis for common
metabolites
Metabolite
¢G o ¿ hydrolysis
(kJ mol-1)
Phosphoenolpyruvate
-62
1, 3-Bisphosphoglycerate
-49
ATP to AMP + PPi
-45
Phosphocreatine
-43
Phosphoarginine
-32
Acetyl CoA
-32
Acyl CoA
-31
ATP to ADP + Pi
-32
Pyrophosphate
-29
Glucose 1-phosphate
-21
Glucose 6-phosphate
-14
Glycerol 3-phosphate
-9
KEY CONCEPT
Many phosphorylated metabolites have
group transfer potentials similar to that
of ATP.
transfer of the γ-phosphoryl group from ATP (or, less frequently, from another nucleoside triphosphate) to another substrate. Kinases typically catalyze metabolically irreversible reactions. A few kinase reactions, however, such as those catalyzed by adenylate
kinase (Reaction 10.13) and creatine kinase (Section 10.7B), are near equilibrium reactions.
Although the reactions they catalyze are sometimes described as phosphate group trans2fer reactions, kinases actually transfer a phosphoryl group (—PO3~
—)to their acceptors.
The ability of a phosphorylated compound to transfer its phosphoryl group(s) is
termed its phosphoryl group transfer potential, or simply group transfer potential. Some
compounds, such as phosphoanhydrides, are excellent phosphoryl group donors. They
may have a group transfer potential equal to or greater than that of ATP. Other compounds, such as phosphoesters, are poor phosphoryl group donors. They have a group
transfer potential less than that of ATP. Under standard conditions, group transfer potentials have the same values as the standard free energies of hydrolysis but are opposite in
sign. Thus, the group transfer potential is a measure of the free energy required for formation of the phosphorylated compound. In Table 10.4 we list the standard Gibbs free
energy of hydrolysis for a number of phosphorylated compounds.
B. Production of ATP by Phosphoryl Group Transfer
Often, one kinase catalyzes transfer of a phosphoryl group from an excellent donor to
ADP to form ATP, which then acts as a donor for a different kinase reaction. Phosphoenolpyruvate and 1,3-bisphosphoglycerate are two examples of common metabolites
that have higher energy than ATP even under conditions found inside the cell (ΔG <
-50 kJ mol-1). Some of these compounds are intermediates in catabolic pathways; others are energy storage compounds.
Phosphoenolpyruvate, an intermediate in the glycolytic pathway, has the highest
phosphoryl group transfer potential known. The standard free energy of phosphoenolpyruvate hydrolysis is -62 kJ mol-1 and the actual Gibbs free energy change is comparable to that of ATP. The free energy of hydrolysis for phosphoenolpyruvate can be
understood by picturing the molecule as an enol whose structure is locked by attachment of the phosphoryl group. When the phosphoryl group is removed, the molecule
spontaneously forms the much more stable keto tautomer (Figure 10.15). Transfer of
the phosphoryl group from phosphoenolpyruvate to ADP is catalyzed by the enzyme
pyruvate kinase. Because the ΔG° ¿ for the reaction is about -30 kJ mol-1, the equilibrium for this reaction under standard conditions lies far in the direction of transfer of
the phosphoryl group from phosphoenolpyruvate to ADP. In cells, this metabolically
irreversible reaction is an important source of ATP.
Phosphagens, including phosphocreatine and phosphoarginine, are “high energy”
phosphate storage molecules found in animal muscle cells. Phosphagens are phosphoamides (rather than phosphoanhydrides) and have higher group transfer potentials
than ATP. In the muscles of vertebrates, large amounts of phosphocreatine are formed
during times of ample ATP supply. In resting muscle, the concentration of phosphocreatine is about fivefold higher than that of ATP. When ATP levels fall, creatine kinase catalyzes rapid replenishment of ATP through transfer of the activated phosphoryl group
from phosphocreatine to ADP.
Creatine
kinase
Phosphocreatine + ADP Δ creatine + ATP
(10.19)
The supply of phosphocreatine is adequate for 3- to 4-second bursts of activity, long enough
for other metabolic processes to begin restoring the ATP supply. Under cellular conditions,
the creatine kinase reaction is a near-equilibrium reaction. In many invertebrates—
notably mollusks and arthropods—phosphoarginine is the source of the activated
phosphoryl group.
Because ATP has an intermediate phosphoryl group transfer potential, it is thermodynamically suited as a carrier of phosphoryl groups. (Figure 10.15) ATP is also
kinetically stable under physiological conditions until acted on by an enzyme so it can
carry chemical potential energy from one enzyme to another without being hydrolyzed.
Not surprisingly, ATP mediates most chemical energy transfers in all organisms.
10.7 The Metabolic Roles of ATP
COO
O
C
P
O
C
ADP
ATP
O
Pyruvate kinase
O
C
C
O
C
H
C
H
H
COO
H
Phosphoenolpyruvate
H
H
Figure 10.15
Transfer of the phosphoryl group from phosphoenolpyruvate to ADP.
᭣
COO
OH
315
H
Pyruvate
Enolpyruvate
COO
C. Nucleotidyl Group Transfer
CH 2
The other common group transfer reaction involving ATP is transfer of the nucleotidyl
group. An example is the synthesis of acetyl CoA, catalyzed by acetyl-CoA synthetase. In
this reaction, the AMP moiety of ATP is transferred to the nucleophilic carboxylate
group of acetate to form an acetyl–adenylate intermediate (Figure 10.16). Note that
pyrophosphate (PPi) is released in this step. Like the glutamyl–phosphate intermediate
in Reaction 10.17, the reactive intermediate is shielded from nonenzymatic hydrolysis
by tight binding within the active site of the enzyme. The reaction is completed by
transfer of the acetyl group to the nucleophilic sulfur atom of coenzyme A, leading to
the formation of acetyl CoA and AMP.
The synthesis of acetyl CoA also illustrates how the removal of a product can cause
a metabolic reaction to approach completion, just as the formation of a precipitate or
a gas can drive an inorganic reaction toward completion. The standard Gibbs free
energy for the formation of acetyl CoA from acetate and CoA is about -13 kJ mol-1
(ΔG° ¿ hydrolysis of acetyl CoA = -32 kJ mol-1). But note that the product PPi is hydrolyzed to two molecules of Pi by the action of pyrophosphatase (Section 10.6). Almost all cells have high levels of activity of this enzyme, so the concentration of PPi in
cells is generally very low (less than 10-6 M). Cleavage of PPi contributes to the negative
value of the standard Gibbs free energy change for the overall reaction. The additional
hydrolytic reaction adds the energy cost of one phosphoanhydride linkage to the overall
synthetic process. In reactions such as this, we say that the cost is two ATP equivalents in
order to emphasize that two “high energy” compounds are hydrolyzed. Hydrolysis of
pyrophosphate accompanies many synthetic reactions in metabolism.
Acetate
O
H 3C
C
O
O
P
O
N
O
C
N
H
H2N
P
O
O
Phosphocreatine
COO
C
H3N
H
(CH 2 ) 3
NH
O
C
H2N
N
H
P
O
O
Phosphoarginine
Structures of phosphocreatine and
phosphoarginine.
᭡
O
O
O
H3C
O
P
O
O
P
O
O
Adenosine
(1)
C
H3C
O
O
P
H2O
O
Adenosine
O
O
H
ATP
S CoA
Enzyme-bound
acetyl–adenylate
intermediate
(2)
(3)
O
H3C
C
Acetyl CoA
O
O
H3C
S CoA
AMP
᭡ Figure 10.16
Synthesis of acetyl CoA from acetate, catalyzed by acetyl-CoA synthetase.
C
H
O
P
S CoA O
O
Adenosine
+
PPi
Pyrophosphatase
2Pi
316
CHAPTER 10 Introduction to Metabolism
10.8 Thioesters Have High Free
Energies of Hydrolysis
Thioesters are another class of “high energy” compounds forming part of the currency
of metabolism. Acetyl CoA is one example. It occupies a central position in metabolism
(Figures 10.8 and 10.9). The high energy of thioester reactions can be used in generating ATP equivalents or in transferring the acyl groups to acceptor molecules. Recall that
acyl groups are attached to coenzyme A (or acyl carrier protein) via a thioester linkage
(Section 7.6 and Figure 7.13).
O
‘
R ¬ C ¬ S ¬ Coenzyme A
(10.20)
Unlike oxygen esters of carboxylic acids, thioesters resemble carboxylic acid anhydrides in reactivity. Sulfur is in the same group of the periodic table as oxygen but
thioesters are less stable than typical esters because the unshared electrons of the sulfur
atom are not as effectively delocalized in a thioester as the unshared electrons in an oxygen ester. The energy associated with hydrolyzing the thioester linkage is similar to the
energy of hydrolysis of the phosphoanhydride linkages in ATP. The standard Gibbs free
energy change for hydrolysis of acetyl CoA is -31 kJ mol-1, and the actual change may
somewhat smaller (more negative) under conditions inside the cell.
O
KEY CONCEPT
Reactions involving thioesters, such as
acetyl CoA, release amounts of energy
comparable to that of ATP hydrolysis.
C
H3C
O
H 2 O HS CoA
S CoA
H3C
Acetyl CoA
C
O
+ H
(10.21)
Acetate
Despite its high free energy of hydrolysis, a CoA thioester resists nonenzymatic hydrolysis
at neutral pH values. In other words, it is kinetically stable in the absence of appropriate
catalysts.
The high energy of hydrolysis of a CoA thioester is used in the fifth step of the citric acid cycle, when the thioester succinyl CoA reacts with GDP (or sometimes ADP)
and Pi to form GTP (or ATP).
COO
CH 2
+
CH 2
We discuss succinyl CoA synthetase in
Section 13.4, part 5, and fatty acid
synthesis in Section 16.5.
C
COO
O
S CoA
GDP + Pi
CH 2
CH 2
+ GTP + HS CoA
COO
(10.22)
Succinate
Succinyl CoA
This substrate-level phosphorylation conserves energy used in the formation of
succinyl CoA as ATP equivalents. The energy of thioesters also drives the synthesis of
fatty acids.
10.9 Reduced Coenzymes Conserve Energy
from Biological Oxidations
In Section 14.11 we will learn that
NADH is equivalent to 2.5 ATPs and
QH2 is equivalent to 1.5 ATPs.
Many reduced coenzymes are “high energy” compounds in the sense we described earlier (i.e., part of a system). Their high energy (or reducing power) can be donated in
oxidation-reduction reactions. The energy of reduced coenzymes may be represented as
ATP equivalents since their oxidation can be coupled to the synthesis of ATP.
10.9 Reduced Coenzymes Conserve Energy from Biological Oxidations
317
As described in Section 6.1C, the oxidation of one molecule must be coupled with
the reduction of another molecule. A molecule that accepts electrons and is reduced is
an oxidizing agent. A molecule that loses electrons and is oxidized is a reducing agent.
The net oxidation–reduction reaction is
Ared + Box Δ
Aox + Bred
(10.23)
The electrons released in biological oxidation reactions are transferred enzymatically to oxidizing agents, usually a pyridine nucleotide (NAD ᮍ or sometimes NADP ᮍ ),
a flavin coenzyme (FMN or FAD), or ubiquinone (Q). When NAD ᮍ and NADP ᮍ are
reduced, their nicotinamide rings accept a hydride ion (Figure 7.8). One electron is lost
when a hydrogen atom (composed of one proton and one electron) is removed and two
electrons are lost when a hydride ion (composed of one proton and two electrons) is
removed. (Remember that oxidation is loss of electrons.)
NADH and NADPH, along with QH2, supply reducing power. FMNH2 and FADH2
are reduced enzyme-bound intermediates in some oxidation reactions.
The structures and functions of
NAD ᮍ and NADP ᮍ are discussed
in Section 7.4, of FMN and FAD in
Section 7.5, and of ubiquinone
in Section 7.14.
A. Gibbs Free Energy Change Is Related to Reduction Potential
The reduction potential of a reducing agent is a measure of its thermodynamic reactivity.
Reduction potential can be measured in electrochemical cells. An example of a simple
inorganic oxidation–reduction reaction is the transfer of a pair of electrons from a zinc
2+
atom (Zn) to a copper ion 1Cu~
2.
Zn + Cu~ Δ
2+
Zn~ + Cu
2+
(10.24)
This reaction can be carried out in two separate solutions that divide the overall reaction
into two half-reactions (Figure 10.17). At the zinc electrode, two electrons are given up
by each zinc atom that reacts (the reducing agent). The electrons flow through a wire to
2+
the copper electrode, where they reduce Cu~
(the oxidizing agent) to metallic copper. A
salt bridge, consisting of a tube with a porous partition filled with electrolyte, preserves
electrical neutrality by providing an aqueous path for the flow of nonreactive counterions between the two solutions. The flow of ions and the flow of electons are separated
in such an electrochemical cell and electron flow through the wire (i.e., electric energy)
can be measured using a voltmeter.
The direction of the current through the circuit in Figure 10.17 indicates that Zn is
more easily oxidized than Cu (i.e., Zn is a stronger reducing agent than Cu). The reading
on the voltmeter represents a potential difference, the difference between the reduction
potential of the reaction on the left and that on the right. The measured potential difference is the electromotive force.
Voltmeter
e
e
lt bridge
Sa
Zn
Cu
Figure 10.17
Diagram of an electrochemical cell. Electrons
flow through the external circuit from the
zinc electrode to the copper electrode. The
salt bridge permits the flow of counterions
(sulfate ions in this example) without extensive mixing of the two solutions. The electromotive force is measured by the voltmeter
connected across the two electrodes. (Two
other kinds of salt bridges are shown in
Section 2.5A.)
᭣
2
2
Zn
2
SO4
Zn
Zn
2
+ 2e
Cu
2
SO4
Cu
2
+ 2e
Cu
318
CHAPTER 10 Introduction to Metabolism
KEY CONCEPT
All standard reduction potentials are
measured relative to the reduction of H ᮍ
under standard conditions.
KEY CONCEPT
ΔE must be positive for an oxidation
reduction reaction to proceed in the
direction written.
It is useful to have a reference standard for measurements of reduction potentials
just as in measurements of Gibbs free energy changes. For reduction potentials, the reference is not simply a set of reaction conditions, but a reference half-reaction to which
all other half-reactions can be compared. The reference half-reaction is the reduction of
H ᮍ to hydrogen gas (H2). The reduction potential of this half-reaction under standard
conditions (E°) is arbitrarily set at 0.0 V. The standard reduction potential of any other
half-reaction is measured with an oxidation–reduction coupled reaction in which the
reference half-cell contains a solution of 1 M H ᮍ and 1 atm H2 (gaseous), and the sample half-cell contains 1 M each of the oxidized and reduced species of the substance
whose reduction potential is to be determined. Under standard conditions for biological measurements, the hydrogen ion concentration in the sample half-cell is (10-7M).
The voltmeter across the oxidation–reduction couple measures the electromotive force,
or the difference in the reduction potential, between the reference and sample halfreactions. Since the standard reduction potential of the reference half-reaction is 0.0 V,
the measured potential is that of the sample half-reaction.
Table 10.5 gives the standard reduction potentials at pH 7.0 (E° ¿ ) of some important
biological half-reactions. Electrons flow spontaneously from the more readily oxidized
Table 10.5 Standard reduction potentials of some important biological half-reactions
E° œ (V)
Reduction half-reaction
Acetyl CoA + CO2 + H ᮍ + 2e ᮎ : Pyruvate + CoA
3+
~
Ferredoxin (spinach). Fe
+ e
ᮎ
2+
~
: Fe
-0.43
2 H ᮍ + 2e ᮎ : H2 (at pH 7.0)
a-Ketoglutarate + CO2 + 2
-0.42
Hᮍ
+ 2e
ᮎ
: Isocitrate
Lipoyl dehydrogenase (FAD) + 2 H ᮍ + 2e ᮎ : Lipoyl dehydrogenase (FADH2)
NADP ᮍ
+
Hᮍ
+ 2e
ᮎ
: NADPH
Lipoic acid + 2
+ 2e
ᮎ
: Dihydrolipoic acid
Hᮍ
+ 2e : 2 Glutathione 1reduced2
ᮎ
FAD + 2 H ᮍ + 2e ᮎ : FADH2
FMN + 2
Hᮍ
+ 2e
ᮎ
: FMNH2
Pyruvate + 2
+ 2e
ᮎ
-0.18
+ e
ᮎ
2+
~
: Fe
Fumarate + 2 H ᮍ + 2e ᮎ : Succinate
3+
~
Cytochrome b (mitochondrial), Fe
2+
3+
~
~
+ e ᮎ : Fe
+ e
3+
~
Cytochrome a, Fe +
3+
~
Cytochrome ƒ, Fe +
Plastocyanin, Cu
2+
ᮎ
+ e
2+
~
: Fe
2+
~
e : Fe
2+
~
e ᮎ : Fe
+ e
ᮎ
ᮎ
: Cu
+
NO3ᮎ + 2 H ᮍ + 2e ᮎ : NO2ᮎ + H2O
-0.17
0.02
0.03
Ubiquinone (Q) + 2 H ᮍ + 2e ᮎ : QH2
3+
~
Cytochrome c, Fe
-0.23
-0.20
: Lactate
3+
~
(microsomal). Fe
Cytochrome c1, Fe
-0.28
-0.22
Oxaloacetate + 2 H ᮍ + 2e ᮎ : Malate
Cytochrome b5
-0.29
-0.22
Acetaldehyde + 2 H ᮍ + 2e ᮎ : Ethanol
Hᮍ
-0.34
-0.32
Thioredoxin (oxidized) + 2H { + 2e : Thioredoxin (reduced)
Glutathione 1oxidized2 + 2
-0.38
-0.32
NAD ᮍ + H ᮍ + 2e ᮎ : NADH
Hᮍ
-0.48
ᮎ
2+
~
: Fe
0.04
0.08
0.22
0.23
0.29
0.36
0.37
0.42
Photosystem I (P700)
0.43
+ e ᮎ : Fe
0.77
3+
~
Fe
2+
~
1
2 O2 + 2 H ᮍ + 2e ᮎ : H2O
0.82
Photosystem II (P680)
1.1