Relationship between nutrition status and diabetes treatment in elderly diabetic outpatients
Bạn đang xem bản rút gọn của tài liệu. Xem và tải ngay bản đầy đủ của tài liệu tại đây (197.28 KB, 5 trang )
Journal of military pharmaco-medicine No7-2016
RELATIONSHIP BETWEEN NUTRITION STATUS AND
DIABETES TREATMENT IN ELDERLY DIABETIC OUTPATIENTS
Nguyen Xuan Thanh*; Nguyen Ngoc Tam**
Vu Xuan Nghia***; Vu Thi Thanh Huyen*
SUMMARY
Objectives: To measure the malnutrition prevalence in elderly outpatients with diabetes and
to determine the relationship between nutritional status and duration of diabetes and treatment
therapy. Methods: 158 elderly outpatients with diabetes were included in a descriptive crosssectional study. The designed questionnaire was used to obtain information. Malnutrition was
assessed with the Mini Nutritional Assessment (MNA) tool. Results: The age ranged from 60 to
92 with the mean of 69.52 ± 6.76. The female/male ratio was 1.63. 29.1% of elderly outpatient
diabetes had risk of malnutrition, and 1.9% of them had malnutrition. No correlation between
nutritional status and duration of diabetes and treatment therapy was found. Consclusion:
The results of the study provided the high prevalence of risks of malnutrition among elderly
outpatients with diabetes, no correlation between nutritional status and duration of diabetes and
treatment therapy was found. MNA-SF is useful to screen risk of malnutrition.
* Key words: Diabetes; Nutrition; Elderly; Treatment.
INTRODUCTION
Diabetes is becoming a huge and
growing problem worldwide and impacts
on different groups of age, especially the
older people. The epidemic of diabetes
continues to increase at an alarming rate
throughout the world. Globally, 387 million
people have diabetes; by 2035, this will
have risen to 592 million [1]. Malnutrition
is more common and increasing in the
older population. In the US, about 16% of
those over 65 years and 2% of those over
85 years living in the community are
undernourished [2]. These figures are
predicted to rise dramatically in the next
30 years. Malnutrition is associated with a
decline in functional status, impaired
muscle function, decreased bone mass,
immune dysfunction, anemia, reduced
cognitive function, poor wound healing,
delayed recovering from surgery, higher
hospital and readmission rate, and mortality
[3]. Several investigations demonstrated
that diabetes in the elderly increases the
risk of suboptimal nutrition. The association
between under nutrition, length of stay
and treatment therapy was found in some
researches [4].
In Vietnam, few researches on malnutrition
status in diabetic patients addressed to
elderly subjects. Therefore, we conducted
this study to measure the malnutrition
prevalence in elderly outpatients with
diabetes and to determine the correlation
between nutritional status, duration of
diabetes and treatment therapy.
* Hanoi Medical University
* National Institute of Gerontology
*** Military Medical University
Corresponding author: Vu Thi Thanh Huyen ()
48
Journal of military pharmaco-medicine No7-2016
PATIENTS AND METHODS
1. Patients.
The outpatients included into this study
were at the age of 60 years or older,
diagnosed with diabetes according to IDF’s
criteria 2013 [6], treated as out-patient
from August 7 to November 1, 2015 at
National Geriatric Hospital, Hanoi. Patients
who could not complete the questionnaire or
refused to participate into the study were
excluded.
2. Methods.
Data were collected by face-to-face
interview using the designed questionnaire.
The collected data included age, gender,
duration of diabetes, treatment therapy.
The Mini-Nutritional Assessment short-form
(MNA-SF) was used to assess nutritional
status of the participants. It contained 6
items about food intake, weight loss, mobility,
psychological stress or acute disease,
neuropsychological problems and BMI.
Patients were scored according to the
tool’s guideline. The score ranged from 0
to 14. The results were assigned into 3
groups: malnourished (0 - 7 points), at risk
of malnutrition (8 - 11 points) and normal
nutritional status (12 - 14 points). Height and
weight were measured for BMI calculating,
using the same type of mechanical height
and weight scale in the National Geriatric
Hospital. Participants removed shoes,
heavy outer clothing, hats, and barrettes
before the measurement. Height results
were recorded to the nearest centimeter
and weight was recorded to the nearest
0.1 kg. BMI was calculated using the formula:
BMI = weight (kg)/height2 (m2).
3. Statistical analysis.
This is a descriptive cross-sectional
study. Data was analyzed using Statistical
Package for Social Sciences (SPSS) version
21.0 computer software. Means and standard
deviations (SDs) were reported for continuos
variables and proportions for categorical
variables. Inferential statistics were done
to perform comparisons between nutritional
status and other factors, using χ2 test.
Difference was considered to be significant
if the p-value was below 0.05.
RESULTS AND DISCUSSION
During the period from August 7th to
November 1st 2015, 158 patients who met
the criteria were included in the study.
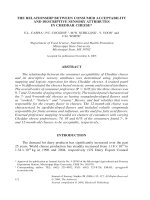
Figure 1: Gender distribution (n = 158).
Of 158 participants, female patients
accounted for 62%, which was significantly
higher than males. The female/male ratio
was 1.63. The result was similar to the
other researches conducted at National
Geriatric Hospital with the corresponding
proportions of male and female of 40% and
60%. The reason is that both researches
were conducted in the same setting.
49
Journal of military pharmaco-medicine No7-2016
the ages of 40 and 64 years [8]. In addition,
the study population in this study is elderly
diabetes, who had experienced diabetes
for a long time.
Figure 2: Age distribution (n = 158).
The figure 2 showed that a group of 60
to 69 years old accounted for the highest
proportion (53.2%), followed by the age of
70 to 79 years old (38.6%) and participants
aged 80 and older (8.2%). Age of participants
ranged from 60 to 92, mean age was
69.52 ± 6.76, which was lower than the
study by Julia et al with participants aged
75 and older [7].
Figure 4: Treatment therapy (n = 158).
The elderly in our study had experienced
diabetes for a long time, but oral medications
were the most popular treatment (50%).
Combination of pills and insulin was used
by 33.5% of patients.
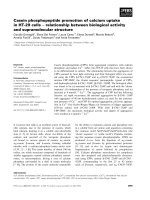
Figure 5: Nutritional status (n = 158).
Figure 3: Duration of diabetes (n = 158).
Half of participants (51.9%) were diagnosed
with diabetes more than 10 years. Only
4.4% of them had diabetes less than 1
year. A study in 2011 showed that 63% of
diabetic patients were diagnosed between
50
The pie chart illustrated nutritional status
distribution of elderly diabetic patients.
Of those, people who had normal nutritional
status accounted for the largest proportion
(69%, 109 patients). The rate of malnutrition
and risk of malnutrition were 1.9% and
Journal of military pharmaco-medicine No7-2016
29.1%, respectively. Our study showed a
higher proportion of malnourished patients
than the finding by Valeria Maria et al [9]
and Julia Bollwein et al [7], in which no
malnourished elderly were found. The
difference might be due to in the tools,
since we used MNA Short Form, but others
used the full MNA. Compared to the
research in Sweden [10], the malnourished
proportion in our study was lower (1.9%
vs 36%). They assessed nutritional status
of all individuas in assisted accommodation,
such as service flats, old people’s homes,
group living for the demented, and nursing
homes, in three Swedish municipalities
using the full MNA. According to
accommodation type, the percentages of
malnutrition were 21%, 33%, 38%, 71%,
respectively. This means the nutritional
status had a close relationship with
living condition. Elderly who lived at home
like participants in our study had better
nutritional status than others. However the
proportion of patients at risk of malnutrition
(29.1%) was much higher than that in
Germany (15.1%) [7]. The difference might
be explained by the measurement and
the sample. Our study used MNA-SF for
assessing nutritional status in elderly
diabetes patients while other researches
used the full MNA in general elderly. MNASF was a good screening tool which was
validated and recommended. However, a
further evaluating using the full MNA was
needed to identify exactly malnutrition
status. Some of at risk patients in our study
might be classified as malnutrition if we
performed a deeper assessment.
Table 1: Relationship between nutritional status, duration of diabetes and treatment
therapy (n = 158).
Characteristics
Duration
Treatment therapy
Items
Risk/mal
Normal
Less than 1 year
5
71.4
2
28.6
1 - 5 years
10
35.7
18
64.3
6 - 10 years
12
29.3
29
70.7
> 10 years
22
26.8
60
73.2
Diet/exercise alone
0
0
1
100
OAD
29
36.7
50
63.3
Insulin
5
21.7
18
78.3
OAD and insulin
14
26.4
39
73.6
Nothing
1
50.0
1
50.0
p
> 0.05
> 0.05
There were no relation between nutritional status and any disease-related factors
(p > 0.05). However, there was a trend that the patients with less than 1 year of
diabetes had the highest risk of malnutrition (71.4%). The risk reduced with the
duration of diabetes. It can be explained that in MNA screening, some questions
required information about signs of malnutrition within 3 months, such as weight
loss, food intake decrease, and acute injury. In addition, newly diagnosed diabetes
needed to adapt with the new diet. Hence, their MNA scores were lower than others.
51
Journal of military pharmaco-medicine No7-2016
CONCLUSION
The results of this study provided the
high prevalence of risks of malnutrition
among elderly outpatients with diabetes,
no relationship between nutritional status
and duration of diabetes and treatment
therapy was found. MNA-SF is useful for
screening risk of malnutrition and the full
MNA is required for futher evaluation on
the real malnutrition of this diabetes.
REFERENCES
1. World Health Organization. Definition
and diagnosis of diabetes mellitus and intermediate
hyperglycemia. Report of a WHO consultation.
Geneva (Switzerland). 2006.
2. Office of National Statistics. Population
trends. PT 118, table 14 (population age and
sex). 2004
3. Chapman IM. Nutritional disorders in the
elderly. Med Clin North Am. 2006, pp.887-907.
4. Sanz París A et al. Malnutrition prevalence
in hospitalized elderly diabetic patients. Nutr Hosp.
2013, 28 (3), pp.592-599.
52
5. Bozzetti F. Nutritional aspects of the
cancer/aging interface. J Geriatric Oncol. 2011,
pp.177-186.
6. IDF. Managing older people with type 2
diabetes global guideline. 2013.
7. Julia Bollwein, D. Volkert, R. Diekmann
et al. Nutritional status according to the Mini
Nutritional Assessment (MNA®) and frailty in
community dwelling older persons: A close
relationship. The Journal of Nutrition, Health &
Aging. 2013, 17, pp.351-356.
8. CDC. Distribution of age at diagnosis of
diabetes among adult incident cases aged
18 - 79 years. United States. 2011.
9. Valéria Maria Caselato-Sousa, Maria
Elena Guariento, Gilberto Crosta et al. Using
the Mini Nutritional Assessment to evaluate
the profile of elderly patients in a geriatric
outpatient clinic and in long-term institutions.
International Journal of Clinical Medicine. 2011,
pp.582-587.
10. Saletti A, Lindgren EY, Johansson L et al.
Nutritional status according to mini nutritional
assessment in an institutionalized elderly
population in Sweden. Gerontology. 2011, 46,
pp.139-145.