Ebook Medical image analysis and informatics - Computer-aided diagnosis and therapy: Part 2
Bạn đang xem bản rút gọn của tài liệu. Xem và tải ngay bản đầy đủ của tài liệu tại đây (13.51 MB, 278 trang )
11
Computer-Aided Diagnosis
of Breast Cancer with
Tomosynthesis Imaging
Heang-Ping Chan
Ravi K. Samala
Lubomir M.
Hadjiiski
Jun Wei
11.1Introduction....................................................................................... 241
11.2 Imaging Characteristics of Breast Tomosynthesis.......................243
11.3 Computer-Aided Detection in DBT...............................................249
Computer-Aided Detection of Microcalcifications • Computer-Aided
Detection of Masses
11.4Summary.............................................................................................260
Acknowledgments......................................................................................... 261
References ...................................................................................................... 261
11.1 Introduction
Breast cancer is the most prevalent cancer in women worldwide, and the second-most common cause
of cancer death in many countries, including the United States [1,2]. Mammography has been found to
be effective in reducing breast cancer mortality by a number of cohort and case-control studies [1,3],
although the cost of over-diagnosis has been a topic of controversy and study in recent years. A major
limitation of screening mammography is the low sensitivity in dense breasts [4,5] due to the reduced
conspicuity of lesions obscured by overlapping dense fibroglandular tissue. Another limitation is the
high recall rate. Many of these recalls are caused by overlapping tissue that resembles a lesion and
requires diagnostic workup. Finally, many malignant and benign lesions have similar mammographic
appearance and cannot be distinguished even by further diagnostic workup. The positive predictive
value of recommended biopsies ranges from only about 15%– 30% [6]. Recalls and benign biopsies not
only cause patient anxiety, but also increased healthcare costs.
Digital breast tomosynthesis (DBT) is a new imaging modality that has been introduced into clinical use in the past few years. In the United States, three commercial systems have been approved
by the Food and Drug Administration since 2011. DBT is a limited-angle tomographic technique in
which a small number (e.g., 9– 25) of projection images of the compressed breast are acquired over
a small angular range (e.g., 11° – 60° ). With proper reconstruction, a stack of reconstructed image
slices covering the breast volume can be obtained. DBT provides high spatial resolution on slices
reconstructed parallel (or at small angles) to the detector plane but with low resolution in the depth
direction. DBT reduces the overlap of fibroglandular tissue that can obscure cancerous lesions on
mammograms, thereby alleviating a major problem that limits the sensitivity of breast cancer detection in mammography.
241
242
Medical Image Analysis and Informatics: Computer-Aided Diagnosis and Therapy
A number of clinical trials have been conducted to evaluate the addition of DBT as an adjunct
to the digital mammogram (DM), that is, combining DBT and DM (DBT + DM), in comparison
to DM alone in screening settings [7– 10]. Other investigators compared the cancer detection and
recall rates in screening populations before and after the DBT + DM mode was introduced into their
clinical practice [11,12]. All these studies found significant improvement in cancer detection and
reduction in recalls. Lang et al. [13] compared two-view DM alone and one-view DBT alone in a
screening population and found that one-view DBT significantly improved the cancer detection
rate, but increased the recall rate while maintaining the same positive predictive value. Although
the DBT + DM mode could achieve increased cancer detection rate and reduced recall rate compared to DM alone, it doubles the radiation dose to the screening population. Recently efforts are
being made to synthesize a mammogram-like image (SM) from the DBT to obviate the need for
the DM. Skaane et al. [14] showed that a newer version of SM (C-view) combined with DBT was
not significantly different from the DBT+DM mode in a large screening study and concluded that
DBT + SM was acceptable for routine clinical use. Gilbert et al. [15] compared the DBT + DM mode
and DBT + SM with DM alone in a screen-recalled population and observed significant increase in
specificity and sensitivity for invasive cancers, but marginal increase in sensitivity for all cancers
using the DBT + DM mode; however, DBT + SM increased specificity significantly but no significant
increase in sensitivity for all cancers.
Although the studies found that DBT increased the detectability of breast cancer and reduces recall
rates compared to DM, most studies did not analyze the detection of non-calcified lesions and the detection of microcalcifications separately. In a few studies that reported the performance of DBT in the
detection of microcalcifications, the results were not as consistent. In an early study with 98 subjects,
Poplack et al. [16] found that the recall rate could be reduced by 40% with the addition of DBT to DM,
but the conspicuity of microcalcifications were inferior in 8 of the 14 cases. Gur et al. [17] compared DM
alone to DBT alone and DM + DBT. They found that DM+DBT could reduce recall rate by 30%; however, three benign microcalcification clusters that were seen in DM were not visible in DBT, whereas six
benign masses not seen in DM were seen in DBT. Wallis et al. [18] found that two-view DBT provided
significantly higher detection for both masses and microcalcifications than DM. Kopans et al. [19] also
reported that the clarity of calcifications in DBT acquired with a GE prototype system was better than
or comparable to that in DM in 92% of 119 cases with relevant calcifications. Andersson et al. [20] found
that the visibility of calcifications in DBT were comparable to that in DM for the 13 cancer cases with
calcifications in their study. However, Spangler et al. [21] found that the sensitivity and specificity of
calcification detection in DM were higher than those in DBT in a dataset with 20 malignant and 40
benign calcification cases.
Various methods have been studied to improve the detection of microcalcifications in DBT, including the use of DM in combination with one-view or two-view DBT [18,22– 28], the use of a synthesized
DM-like image from DBT to replace the directly acquired DM [14,15,29], development of computeraided detection methods for DBT [30– 41], and the enhancement of the visibility of microcalcifications
by improving reconstruction and image processing methods [42– 46].
Regardless of the method of implementing DBT (combo DBT + DM, DBT + SM, replacing one or
both DM views with DBT), one of the major concerns of integrating DBT into clinical practice is
the change in workflow. A DBT volume contains a large number of reconstructed slices that need
to be read by radiologist. Even at 1-mm slice thickness, the number of slices per view of the breast
will range from about 30 to over 80. Although the correlation between adjacent slices and the lesscomplex background make it much more efficient in reading each slice than reading a regular mammogram, studies showed that the time required for interpretation of a DBT + DM examination was
about 50%– 100% longer than that for reading DM alone [7,18,47,48]. If the caseload for a radiologist
has to be maintained at essentially the same level as DM due to the limited resources available for
screening, radiologists inevitably will tend to speed up the reading. The DBT + DM or DBT + SM
approach allows radiologists to search for microcalcifications in the two-dimensional (2D) DM or
Computer-Aided Diagnosis of Breast Cancer with Tomosynthesis Imaging
243
SM, but the search for subtle microcalcifications even in 2D DM is known to be a challenging task;
the additional blur and noise in the SM synthesized from DBT may make it more challenging. Softtissue lesions such as masses and architectural distortion will be more visible in DBT slices, but it
requires scrolling through the hundreds of slices in the 4-view screening examination. The chance
for oversight of subtle lesions in the large search space may not be negligible under the time constraint. Detection of microcalcifications in DBT is especially important if DBT would replace DM
for screening because no other imaging modalities can detect calcification as effectively as DM and
calcification is an important sign of early stage breast cancer. Computer-aided detection (CAD),
therefore, is expected to play a similarly important, if not more important, role for DBT as for DM
in clinical practice.
11.2 Imaging Characteristics of Breast Tomosynthesis
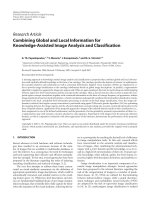
To design effective computer vision techniques for CAD, it is important to understand the imaging characteristics of DBT. The image acquisition geometry of a typical DBT system is shown in Figure 11.1. The
x-ray system is basically a digital mammography system, except that the x-ray source is rotated along an
arc or moved linearly over a limited angle range and takes a small number of low-dose mammograms
along the way. However, different DBT manufacturers may have different designs for the image acquisition process. For example, the detector can be stationary or may be rotated around the pivot point in the
opposite direction while the x-ray source is moved to different locations for acquisition of the projection views (PVs). The x-ray source can be moved continuously while the PVs are taken with short x-ray
pulses to minimize the blurring by the source motion, or moved in a velocity mode or a step-and-shoot
mode such that the x-ray source is stationary during acquisition of the projections. Another design that
X-ray source
X
Y
Z
Compressed
breast volume
Chest
wall
Projection image
Digital detector
FIGURE 1 1.1 Geometry and image acquisition of a typical breast tomosynthesis system. The legend shows a coordinate system being referred to in the other figures in this chapter.
244
Medical Image Analysis and Informatics: Computer-Aided Diagnosis and Therapy
uses an array of stationary x-ray sources placed at proper locations to take PVs at different angles is also
being developed. DBT is not a true three-dimensional (3D) imaging modality because image acquisition
is limited to a small angular range (e.g., 11° – 60° ) compared to computed tomography (CT) of over 180° .
The information of the object in the depth direction that is void of projections is insufficient to permit
accurate reconstruction of the details. The depth resolution is mainly determined by the tomographic
scan angle: the larger the angle, the higher the depth resolution. In addition, the small number of projections taken within the imaging arc with relatively large sampling intervals and the distribution of the
PVs (e.g., uniform and non-uniform) also affect the reconstructed image quality [49,50]. However, the
spatial resolution on the reconstructed DBT planes parallel to the detector is almost as high as that of
digital mammograms, which allows DBT to maintain the spatial details of subtle breast lesions such as
microcalcifications and small spiculated lesions similar to mammograms, while gaining the advantage
of separating the images of the overlapping tissue into thinner layers. Therefore, a tomosynthesis volume
is different from a CT volume that can provide nearly isotropic spatial resolution and can be viewed at
any cross-sectional planes.
An example of a DBT and a mammogram of the same breast in mediolateral oblique (MLO) view is
shown in Figure 11.2. The DBT was imaged with an experimental system that acquires 21 projections
over a 60° tomographic angle at 3° angular intervals. The system uses a CsI/a:Si flat panel detector with a
0.1 mm × 0.1 mm pixel pitch. The simultaneous algebraic reconstruction technique (SART) was used for
the reconstruction at 0.1 mm × 0.1 mm pixel size and 1 mm slice interval. The breast contains an invasive
ductal carcinoma manifested as a mass with calcifications. The DBT slice shows the irregular-shaped
mass and its extended spiculations clearly, while the same mass on the mammogram appears as an illdefined density, similar to the adjacent normal breast tissue. Figure 11.3 shows the same DBT volume
in three perpendicular planes. The DBT slice parallel to the detector plane (x -y plane) has high spatial
DBT slice
Mammogram
FIGURE 1 1.2 An example of a breast with an invasive ductal carcinoma (white arrow) manifested as a mass with
calcification imaged on mediolateral oblique (MLO) view. Left: DBT slice intersecting the breast cancer reconstructed from a DBT scan with 60° tomographic angle and 21 projections. Right: mammogram.
Computer-Aided Diagnosis of Breast Cancer with Tomosynthesis Imaging
245
x-z plane
Scan direction (y)
y-z plane
x-y plane
FIGURE 1 1.3 Reconstructed DBT volume of the same breast shown in Figure 1 1.2 displayed in three perpendicular planes. The simultaneous algebraic reconstruction technique (SART) was used for the reconstruction at
1-mm slice interval. The invasive ductal carcinoma is indicated by a white arrow. The image plane parallel to the
detector plane (x -y plane) has high spatial resolution, similar to that of a mammogram. The other two planes
(x -z and y -z planes) that are perpendicular to the detector plane have very low resolution. The horizontal and
vertical lines on the DBT slice indicate the locations where the x -y plane and the y -z plane are relative to the
x -y plane.
resolution, similar to that of a mammogram, whereas the other two perpendicular planes are dominated by the angular patterns of the x-ray paths without clear structures that resemble breast tissue.
Figure 11.4 shows an example of a DBT volume with a cluster of microcalcifications from a high nuclear
grade ductal carcinoma in situ (DCIS). The inter-plane artifacts can be seen clearly as the extension of
the long bright shadows of a dense calcification along the x-ray paths on the x -z plane and the y -z plane.
The shape of an object in DBT is, therefore, distorted along the depth direction and casts a shadow on
the adjacent slices. It is important to take into consideration these imaging properties during feature
extraction for image analysis in DBT.
It is known that the image quality of DBT depends on the image acquisition parameters, including the tomographic scan angle, the angular increment, and the number of projections, in addition to
other factors that affect the image quality of x-ray imaging systems. The visibility of breast lesions also
depends on the physical properties such as size and contrast of the lesions, as well as the structured noise
in the images. The best combination of the DBT acquisition parameters for each type of lesions has been
an area of interest for research and development in DBT. A number of simulation and modeling studies
[51– 55] or experimental evaluations [49,50,56– 59] have been conducted to examine the dependence of
image quality measures on DBT acquisition parameters.
In the studies by Zhang et al. [49] and Lu et al. [50], DBT scans of phantoms acquired at 60° angle and
3° increments with a total of 21 PVs were used. They selected six subsets of 11 PVs from the original DBT
scans to simulate DBT acquired with different tomographic angles and uniform or non-uniform angular
increments. The contrast-to-noise ratio (CNR), the full-width-at-half-maximum (FWHM), and the artifact spread function (ASF) of calcification-like and mass-like objects in the reconstructed DBT volumes
were calculated to estimate the visibility of the objects on the DBT slices, the spatial blur on the x -y plane
and along the z -direction, respectively. The results showed that DBT acquired with a wide scan angle or,
for a fixed scan angle, having a large fraction of PVs at large angles was superior to those acquired with a
246
Medical Image Analysis and Informatics: Computer-Aided Diagnosis and Therapy
x-z plane
y-z plane
Scan direction (y)
x-y plane (DBT slice)
FIGURE 1 1.4 Reconstructed DBT volume of a breast with a cluster of microcalcifications in a high grade ductal
carcinoma in situ (DCIS) displayed in three perpendicular planes. SART was used for the reconstruction at 1-mmthick slice interval. The x-ray source moved in the y-direction. The image plane parallel to the detector plane (x -y
plane) has high spatial resolution, similar to that of a digital mammogram. The other two planes (x -z and y -z
planes) that are perpendicular to the detector plane have very low resolution. The white arrow points to the same
dense calcification that causes inter-plane artifacts extending several mm along the depth (z) direction on the x -z
plane and the y -z plane. (Reprinted from Chan H-P., Computer Aided Detection and Diagnosis in Medical Imaging ,
CRC Press, Boca Raton, FL, 2015. )
narrower scan angle, as measured by the ASF in the z -direction. On the x -y planes, the effect of PV distributions on spatial blur depended on the directions. In the x-ray source scan direction, the PV distributions with a narrow scan angle or a large fraction of PVs at small angles had smaller FWHM, that is, less
spatial blur. In the direction perpendicular to the scan direction, the difference in the spatial blur among
the different PV distributions was negligibly small. In addition, for small objects such as subtle microcalcifications, PV distributions with a narrow scan angle or a large fraction of PVs at small angles yielded
higher CNR than those with a wide scan angle. Recently, Park et al. [60] conducted experimental studies to
evaluate the effects of variable PV distribution and variable angular dose distributions in DBT acquisition
on the reconstructed image quality of microcalcifications in breast phantom and observed similar results.
Chan et al. [58] and Goodsitt et al. [59] further investigated the impact of the imaging parameters on
the image quality of signals in DBT by observer performance studies using an experimental DBT system
that allows acquisition of projections at variable scan angles, angular increments and number of PVs.
One observer performance study [58] evaluated the detectability of simulated microcalcifications in
DBT of heterogeneous breast phantoms acquired at seven acquisition geometries, using different combinations of scan angle and uniform or non-uniform angular intervals. Another observer preference
study [59] compared the visual quality of low-contrast objects for 12 different acquisition geometries.
These studies showed that a large tomographic angle was better for reducing overlapping tissue and
improving the detectability of low-contrast objects such as soft-tissue lesions, whereas narrow tomographic angles provided higher detectability of microcalcifications.
Figure 11.5 shows DBT volumes of the same breast shown in Figures 11.2 and 11.3 reconstructed at three
combinations of tomographic angle and angular intervals. The original DBT was acquired with 60° , 3°
angular increments and 21 projection views (PVs). Two other geometries, wide angle (60° , 6° , 11 PVs) and
narrow angle (30° , 3° , 11 PVs), were simulated by reconstruction with a subset of 11 PVs. Although the x-ray
dose was reduced by about half, and the noise was higher for the reconstructions with the subsets of 11
PVs, the main effects of acquisition geometry on the appearance of the mass, microcalcifications and tissue
247
Computer-Aided Diagnosis of Breast Cancer with Tomosynthesis Imaging
11 PVs, 60°
11 PVs, 30°
60
50
50
50
40
40
40
30
20
–30°
Z (cm)
60
Z (cm)
Z (cm)
21 PVs, 60°
60
30
20
30°
–30°
20
30°
10
10
–30
–20
–10
0
10
Y (cm)
20
30
15°
–15°
10
0
0
30
0
–30
–20
–10
0
10
Y (cm)
20
30
–30
–20
–10
0
10
Y (cm)
20
30
(a)
(b)
(c)
1 iteration
2 iterations
2 iterations
FIGURE 1 1.5 Comparison of reconstructed DBT images for three acquisition geometries using SART. The original DBT was acquired with 60° , 3° angular increments and 21 projection views (PVs). The other two geometries,
middle column: wide angle (60° , 6° , 11 PVs), and right column: narrow angle (30° , 3° , 11 PVs), were simulated
by reconstruction with a subset of 11 PVs. Although the x-ray dose is reduced by about half and the noise will
be higher for the reconstructions with the subsets, the effects of acquisition geometry on the appearance of the
mass, microcalcifications, and tissue texture patterns are demonstrated. The number of iterations for the DBT
by the 11PV-reconstructions was doubled so that the number of PV updates is approximately equal to that of the
21PV-reconstruction. (a) PV distributions of three geometries. (b) DBT slice (x -y plane) intersecting an invasive
ductal carcinoma (white box). (c) and (d) The enlarged region of interest showing the spiculated mass with calcifications. The mass shows higher contrast in the wide-angle DBT, whereas the calcifications are sharper and higher
contrast in the narrow-angle DBT. Both the signal and noise increase as the number of iterations increases.
248
Medical Image Analysis and Informatics: Computer-Aided Diagnosis and Therapy
(d)
5 iterations
10 iterations
10 iterations
x-z plane
x-z plane
x-z plane
(e)
y-z plane
y-z plane
y-z plane
(f )
FIGURE 1 1.5 (CONTINUED) (e) and (f) The inter-plane artifacts of the narrow-angle DBT extend longer than
those of the wide-angle DBT, indicating that the wide-angle DBT has better depth resolution and less overlapping
tissue shadows than the narrow-angle DBT.
texture patterns can be seen by comparison of the images. The DBT was reconstructed with SART; the number of iterations for the DBT by the 11 PV-reconstructions was doubled so that the number of PV updates
was approximately equal to that of the 21 PV-reconstruction to reduce the impact of fewer updates on the
subset reconstruction. It is shown that the spiculated mass and the fibroglandular tissue have higher contrast in the wide-angle (60° ) DBT than those in the narrow-angle (30° ) DBT; however, the calcifications are
sharper in the narrow-angle DBT. Both the signal and noise increase as the number of iterations increases.
Computer-Aided Diagnosis of Breast Cancer with Tomosynthesis Imaging
249
On the cross-sectional images perpendicular to the detection plane, the image texture is dominated by the
patterns of x-ray paths and the inter-plane artifacts of the narrow-angle DBT extend longer than those of the
wide-angle DBT. These examples illustrate that wide-angle DBT has better depth resolution and less overlapping tissue shadows than the narrow-angle DBT, which results in DBT slices having a background with
less fibrous textures and reduced tissue overlap, as evident by comparing the DBT slices in the second row.
In addition to the image characteristics of various types of lesions and their different dependences
on the DBT acquisition geometry, the design of a DBT system often has to take into consideration the
trade-offs among many other factors, such as the detector efficiency, the x-ray source output, the readout
speed and lag of the detector, the scanning and breast compression time, and the mechanical stability
and precision, while under the constraint of maintaining low radiation dose to the patient. The optimal
design of a DBT system that can balance the image quality requirements of various types of lesions at
the lowest possible radiation dose is still a topic of continued investigation.
A number of reconstruction methods have been applied to DBT reconstruction, including shiftand-add, tuned aperture computed tomography (TACT), maximum likelihood-convex (ML-convex)
algorithm, matrix inversion (MITS), filtered back projection (FBP) and simultaneous algebraic reconstruction technique (SART) [61– 65]. Reconstruction methods have a strong impact on image quality of
DBT. Studies to improve the reconstruction methods and artifact reduction techniques are on-going
[42,44,66,67]. Reconstruction methods specifically designed to enhance microcalcifications and reduce
noise are also under investigation [44, 68– 70]. DBT images are usually reconstructed in slices parallel
to the detector plane. The spatial resolution on the reconstructed DBT slices can approach that of the
digital detector if the geometry of the scanning system is accurately known and patient motion is kept
at a minimum. However, some degree of blurring is inevitable due to the reconstruction from multiple
PVs with different x-ray incident angles and oblique incidence of the x-ray beam to the detector, especially at large projection angles [71]. Super-resolution has been observed in DBT when reconstruction
is performed with finer grids [46,72,73]. Because of the lack of PVs at large projection angles, the spatial
resolution in the direction perpendicular to the detector plane (the depth or z-direction) is poor. The
depth resolution is mainly determined by the tomographic angle: the larger the angle, the higher the
depth resolution and the less the inter-plane artifact but with a trade-off of greater blurring on the DBT
plane due to oblique intersection of the x-ray paths with a reconstructed slice of finite thickness. This
blurring may be reduced by reconstruction with an adaptive grid approach along the depth direction for
small objects such as microcalcifications [74]. Regardless of the reconstruction methods, tomosynthesis
cannot provide true 3D information due to the lack of sampling over a wide angular range.
11.3 Computer-Aided Detection in DBT
DBT is composed of a number of low-dose DMs taken at slightly different projection angles. The PVs,
together with the acquisition geometry, contain all the available information for signal detection in
DBT. However, the individual PVs are noisy due to the low-dose acquisition. A DBT volume can be
reconstructed from the PVs by an appropriate technique, which can enhance the signal and reduce
noise by combining the information from the multiple projections. If both the set of PVs and the reconstructed DBT are available, CAD methods can be developed by combining the information from both in
many different ways. One approach is to use the set of PVs as input and combine the information from
the PVs in the process. Another approach is to use the reconstructed DBT volume (slices) as input and
analyze images as a 3D volume or 2D slices. A third approach is to use both sets of images as input and
combines the information at different stages of detection. Although the PVs and DBT volume basically
contain the same information, the computer-vision techniques designed for the different sets of images
may utilize the information differently. Combining the information extracted from the different forms
of images derived from the original PV images may improve signal detection or characterization.
250
Medical Image Analysis and Informatics: Computer-Aided Diagnosis and Therapy
The recent development of methods for generating a 2D synthetic mammogram from the DBT images
leads to an additional option of lesion detection, namely, detection in the synthetic mammogram, which
may be combined with the approaches described above. However, it should be noted that some synthetic
mammogram generation methods rely on detecting potential lesions with CAD to enhance the conspicuity of the lesions on the synthetic mammograms [75]. The sensitivity of detecting lesions in this type
of synthetic mammograms will depend on the sensitivity and false-positive rate of the CAD methods
used in the generation of the synthetic mammogram. On the other hand, if the synthetic mammogram
is generated from the DBT without using CAD, the image quality and lesion detectability is most likely
poorer than a DM because all overlapping tissue remains in the synthetic mammogram and additional
blurring may result from the multiple-projection reconstruction and the limited depth resolution of the
reconstructed volume.
11.3.1 Computer-Aided Detection of Microcalcifications
Detection of subtle microcalcifications in DBT by human or computer vision is challenging because
of the large search space and the noisy background. CAD methods for detection of microcalcifications
in the projection views (PVs), the reconstructed slices or the reconstructed volume have been studied.
Peters et al. [76] detected calcifications on a small set of DBT. A band-pass, filter-based, wavelet kernel
was used to separate the potential calcification candidates from the background on the PVs. A feature
map was generated for each PV image, and the correspondence between 2D and 3D locations determined by the DBT acquisition geometry was used as a criterion to identify the calcifications. Park et
al. [77] applied a 2D CAD algorithm developed for digitized screen-film mammograms (SFM) to the
PV and the reconstructed DBT slices. Reiser et al. [36] developed an algorithm to detect microcalcifications in PV images to avoid the dependence of the CAD performance on the reconstruction algorithm.
van Schie et al. [37] estimated a non-uniform noise model from each individual DBT-reconstructed
volume which was used for normalization of the local contrast feature. Potential microcalcifications
were detected by thresholding the local contrast feature, and the microcalcification candidates within
a 5 mm radius were grouped to form microcalcification clusters. The detection strategies developed by
our research laboratory are described below.
11.3.1.1 Microcalcification Detection in DBT Volume
A CAD system generally consists of several major stages: preprocessing for signal enhancement, prescreening for candidate signals, feature extraction and analysis for false positive reduction and final
decision for identifying detected signals. A number of preprocessing methods have been investigated to
improve the detectability of microcalcifications in DBT. Sahiner et al. [31] developed a CAD system for
detection of microcalcifications, as shown in Figure 11.6. Two parallel processing methods are designed
to identify microcalcification candidates and cluster seed candidates. For identifying microcalcification candidates, a 2D contrast-to-noise ratio (CNR) enhancement filter is applied to the DBT slices
to enhance potential microcalcifications and reduce the low frequency background. Adaptive thresholding and region growing are then applied to the CNR-enhanced volume to segment the individual
microcalcification candidates. For identifying cluster seed candidates, 3D multiscale filtering is applied
to the DBT volume, and the eigenvalues of Hessian matrices are calculated at each voxel. Multiscale
calcification response representing the intensity, size and shape information are then derived from the
Hessian eigenvalues, which is further weighted by the CNR-enhanced volume voxel by voxel, resulting in an enhancement-modulated calcification response (EMCR) volume. With adaptive thresholding
and region growing, potential calcifications are segmented from the EMCR volume and a set of topranked candidates are used as cluster seeds. A dynamic clustering process then groups the individual
microcalcifications into clusters using the cluster seeds as the starting point and a distance criterion to
determine cluster membership. The cluster candidates identified in the clustering process will undergo
feature analysis and the clusters that do not satisfy the criteria are excluded as false positives (FPs). The
Computer-Aided Diagnosis of Breast Cancer with Tomosynthesis Imaging
251
3D DBT volume
CNR
enhancement
3D multiscale
calcification response
EMCR volume
Calcification
candidates
Cluster seeds
Dynamic clustering
Feature analysis and
false-positive reduction
Detected clusters
FIGURE 1 1.6
CAD system for detection of microcalcifications in DBT.
likelihood of a remaining cluster being a true cluster is determined as the highest CNR value among
the cluster members. The sensitivity and specificity (or the number of FPs per DBT volume) can then be
adjusted by applying a decision threshold to the cluster likelihood value. The overall performance of the
CAD system can be described by a free-response receiver operating characteristic (FROC) curve that
plots the relationship between the sensitivity and the number of FPs per DBT volume as the decision
threshold is varied.
11.3.1.2 Enhancement of Microcalcification by Regularized Reconstruction
The microcalcifications in DBT can be enhanced by regularized reconstruction. Sidky et al. demonstrated that non-convex total p-variation regularization method (TpV) [44] with properly chosen
regularization can reduce noise and increase the conspicuity of microcalcifications and masses on
the reconstructed slices. However, the TpV method can cause staircasing (i.e., contouring) artifacts in
the soft tissue background. Lu et al. [42,43,68,78] investigated methods to enhance the CNR of subtle
microcalcifications while preserving the texture of the breast parenchyma in DBT. They found that
incorporation of multiscale bilateral filtering (MSBF) into iterative DBT reconstruction is a promising
approach [68].
Bilateral filtering [79] is a nonlinear filter that exploits both the geometric uniformity in the spatial
background and the intensity difference of the signals in an image to selectively smooth the noise and
enhance the sharpness of the signals. At each pixel of an image, bilateral filtering applies the product of
two Gaussian filters, referred to as the domain filter and the range filter, to a neighborhood centered at
the pixel. The domain and the range filters weight the intensity value of a neighboring pixel based on its
distance and its intensity difference, respectively, from the central pixel, and the sum of all the weighted
intensity value from the neighborhood yields the bilateral filtered value of the pixel on the image. The
degrees of denoising and the signal enhancement are determined by the selection of the standard deviations of the Gaussian domain filter and range filter.
For the application to DBT, it is important to smooth the noise while preserving both the tissue
structures, such as the spiculations and mass margins, and the small signals, such as microcalcifications
252
Medical Image Analysis and Informatics: Computer-Aided Diagnosis and Therapy
that have large differences in the spatial frequency contents. Based on these image characteristics,
Lu et al. [68] designed a multiscale approach to regularize noise between iterations of iterative reconstruction techniques. At the end of each iteration, every DBT slice is decomposed into several frequency
bands via Laplacian pyramid decomposition. No regularization is applied to the low-frequency bands,
so that subtle edges of masses and structured background are preserved. Bilateral filtering, with properly selected standard deviations of the domain filter and range filter, is applied to the high-frequency
bands to selectively enhance microcalcifications while suppressing noise. The regularized DBT images
are used for updating in the next iteration. The number of iterations also affects the overall image quality of DBT. MSBF regularization can be used with any iterative reconstruction techniques. Examples of
MSBF-regularized reconstruction of DBT using the simultaneous algebraic reconstruction technique
(SART), in comparison to TpV reconstruction and SART without MSBF, are shown in Figure 11.7. The
MSBF method not only achieved higher CNR of microcalcifications than SART alone or TpV reconstruction, but also reduced contouring artifacts and preserved the mass margin and the parenchyma.
The microcalcification enhancement by the MSBF-regularized SART offers new opportunity to
improve the detection accuracy of microcalcifications. Following the framework of the CAD system in
Figure 11.6, Samala et al. [38] used the DBT volume by the MSBF-regularized SART as input and adapted
the processing techniques to the images with enhanced signals. They designed new criteria to reduce FP
clusters based on the size, CNR values and the number of microcalcifications in the cluster, cluster shape
and cluster-based maximum intensity projection. They demonstrated that, with the MSBF enhancement
(a)
(b)
(c)
FIGURE 1 1.7 Examples of microcalcifications reconstructed with three methods. (a) SART, (b) non-convex total
p -variation with p = 0.8, (c) SART with multiscale bilateral filtering, where the standard deviation of the domain
filter was 2 and the standard deviation of the range filter was adaptively calculated from noise patches in the DBT
volume being reconstructed. The focus slices after five iterations are shown. Simulated microcalcification clusters
of three contrast groups in the breast phantoms: (upper row) high contrast, (middle row) median contrast, (lower
row) low contrast. The same window and level settings were applied to images in the same row. (Reprinted from Lu
Y, et al. Medical Physics, 42(1), 182– 195, 2015.)
253
Computer-Aided Diagnosis of Breast Cancer with Tomosynthesis Imaging
in combination with properly designed adaptive threshold criteria, effective microcalcification feature
analysis and FP reduction techniques, the CAD system achieved a significant improvement in the detection of clustered microcalcifications in DBT compared to without MSBF enhancement.
The improved microcalcification detection in DBT with MSBF indicates the promise of denoising
without blurring the high-frequency signals and edges. Inspired by this approach, Zheng et al. [80]
proposed a new regularization method for iterative reconstruction, referred to as the spatially weighted
non-convex (SWNC) regularization method. Similar to the MSBF, the SWNC method considers the
spatial and intensity differences between pixels within a small neighborhood centered at each pixel
to estimate the presence of signal or noise. However, the SWNC regularizer is incorporated into the
formulation of the image reconstruction cost function, which can then be minimized with any suitable
iterative algorithm. It is shown that, with proper selection of the parameters, the SWNC regularization
method can further increase the CNR of microcalcifications while preserving the appearance of the
spiculations and the breast parenchyma. The effectiveness of the SWNC method in improving microcalcification detection is yet to be investigated.
11.3.1.3 Microcalcification Detection in 2D Planar Projection (PPJ) Image
The decomposition of the high-frequency and the low-frequency information in the DBT slices suggests
a new approach to detect the microcalcifications. Because the microcalcifications are mainly contained
in the high-frequency band and already separated from the low frequency structured background, the
detection of microcalcifications by the CAD system may focus on the stack of high-frequency slices.
Moreover, the 3D spatial distribution of the individual microcalcifications in a cluster is sparse and is
more difficult to be differentiated from noise. Samala et al. [40] proposed to generate a planar projection
(PPJ) image and perform the detection in 2D. The PPJ image is obtained by a maximum intensity projection of the high-frequency DBT volume in the direction perpendicular to the detector plane at the final
iteration of the SART reconstruction. The corresponding locations of the clusters, if any, can be mapped
back to the DBT volume. The example of a biopsy-proven case of ductal carcinoma in situ (DCIS) shown
in Figure 11.8 demonstrates the improvement in conspicuity of the microcalcifications on the PPJ image,
compared to that in the DBT slices.
Samala et al. [40] designed a 2D approach for detection of microcalcifications in DBT, taking advantage of the PPJ image, as shown in Figure 11.9. With the PPJ image as input, no structured background
removal is needed. For prescreening of microcalcification candidates, iterative gray-level thresholding
is performed by applying a threshold that automatically steps from high to low value by analysis of the
histogram of the PPJ image. At each threshold, the pixels exceeding the threshold value are subjected to
region-growing using 8-connectivity to form individual objects. The threshold is reduced and the above
process is repeated until the number of segmented objects reaches a desired value. Each object is further
refined by a second region-growing segmentation using a gray-level threshold adaptive to the local statistic. The size and CNR features of the microcalcification candidates after the refined segmentation are
Slice 30
Slice 31
Slice 32
PPJ image
FIGURE 1 1.8 Planar projection (PPJ) image of a breast with biopsy-proven ductal carcinoma in situ. A 3D region
of interest from the DBT volume enclosing the cluster is shown as slices 30– 32. The region shown is 15 × 15 mm
(150 × 150 pixels). (Reprinted from Samala RK, et al. Physics in Medicine and Biology, 59(23), 7457– 7477, 2014.)
254
Medical Image Analysis and Informatics: Computer-Aided Diagnosis and Therapy
Planar projection image
Microcalcification candidate
detection
Cluster seed
candidates
Cluster member
candidates
Convolutional
neural network
Dynamic conditional
clustering
False positive reduction
Detected clusters
FIGURE 1 1.9
the PPJ image.
CAD system for detection of clustered microcalcifications in DBT by applying a 2D approach to
used for FP reduction in the subsequent stages. The objects are ranked according to their CNR value.
N top ranked objects are considered to be indicators of potential cluster locations, referred to as cluster
seeds. Another set of Ns high ranking objects are kept as potential cluster members. A trained convolution neural network (CNN) is then used to differentiate true microcalcifications from FP objects, most
of which come from edges of fibrous tissue and ducts, as well as artifacts such as the high contrast edges
of metal clips from previous biopsy and inter-plane artifacts from the clips. Based on automatic analysis
of the CNR histogram of the remaining candidate objects in the input PPJ image, CNR threshold criteria adaptive to this image are estimated for microcalcifications of different degrees of subtlety as stratified by their size and CNR values. Following the ranking of the cluster seeds and the cluster member
candidates, a dynamic conditional clustering process then hierarchically forms cluster candidates by a
distance criterion. Clusters that do not satisfy the adaptive CNR threshold criteria in combination with
the size and the number of microcalcifications in the cluster are eliminated in the clustering process.
FROC analysis indicates that the performance of the 2D approach in detection of microcalcifications
was significantly higher than that of the detection in the DBT volume.
11.3.1.4 Microcalcification Detection by Joint DBT-PPJ Approach
Both the DBT volume and the PPJ image are reconstructed from the same set of projection-view images
that provide the same information content. However, the DBT and PPJ images utilize the information in
different ways and result in different detectability of the microcalcifications. Samala et al. [41] exploited
the potential of improving detection by combining the two approaches based on the assumptions that a
cluster detected in both 2D and 3D is more likely to be a true cluster and that each of the approaches may
detect some clusters that the other misses. The trade-off is that the FPs may double so that more effective
FP reduction methods are needed. This combined 2D and 3D approach of detecting microcalcifications
is referred to as joint-CAD and is illustrated in Figure 11.10.
The joint-CAD system incorporates the individual steps from each of the CADDBT and CADPPJ
systems within one framework using task-specific strategies to take advantage of the combined information. The joint-CAD system can be broadly divided into several stages: (1) preprocessing of the
Computer-Aided Diagnosis of Breast Cancer with Tomosynthesis Imaging
CADDBT
255
CADPPJ
Cluster pool
DBT\PPJ
DBT∩PPJ
PPJ
ClrDBT\PPJ
ClrDBT∩PPJ
ClrPPJ
Decision tree classifier
Rule-based FP reduction
DBT\PPJ
DBT∩PPJ
PPJ
Mapping to PPJ
ClrPPJ
Detected clusters
FIGURE 1 1.10 Joint-CAD system: cluster candidates detected by the individual CADDBT and CADPPJ systems
form a cluster pool, which are grouped into three types: clusters detected by the CADDBT system alone (DBT\PPJ),
by the CADPPJ system alone (PPJ), by both systems (DBT∩ PPJ). Each group will undergo FP reduction by a classifier
designed for that type, and finally by a decision tree classifier and a rule-based FP classification to further reduce
the FP clusters. The remaining DBT\PPJ clusters are mapped to the PPJ space and features are extracted from
the PPJ image. All clusters are then screened by the classifier trained for the PPJ clusters for a final FP reduction.
(Clr = classifier).
DBT volume, (2) generation of microcalcification candidates and cluster candidates in DBT and PPJ,
(3) FP reduction of clusters, (4) mapping of clusters from the DBT domain to the PPJ domain and
(5) final FP reduction. The CADDBT and CADPPJ systems are basically the same as the individual systems, described above. After the dynamic clustering stage in each system, the clusters are combined
into a cluster pool and grouped into three types: clusters detected by DBT alone (DBT\PPJ), clusters
detected by both systems (DBT∩ PPJ), and clusters detected by PPJ alone (Figure 11.10). To determine
if a cluster detected in the DBT path overlaps with a cluster detected on the PPJ image, the DBT cluster
is projected onto the PPJ image. If the centroid of the DBT cluster falls within the bounding box of a
PPJ cluster or vice versa, the two clusters are considered overlapped. If more than one DBT clusters
overlap with the PPJ cluster, the DBT cluster with the highest CNR score is kept while the other DBT
clusters will be considered FPs. This will reduce the number of low score clusters that are more likely
to be FPs to be passed from the DBT volume to the cluster pool. Three different classifiers are trained;
ClrDBT and ClrPPJ are trained on the set of DBT and PPJ cluster features, respectively, and ClrDBT∩ PPJ is
256
Medical Image Analysis and Informatics: Computer-Aided Diagnosis and Therapy
trained on the cluster features that are aggregated from the (DBT∩ PPJ) clusters. The cluster features
are derived from the morphological features of the cluster members [81] for the DBT (or PPJ) clusters.
For the PPJ clusters, the feature set has four additional features derived from the CNN output scores
for the cluster members [82]. The feature sets are further reduced by feature selection, and linear discriminant classifiers are used to limit the number of weights to be trained [81,83]. The discriminant
scores generated from the classifiers are passed to a C4.5 decision tree classifier [84] with reduced
error pruning to generate a decision tree. The C4.5 has the advantages of inherently handling missing
values, which in this study came from clusters detected only in the PPJ or the DBT path. The purpose
of the classifier at this stage is to moderately reduce the FPs in both paths while keeping the sensitivity high. Further FP reduction is accomplished by applying the previously developed decision rules
for the CADDBT and CADPPJ systems to the DBT clusters and PPJ clusters, respectively, in the second
FP reduction step.
The resulting clusters from the cascaded FP reduction steps are categorized into two groups; one
contains those detected in DBT alone (i.e., DBT\PPJ), and the other contains clusters detected either in
PPJ alone or in both DBT and PPJ. Since the CNR feature in PPJ has better discriminatory power for
TP and FP candidates compared to that in the DBT volume, the DBT\PPJ clusters are mapped to the
PPJ domain, that is, the locations of the cluster and the individual members in the cluster are projected
onto the PPJ image, and segmentation and feature extraction for the objects are performed on the PPJ
image. All clusters at this stage will therefore have features from the PPJ image, which will be input to
the trained classifier for PPJ, ClrPPJ , for final FP classification.
The joint CAD system was evaluated in a set of DBT test cases reconstructed by MSBF regularizedSART, from which the PPJ image was also generated for each DBT volume. The FROC analysis showed
that the performance of the joint-CAD system is significantly higher than those of the CADDBT and
CADPPJ systems alone, indicating that the combined approach is useful for improving microcalcification detection in DBT.
11.3.1.5 Microcalcification Detection in 2D Projection Views
If the 2D projection views for a DBT scan are available, an alternative approach is to detect the microcalcifications in the 2D projection views before reconstruction, making the CAD system independent of
the reconstruction technique. Wei et al. [39] has developed a multi-channel response (MCR) approach
for detection of microcalcifications in DBT using the set of projection view images as input. The main
processing steps of the 2D CAD system are shown in Figure 11.11.
The projection-view images in a DBT scan are basically low-dose digital mammograms. Some of the
CAD methods developed for mammograms can be applied to the projection views but the methods
have to be adapted to the noisy images. The input images are preprocessed with the difference-image
technique [85,86] to enhance microcalcification candidates and remove the low-frequency background
on the individual projections. An iterative global thresholding technique then extracts a desired number of microcalcification candidates having top ranking of filter response on each projection view. Each
candidate is segmented with a region-growing method based on a gray-level threshold adaptive to the
local CNR of the candidate pixels and an 8-connectivity criterion. The shape, size, CNR and a refined
centroid location of each candidate are determined after the local segmentation and used for preliminary reduction of FPs.
The microcalcification candidates are then subjected to the multi-channel response analysis. The
Channelized Hotelling Observer (CHO) [87] that has been used to model signal detection tasks is
adapted to extract signal response from the individual microcalcification candidates on the projection
views. With the CHO model, a region of interest (ROI) centered at a microcalcification on a projection
view image can be represented by a multi-channel filter bank using a set of orthonormal basis functions
{b 1 , … b N }. The channelized basis functions are a set of optimal templates, each of which can characterize an image in specific frequency bands. A given ROI image can be decomposed into a linear combination of multiple channels:
Computer-Aided Diagnosis of Breast Cancer with Tomosynthesis Imaging
257
Projection views
Prescreening of MC
candidates
on individual projections
Multi-channel response (MCR)
analysis of MC candidates
Fusion of MCR from all
projections in 3D by
coincidence counting
Identification of
cluster seeds in 3D
Dynamic 3D clustering
Detected clusters
FIGURE 1 1.11 CAD system for detection of microcalcifications in DBT by applying a 2D approach to the projection view images. Multi-channel response (MCR) and coincidence counting methods are designed to extract signal
response and fuse the response in 3D for FP reduction.
ROI ( x , y ) =
N
∑ f b ( x, y )
i i
i
The ROI is therefore characterized by a set of channelized responses {f 1 , … , f N } that can be treated as
a vector f = { f 1 , … , f N } in the space spanned by the set of orthonormal basis functions {b 1 , … b N }. With
this representation, the task of differentiating the true and false microcalcification candidates can be
formulated as a linear classification model to classify a given vector f into one of the two classes:
MCR ( f ) = (m2 − m1 ) Σ −1 f
T
where:
mk is the mean vector for class k , k = 1,2
Σ is an N × N covariance matrix for both classes
Therefore, the multi-channel response, MCR(f ), is a weighted sum of the individual channel response
{f 1 , … , f N } that can be used as a decision variable for ROC analysis. From the analysis of the channel
responses of a set of training ROI samples containing true microcalcifications and FPs, the type of
multi-channel basis functions, the number of channels N that are effective for characterizing microcalcifications can be determined by maximizing the separation between the two classes. Wei et al. [39]
investigated two types of orthogonal basis functions: the Laguerre-Gaussian (LG) polynomials and the
258
Medical Image Analysis and Informatics: Computer-Aided Diagnosis and Therapy
Hermite-Gaussian (HG) polynomials, for microcalcification representation. The LG functions are commonly used in the CHO model for image quality assessment and simple signal detection tasks.
The microcalcification candidates from the individual projection views include many FPs because of
the noisy nature of the low dose mammograms. A key step to reduce FPs is to utilize the fact that true
microcalcifications are likely imaged on multiple projection views whereas FPs from noise are random.
The location correspondence of a microcalcification among the projection views is encoded in the imaging geometry of the x-ray system. Wei et al. [39] designed a coincidence counting method based on a
two-stage backward and forward ray-tracing to fuse the 2D MCR into a 3D response using the known
geometry of the DBT system. The backward ray-tracing process identifies all possible locations (voxels)
in the 3D breast volume where the microcalcification candidates detected on the projection views may
originate from, while the forward ray-tracing process eliminates the redundant locations by using the
coincidence counts accumulated in the voxels as a guide. Higher coincidence counts, and concurrently
higher 3D MCR value, accumulated at a given location in the 3D volumes indicate a higher likelihood
that an object at that location generates the 2D MCR on multiple projection views. The remaining voxels
of high 3D MCR values are segmented and region-grown with 26-connectivity, and the resulting objects
correspond to the location of microcalcification candidates in the breast volume. The locations of low
MCR values are eliminated as FPs. A dynamic clustering procedure is then used to identify microcalcification clusters.
Wei et al. [39] showed that this 2D multi-channel response approach achieved high accuracy for the
detection of microcalcifications in DBT, and the performances are comparable using either the LG or
the HG polynomials as basis functions.
The set of projection views together with the geometry of the DBT system contain the same information as the reconstructed DBT volume because the latter is derived from the former. A well-designed
reconstruction technique can combine the information from the projection views effectively by enhancing the signal and reducing noise. However, the performance of a CAD system using the reconstructed
volume as input may depend on the reconstruction technique and parameters used because they affect
the resulting image quality. On the other hand, detection of signals on the individual projection views
may be more difficult because of the low exposure and thus noisy images but an advantage of this
approach is that the CAD system will be independent of reconstruction. Fusion of the detected candidates on projection views in 3D using the DBT system geometry is, therefore, a crucial step to differentiate true and false signals. The coincidence counting method was found to increase the classification
accuracy significantly. Further improvement of the fusion methods that may better utilize the information from multiple projection views in DBT warrants more extensive investigations if a CAD system that
does not depend on a specific reconstruction technique is preferred.
11.3.2 Computer-Aided Detection of Masses
Non-calcified lesions, including masses, architectural distortion and focal asymmetry, are other
important signs of breast cancer. For detection of masses, Chan et al. developed gradient field analysis and feature extraction methods in the DBT volume [88,89]. They also developed a 2D approach in
which mass detection was performed on individual projection views, and the mass likelihood score
estimated for the candidate lesions from the projection views were back-projected to the 3D volume
to merge into a 3D mass likelihood score. Comparison of the combined 2D and 3D approaches to
that by the 2D approach or 3D approach alone showed that the detection accuracy was improved
significantly by the combined approach [90– 92]. Chan et al. also compared the mass detection
accuracy for different reconstruction methods with different number of iterations [93], evaluated
the effect of different number of projection views and dose on detection [94] and compared mass
detection in DBT and conventional mammograms [95]. Wei et al. evaluated false positive reduction
method to further improve the mass detection performance [96]. Reiser et al. applied 2D and 3D
radial gradient index segmentation methods to mass detection in DBT and compared the detection
performance in the reconstructed DBT slices or 3D volume [97]. They also applied a mass detection
Computer-Aided Diagnosis of Breast Cancer with Tomosynthesis Imaging
259
CAD algorithm originally developed for mammograms directly to the projection view images and
merged the mass candidates from the projection views for feature analysis in DBT [98]. Peters et al.
preprocessed the projection views with a wavelet filter and extracted the mass contours using several
segmentation methods [99,100]. Jerebko et al. applied CAD algorithms developed for mammograms
to projection views [101]. Singh et al. prescreened for mass candidates on projection view images,
shifted and added to generate the suspicious locations in the 3D volume, and reduced false positives
by an information-theoretic approach using a knowledge database from reconstructed DBT slices
[102– 105]. Mazurowski et al. [106] applied a mass CAD system developed for screen-film mammography to a single slice per DBT volume (i.e., central slice intersecting a mass for abnormal cases or a
random slice for normal cases), and showed that their template-matching approach by mutual information trained with a knowledge database of mammographic masses can be transferred to DBT.
Van Schie et al. applied a CAD system trained for mass detection on mammograms to DBT slabs of
various thicknesses and compared three methods to merge the detected objects and determine their
locations in 3D [107]. Palma et al. [108] developed a two-channel method that detected masses with
a fuzzy approach. The second detection channel models the convergence characteristics of architectural distortions using an a contrario approach. Kim et al. [109] proposed a boosting framework to
combine features extracted from the DBT volume with those from the projection views and showed
that the sensitivity of the combined approach was significantly higher than those of the individual
approaches. Using the same dataset, Kim et al. [110] compared the performance of mass detection
in the DBT volume alone by combining detection in the DBT volume and in a simulated projection
image. However, the detection performances using the DBT volume alone reported in the two studies were very different and no comparison of the two studies was provided so that it is unknown
which approach might be more effective. Recently, Morra et al. [111] evaluated a commercial CAD
system for DBT that performed detection in the reconstructed volume using proprietary methods.
Review of CAD methods for computerized detection of masses in DBT can be found in the literature
[112], and the details will not be discussed here.
Architectural distortion (AD) of the breast is similar to spiculated mass except that it does not have
a central dense region like a mass. It appears as distortion of normal breast parenchyma or spiculations
radiating from the central region. AD is associated with high positive predictive value for breast cancer,
but it has a high false negative rate on mammograms [113,114], likely due to its low contrast and masking
by overlapping tissue. It is therefore important to develop CAD methods to assist in AD detection. Some
ADs may be detectable by CAD methods developed for masses, but in general it will require specifically
designed detection techniques to achieve high sensitivity due to the lack of central density in AD. CAD
techniques for detection of AD in mammograms can be found in the literature [115]. Partyka et al. [116]
showed that DBT is superior to DM in detection of AD. Some of the CAD techniques developed for AD
in mammograms may be applicable to detection in DBT slices or can be generalized to detection in the
DBT volume. To date, there has not been a CAD system designed for AD in DBT. One reason may be
due to the much lower prevalence of AD than that of mass, so it will take more time to collect a large
dataset for CAD development.
Focal asymmetry is a concentration of density in a local region but does not fit the criteria of a mass; it
appears on two views of the same breast but not in the corresponding region in the contralateral breast.
The focal density will likely be detected as mass candidate at the prescreening stage of a mass CAD
system but it may be dismissed as false positives during feature classification because their extracted
features may not satisfy the criteria designed for masses. To distinguish focal asymmetry from normal
dense tissue, it will require the analysis of corresponding regions in the two views of the same breast
and in the views of the contralateral breast, similar to radiologists’ strategy in reading screening mammograms, which were also found to be useful for improving sensitivity and specificity in CAD of masses
on mammograms [117– 121]. Some computer vision techniques developed for detecting focal asymmetry
on bilateral mammograms were reviewed in [115]. These two-view and four-view CAD approaches will
provide the framework for guiding the future development of similar techniques in DBT.
260
Medical Image Analysis and Informatics: Computer-Aided Diagnosis and Therapy
11.4 Summary
DBT is a new breast imaging technology that has been introduced into clinical use in recent years.
Studies have shown that DBT can improve sensitivity of breast cancer detection and reduce recall rates.
However, the detection of breast cancer manifested as subtle clustered microcalcifications in DBT is
not as promising, and the impact of increase in reading time and how the radiologists adapt to the
increased workload is still uncertain. CAD is expected to be a useful adjunct to DBT. The discussion in
this chapter has focused in CAD for microcalcifications. However, computer-assisted visualization and
interpretation of DBT will be equally important for all types of lesions. CAD methods have already been
incorporated into technologies for generating synthetic mammograms for radiologists’ preview of DBT.
The preview synthetic mammogram may evolve to be a fast prescreening tool for many radiologists, and
lesions not apparent in synthetic mammogram may be more likely to be overlooked. This application of
CAD essentially uses CAD as a first reader, and, as such, it is crucial that the CAD system has very high
sensitivity for detecting suspicious lesions so that they can be enhanced on the synthetic mammograms.
Continued development of CAD methods to improve the sensitivity and specificity of lesion detection
and characterization will therefore be an important component of DBT. An accurate and efficient CAD
system, regardless of whether it is used as a second look or visualization aid, will accelerate the adaptation of DBT into routine clinical use and alleviate the need for digital mammograms. Nevertheless, the
impact of CAD as a second reader on radiologists’ interpretation and especially as a tool for generating
synthetic mammograms with enhanced lesions to assist radiologists in prescreening should be investigated rigorously.
The development of CAD methods for DBT is similar to that for mammography in many aspects.
However, the possibilities of developing computer vision techniques using the 2D projection views
before reconstruction, the 2D reconstructed slices, the 3D reconstructed volume, the derivatives of
the reconstructed images, such as the planar projection and synthetic mammogram, or a combination
of the available images in different ways offers great opportunities for exploiting the information for
lesion detection and diagnosis in DBT, but it is much more challenging to select the best approach to
the problem. In addition, many alternative methods may be implemented for each approach, and the
information from the different approaches may be combined at different stages of the algorithms. The
development of an effective CAD system for DBT is a very high dimensional optimization problem and
requires extensive efforts. The best combination of the techniques and parameters may depend on the
quality of the DBT images, which, in turn, depends on the imaging system and acquisition geometries
(e.g., the tomographic angle, the angular increments, and the number and distribution of the projection
views), as well as the reconstruction and regularization techniques. Retraining is most likely necessary to translate a CAD system developed for one acquisition geometry or a specific reconstruction
technique to another as the DBT system and reconstruction technique evolve over time. Even if a CAD
system is designed with the goal to be adaptive to these variables, rigorous validation is still essential to
assure the system can perform within expectation [122,123].
Common to any machine-learning problems is the fact that there are a number of parameters in the
various image processing and decision-making steps in the CAD system. The optimization of these
parameters depends on learning the image characteristics from the training set. In general, a more complex algorithm with a larger number of parameters requires a larger number of training samples, and
overtraining with a limited training set will generalize poorly to independent cases [83,124– 129]. The
flexibility of combining the various 2D and 3D processing approaches for lesion detection or diagnosis
in DBT increases the dimensionality of the parameter space and the complexity of the CAD system.
The “ test” set used in validating the performance during the optimization process becomes a part of
the training set after numerous repeated uses so that it cannot guard against overfitting to the training
or test cases. It will be imperative to use a large-enough set to train and validate the CAD systems, but
ultimately the robustness of the developed systems can only be assured by testing with sequestered,
independent cases representative of the intended population [123].
Computer-Aided Diagnosis of Breast Cancer with Tomosynthesis Imaging
261
Acknowledgments
The work in digital breast tomosynthesis conducted at the University of Michigan was supported by
National Institutes of Health awards R01 CA151443 and R21/R33 CA120234 (PI: Heang-Ping Chan), and
from the efforts of many current and former members of the CAD Research Laboratory and many of our
clinical colleagues in the Department of Radiology.
References
1. Lauby-Secretan B, Scoccianti C, Loomis D, Benbrahim-Tallaa L, Bouvard V, Bianchini F, Straif
K. Int Agcy Res Canc Handbook W. Breast-Cancer Screening: Viewpoint of the IARC Working
Group. New England Journal of Medicine 2015;372(24): 2353– 8.
2. Siegel RL, Miller KD, Jemal A. Cancer Statistics, 2015. Ca-a Cancer Journal for Clinicians 2015;65(1):
5– 29.
3. Hendrick RE, Helvie MA, Hardesty LA. Implications of CISNET modeling on number needed to
screen and mortality reduction with digital mammography in women 40– 49 years old. American
Journal of Roentgenology 2014;203(6): 1379– 81.
4. Mandelson MT, Oestreicher N, Porter PL, White D, Finder CA, Taplin SH, White E. Breast density
as a predictor of mammographic detection: Comparison of interval- and screen-detected cancers.
Journal of the National Cancer Institute 2000;92(13): 1081– 7.
5. Pediconi F, Catalano C, Roselli A, Dominelli V, Cagioli S, Karatasiou A, Pronio A, Kirchin MA,
Passariello R. The challenge of imaging dense breast parenchyma is magnetic resonance mammography the technique of choice? A comparative study with X-ray mammography and wholebreast ultrasound. Investigative Radiology 2009;44(7): 412– 21.
6. Rosenberg RD, Yankaskas BC, Abraham LA, Sickles EA, Lehman CD, Geller BM, Carney PA,
Kerlikowske K, Buist DSM, Weaver DL, Barlow WE, Ballard-Barbash R. Performance benchmarks for screening mammography. Radiology 2006;241(1): 55– 66.
7. Skaane P, Bandos AI, Gullien R, Eben EB, Ekseth U, Haakenaasen U, Izadi M, Jebsen IN, Jahr
G, Krager M, Niklason LT, Hofvind S, Gur D. Comparison of digital mammography alone and
digital mammography plus tomosynthesis in a population-based screening program. Radiology
2013;267(1): 47– 56.
8. Skaane P, Bandos AI, Gullien R, Eben EB, Ekseth U, Haakenaasen U, Izadi M, Jebsen IN, Jahr G,
Krager M, Hofvind S. Prospective trial comparing full-field digital mammography (FFDM) versus
combined FFDM and tomosynthesis in a population-based screening programme using independent double reading with arbitration. European Radiology 2013;23(8): 2061– 71.
9. Bernardi D, Caumo F, Macaskill P, Ciatto S, Pellegrini M, Brunelli S, Tuttobene P, Bricolo P, Fanto
C, Valentini M, Montemezzi S, Houssami N. Effect of integrating 3D-mammography (digital
breast tomosynthesis) with 2D-mammography on radiologists' true-positive and false-positive
detection in a population breast screening trial. European Journal of Cancer 2014;50(7): 1232– 8.
10. Caumo F, Bernardi D, Ciatto S, Macaskill P, Pellegrini M, Brunelli S, Tuttobene P, Bricolo P, Fanto C,
Valentini M, Montemezzi S, Houssami N. Incremental effect from integrating 3D-mammography
(tomosynthesis) with 2D-mammography: Increased breast cancer detection evident for screening
centres in a population-based trial. Breast 2014;23(1): 76– 80.
11. Rose SL, Tidwell AL, Bujnoch LJ, Kushwaha AC, Nordmann AS, Sexton R. Implementation of
breast tomosynthesis in a routine screening practice: An observational study. American Journal of
Roentgenology 2013;200(6): 1401– 8.
12. Friedewald SM, Rafferty EA, Rose SL, Durand MA, Plecha DM, Greenberg JS, Hayes MK, Copit
DS, Carlson KL, Cink TM, Barke LD, Greer LN, Miller DP, Conant EF. Breast cancer screening
using tomosynthesis in combination with digital mammography. JAMA-Journal of the American
Medical Association 2014;311(24): 2499– 507.
262
Medical Image Analysis and Informatics: Computer-Aided Diagnosis and Therapy
13. Lang K, Andersson I, Rosso A, Tingberg A, Timberg P, Zackrisson S. Performance of one-view
breast tomosynthesis as a stand-alone breast cancer screening modality: Results from the Malmo
Breast Tomosynthesis Screening Trial, a population-based study. European Radiology 2016;26(1):
184– 90.
14. Skaane P, Bandos AI, Eben EB, Jebsen IN, Krager M, Haakenaasen U, Ekseth U, Izadi M, Hofvind
S, Gullien R. Two-view digital breast tomosynthesis screening with synthetically reconstructed
projection images: Comparison with digital breast tomosynthesis with full-field digital mammographic images. Radiology 2014;271(3): 655– 63.
15. Gilbert FJ, Tucker L, Gillan MG, Willsher P, Cooke J, Duncan KA, Michell MJ, Dobson HM, Lim
YY, Purushothaman H, Strudley C, Astley SM, Morrish O, Young KC, Duffy SW. The TOMMY
trial: A comparison of TOMosynthesis with digital Mammography in the UK NHS Breast
Screening Programme— A multicentre retrospective reading study comparing the diagnostic performance of digital breast tomosynthesis and digital mammography with digital mammography
alone. Health Technology Assessment 2015;19(4): 1– 136.
16. Poplack SP, Tosteson TD, Kogel CA, Nagy HM. Digital breast tomosynthesis: Initial experience
in 98 women with abnormal digital screening mammography. American Journal of Roentgenology
2007;189(3): 616– 23.
17. Gur D, Abrams GS, Chough DM, Ganott MA, Hakim CM, Perrin RL, Rathfon GY, Sumkin JH,
Zuley ML, Bandos AI. Digital breast tomosynthesis: Observer performance study. American
Journal of Roentgenology 2009;193(2): 586– 91.
18. Wallis MG, Moa E, Zanca F, Leifland K, Danielsson M. Two-view and single-view tomosynthesis
versus full-field digital mammography: High-resolution x-ray imaging observer study. Radiology
2012;262:788– 96.
19. Kopans D, Gavenonis S, Halpern E, Moore R. Calcifications in the breast and digital breast tomosynthesis. Breast Journal 2011;17(6): 638– 44.
20. Andersson I, Ikeda DM, Zackrisson S, Ruschin M, Svahn T, Timberg P, Tingberg A. Breast tomosynthesis and digital mammography: A comparison of breast cancer visibility and BIRADS classification in a population of cancers with subtle mammographic findings. European Radiology
2008;18:2817– 25.
21. Spangler ML, Zuley ML, Sumkin JH, Abrams G, Ganott MA, Hakim C, Perrin R, Chough DM,
Shah R, Gur D. Detection and classification of calcifications on digital breast tomosynthesis and
2D digital mammography: A comparison. American Journal of Roentgenology 2011;196(2): 320– 4
22. Gennaro G, Toledano A, di Maggio C, Baldan E, Bezzon E, La Grassa M, Pescarini L, Polico I,
Proietti A, Toffoli A, Muzzio PC. Digital breast tomosynthesis versus digital mammography: A
clinical performance study. European Radiology 2010;20(7): 1545– 53.
23. Teertstra HJ, Loo CE, van den Bosch MAAJ, van Tinteren H, Rutgers EJT, Muller SH, Gilhuijs
KGA. Breast tomosynthesis in clinical practice: initial results. European Radiology 2010;20(1):
16– 24.
24. Svahn TM, Chakraborty DP, Ikeda D, Zackrisson S, Do Y, Mattsson S, Andersson I. Breast tomosynthesis and digital mammography: a comparison of diagnostic accuracy. British Journal of
Radiology 2012;85(1019): E1074– E82.
25. Gennaro G, Hendrick RE, Toledano A, Paquelet JR, Bezzon E, Chersevani R, di Maggio C,
La Grassa M, Pescarini L, Polico I, Proietti A, Baldan E, Pomerri F, Muzzio PC. Combination
of one-view digital breast tomosynthesis with one-view digital mammography versus standard two-view digital mammography: per lesion analysis. European Radiology 2013;23(8):
2087– 94.
26. Thibault F, Dromain C, Breucq C, Balleyguier CS, Malhaire C, Steyaert L, Tardivon A, Baldan E,
Drevon H. Digital breast tomosynthesis versus mammography and breast ultrasound: a multireader performance study. European Radiology 2013;23(9): 2441– 9.
Computer-Aided Diagnosis of Breast Cancer with Tomosynthesis Imaging
263
27. Waldherr C, Cerny P, Altermatt HJ, Berclaz G, Ciriolo M, Buser K, Sonnenschein MJ. Value of
One-View Breast Tomosynthesis Versus Two-View Mammography in Diagnostic Workup of
Women With Clinical Signs and Symptoms and in Women Recalled From Screening. American
Journal of Roentgenology 2013;200(1): 226– 31.
28. Shin SU, Chang JM, Bae MS, Lee SH, Cho N, Seo M, Kim WH, Moon WK. Comparative evaluation of average glandular dose and breast cancer detection between single-view digital breast
tomosynthesis (DBT) plus single-view digital mammography (DM) and two-view DM: correlation with breast thickness and density. European Radiology 2015;25(1): 1– 8.
29. Gur D, Zuley ML, Anello MI, Rathfon GY, Chough DM, Ganott MA, Hakim CM, Wallace L, Lu A,
Bandos AI. Dose Reduction in Digital Breast Tomosynthesis (DBT) Screening using Synthetically
Reconstructed Projection Images: An Observer Performance Study. Academic Radiology
2012;19(2): 166– 71.
30. Chan H-P, Sahiner B, Wei J, Hadjiiski LM, Zhou C, Helvie MA. Digital breast tomosynthesis: Computerized detection of microcalcifications in reconstructed breast volume using a 3D
approach. Proceedings of SPIE 2010;7624: 76241D.
31. Sahiner B, Chan H-P, Hadjiiski LM, Helvie MA, Wei J, Zhou C, Lu Y. Computer-aided detection
of clustered microcalcifications in digital breast tomosynthesis: A 3D approach. Medical Physics
2012;39(1): 28– 39.
32. Hadjiiski L, Chan H-P, Wei J, Sahiner B, Zhou CA, Helvie MA. Digital breast tomosynthesis:
Feasibility of automated detection of microcalcification clusters on projections views. Proceedings
of SPIE 2010;7624: 76241F.
33. Wei J, Chan H-P, Hadjiiski L, Helvie MA, Zhou C, Lu Y. Computer-aided detection of microcalcifications in digital breast tomosynthesis (DBT): A multichannel signal detection approach on
projection views. Proceedings of SPIE 2012;8315: 83152D.
34. Samala RK, Chan H-P, Lu Y, Hadjiiski L, Wei J, Sahiner B, Helvie M. Detection of microcalcifications in breast tomosynthesis reconstructed with multiscale bilateral filtering regularization.
Proceedings of SPIE 2013;8670: 86701L.
35. Bernard S, Muller S, Onativia J. Computer-aided microcalcification detection on digital breast
tomosynthesis data: A preliminary evaluation. IWDM 2008: Lecture Notes in Computer Science
2008;5116:151– 7.
36. Reiser I, Nishikawa RM, Edwards AV, Kopans DB, Schmidt RA, Papaioannou J, Moore RH.
Automated detection of microcalcification clusters for digital breast tomosynthesis using projection data only: A preliminary study. Medical Physics 2008;35(4): 1486– 93.
37. van Schie G, Karssemeijer N. Noise model for microcalcification detection in reconstructed tomosynthesis slices. Proceedings of SPIE 2009;7260: 72600M.
38. Samala RK, Chan H-P, Lu Y, Hadjiiski L, Wei J, Sahiner B, Helvie MA. Computer-aided detection
of clustered microcalcifications in multiscale bilateral filtering regularized reconstructed digital
breast tomosynthesis volume. Medical Physics 2014;41(2): 021901– 1 (14 pages).
39. Wei J, Chan H-P, Hadjiiski LM, Helvie MA, Lu Y, Zhou C, Samala R. Multichannel response
analysis on 2D projection views for detection of clustered microcalcifications in digital breast
tomosynthesis. Medical Physics 2014;41(4): 041913– 1 (11 pages).
40. Samala RK, Chan H-P, Lu Y, Hadjiiski LM, Wei J, Helvie MA. Digital breast tomosynthesis:
Computer-aided detection of clustered microcalcifications on planar projection images. Physics in
Medicine and Biology 2014;59(23): 7457– 77.
41. Samala RK, Chan H-P, Lu Y, Hadjiiski LM, Wei J, Helvie MA. Computer-aided detection system for clustered microcalcifications in digital breast tomosynthesis using joint information from
volumetric and planar projection images. Physics in Medicine and Biology 2015;60(21): 8457– 79.
42. Lu Y, Chan H-P, Wei J, Hadjiiski LM. Selective-diffusion regularization for enhancement of microcalcifications in digital breast tomosynthesis reconstruction. Medical Physics 2010;37:6003– 14.
264
Medical Image Analysis and Informatics: Computer-Aided Diagnosis and Therapy
43. Lu Y, Chan H-P, Wei J, Hadjiiski L, Zhou C. Multiscale regularized reconstruction for enhancing
microcalcification in digital breast tomosynthesis. Proceedings of SPIE 2012;8313: 831322.
44. Sidky EY, Pan X, Reiser I, Nishikawa RM, Moore RH, Kopans DB. Enhanced imaging of microcalcifications in digital breast tomosynthesis through improved image-reconstruction algorithms.
Medical Physics 2009;36(11): 4920– 32.
45. Das M, Gifford HC, O' Connor JM, Glick SJ. Penalized maximum likelihood reconstruction for
improved microcalcification detection in breast tomosynthesis. IEEE Transactions on Medical
Imaging 2011;30(4): 904– 14.
46. Acciavatti RJ, Maidment ADA. Observation of super-resolution in digital breast tomosynthesis.
Medical Physics 2012;39(12): 7518– 39.
47. Bernardi D, Ciatto S, Pellegrini M, Anesi V, Burlon S, Cauli E, Depaoli M et al. Application of
breast tomosynthesis in screening: Incremental effect on mammography acquisition and reading
time. British Journal of Radiology 2012;85(1020): E1174– E8.
48. Dang PA, Freer PE, Humphrey KL, Halpern EF, Rafferty EA. Addition of tomosynthesis to conventional digital mammography: Effect on image interpretation time of screening examinations.
Radiology 2014;270(1): 49– 56.
49. Zhang Y, Chan H-P, Goodsitt MM, Schmitz A, Eberhard J, Claus B. Investigation of different PV
distributions in digital tomosynthesis mammography (DTM). Proceedings of 9th International
Workshop on Digital Mammography 2008;LNCS 5116: 593– 600.
50. Lu Y, Chan H-P, Wei J, Goodsitt MM, Carson PL, Hadjiiski L, Schmitz A, Eberhard JW, Claus
BEH. Image quality of microcalcifications in digital breast tomosynthesis: Effects of projectionview distributions. Medical Physics 2011;38(10): 5703– 12.
51. Hu YH, Zhao B, Zhao W. Image artifacts in digital breast tomosynthesis: Investigation of the
effects of system geometry and reconstruction parameters using a linear system approach. Medical
Physics 2008;35(12): 5242– 52.
52. Gifford HC, Didier CS, Das M, Glick SJ. Optimizing breast-tomosynthesis acquisition parameters
with scanning model observers. Proceedings of SPIE 2008;6917: 69170S.
53. Chawla AS, Lo JY, Baker JA, Samei E. Optimized image acquisition for breast tomosynthesis in
projection and reconstruction space. Medical Physics 2009;36:4859– 69.
54. Sechopoulos I, Ghetti C. Optimization of the acquisition geometry in digital tomosynthesis of the
breast. Medical Physics 2009;36(4): 1199– 207.
55. Reiser I, Nishikawa RM. Task-based assessment of breast tomosynthesis: Effect of acquisition
parameters and quantum noise. Medical Physics 2010;37(4): 1591– 600.
56. Mertelmeier T, Ludwig J, Zhao B, Zhao W. Optimization of tomosynthesis acquisition parameters:
Angular range and number of projections. Proceedings of 9th International Workshop on Digital
Mammography 2008;LNCS 5116: 220– 7.
57. Tucker AW, Lu JP, Zhou O. Dependency of image quality on system configuration parameters in a
stationary digital breast tomosynthesis system. Medical Physics 2013;40(3): 031917.
58. Chan H-P, Goodsitt MM, Helvie MA, Zelakiewicz S, Schmitz A, Noroozian M, Paramagul C et al.
Digital breast tomosynthesis: Observer performance of clustered microcalcification detection on
breast phantom images acquired with an experimental system using variable scan angles, angular
increments, and number of projection views. Radiology 2014;273(3): 675– 85.
59. Goodsitt MM, Chan H-P, Schmitz A, Zelakiewicz S, Telang S, Hadjiiski L, Watcharotone K et
al. Digital breast tomosynthesis: Studies of the effects of acquisition geometry on contrast-tonoise ratio and observer preference of low-contrast objects in breast phantom images. Physics in
Medicine and Biology 2014;59(19): 5883– 902.
60. Park HS, Kim YS, Kim HJ, Choi YW, Choi JG. Optimization of configuration parameters in a
newly developed digital breast tomosynthesis system. Journal of Radiation Research 2014;55(3):
589– 99.
Computer-Aided Diagnosis of Breast Cancer with Tomosynthesis Imaging
265
61. Niklason LT, Christian BT, Niklason LE, Kopans DB, Castleberry DE, Opsahl-Ong BH, Landberg
CE et al. Digital tomosynthesis in breast imaging. Radiology 1997;205:399– 406.
62. Wu T, Stewart A, Stanton M, McCauley T, Phillips W, Kopans DB, Moore RH et al. Tomographic
mammography using a limited number of low-dose cone-beam projection images. Medical Physics
2003;30:365– 80.
63. Suryanarayanan S, Karellas A, Vedantham S, Baker SP, Glick SJ, D' Orsi CJ, Webber RL. Evaluation
of linear and nonlinear tomosynthetic reconstruction methods in digital mammography.
Academic Radiology 2001;8:219– 24.
64. Dobbins JT, Godfrey DJ. Digital x-ray tomosynthesis: Current state of the art and clinical potential. Physics in Medicine and Biology 2003;48:R65– R 106.
65. Zhang Y, Chan H-P, Sahiner B, Wei J, Goodsitt MM, Hadjiiski LM, Ge J, Zhou C. A comparative study of limited-angle cone-beam reconstruction methods for breast tomosynthesis. Medical
Physics 2006;33(10): 3781– 95.
66. Zhang Y, Chan H-P, Sahiner B, Wei J, Zhou C, Hadjiiski LM. Artifact reduction methods for truncated projections in iterative breast tomosynthesis reconstruction. Journal of Computer Assisted
Tomography 2009;33:426– 35.
67. Zhang Y, Chan H-P, Sahiner B, Wu Y-T, Zhou C, Ge J, Wei J, Hadjiiski LM. Application of boundary detection information in breast tomosynthesis reconstruction. Medical Physics 2007;34(9):
3603– 13.
68. Lu Y, Chan H-P, Wei J, Hadjiiski L, Samala R. Multiscale bilateral filtering for improving image
quality in digital breast tomosynthesis. Medical Physics 2015;42(1): 182– 95.
69. Vieira MAC, de Oliveira HCR, Nunes PF, Borges LR, Bakic PR, Barufaldi B, Acciavatti RJ,
Maidment ADA. Feasibility study of dose reduction in digital breast tomosynthesis using nonlocal denoising algorithms. Medical Imaging 2015: Physics of Medical Imaging ; 2015.
70. Zheng J, Fessler JA, Chan H-P. Digital breast tomosynthesis reconstruction with detector blur
and correlated noise. Proceedings of 4th International Conference on Image Formation in X-Ray
Computed Tomography 2016;CT-Meeting 2016: 21– 4.
71. Mainprize JG, Bloomquist AK, Kempston MP, Yaffe MJ. Resolution at oblique incidence angles of
a flat panel imager for breast tomosynthesis. Medical Physics 2006;33(9): 3159– 64.
72. Acciavatti RJ, Maidment ADA. Oblique reconstructions in tomosynthesis. II. Super-resolution.
Medical Physics 2013;40(11): 111912– 1 (19 pages).
73. Zheng J, Fessler JA, Chan HP. Segmented Separable Footprint Projector for Digital Breast
Tomosynthesis and Its application for Subpixel Reconstruction. Medical Physics 2017;44(3):
986-1001.
74. Claus B, Chan H-P. Digital breast tomosynthesis reconstruction with an adaptive voxel grid.
Proceedings of SPIE 2014;9033: 90335A.
75. van Schie G, Mann R, Imhof-Tas M, Karssemeijer N. Generating synthetic mammograms from
reconstructed tomosynthesis volumes. IEEE Transactions on Medical Imaging 2013;32(12): 2322– 31.
76. Peters G, Muller S, Bernard S, Iordache R, Wheeler F, Bloch I. Reconstruction-independent 3D CAD
for calcification detection in digital breast tomosynthesis using fuzzy particles. In Proceedings of
Conference 10th Iberoamerican Congress on Pattern Recognition, CIARP 2005: Progress in Pattern
Recognition, Image Analysis and Applications. November 15– 18; Havana, Cuba: Springer-Verlag
Berlin, 2005.
77. Park SC, Zheng B, Wang XH, Gur D. Applying a 2D based CAD scheme for detecting microcalcification clusters using digital breast tomosynthesis images: An assessment— art. no. 691507.
Proceedings of SPIE 2008;6915:6915071– 8.
78. Lu Y, Chan H-P, Fessler JA, Hadjiiski L, Wei J, Goodsitt MM. Adaptive diffusion regularization for
enhancement of microcalcifications in digital breast tomosynthesis (DBT) reconstruction. SPIE
Medical Imaigng Conference: Physics of Medical Imaging , 2011;7961: 796117(1– 9).