Ebook Master visual diagnosis of ECG - A short atlas: Part 1
Bạn đang xem bản rút gọn của tài liệu. Xem và tải ngay bản đầy đủ của tài liệu tại đây (5.46 MB, 80 trang )
Master Visual Diagnosis of
ECG
A Short Atlas
Master Visual Diagnosis of
ECG
A Short Atlas (Learn ECG Through ECG)
Shahzad Khan MD
Ren Jiang Hua MBBS MD
Cardiologist
Wuhan University School of Medicine
China
Interventional Cardiologist
Wuhan University School of Medicine
China
®
JAYPEE BROTHERS MEDICAL PUBLISHERS (P) LTD
New Delhi • London • Philadelphia • Panama
®
Jaypee Brothers Medical Publishers (P) Ltd
Headquarters
Jaypee Brothers Medical Publishers (P) Ltd.
4838/24, Ansari Road, Daryaganj
New Delhi 110 002, India
Phone: +91-11-43574357
Fax: +91-11-43574314
Email:
Overseas Offices
J.P. Medical Ltd.
83, Victoria Street, London
SW1H 0HW (UK)
Phone: +44-2031708910
Fax: +02-03-0086180
Email:
Jaypee-Highlights Medical Publishers Inc.
City of Knowledge, Bld. 237, Clayton
Panama City, Panama
Phone: +507-301-0496
Fax: +507-301-0499
Email:
Jaypee Brothers Medical Publishers Ltd
The Bourse
111 South Independene Mall East
Suite 835, Philadelphia, PA 19106, USA
Phone: +267-519-9789
Email:
Jaypee Brothers Medical Publishers (P) Ltd
17/1-B Babar Road, Block-B, Shaymali
Mohammadpur, Dhaka-1207
Bangladesh
Mobile: +08801912003485
Email:
Jaypee Brothers Medical Publishers (P) Ltd
Shorakhute, Kathmandu
Nepal
Phone: +00977-9841528578
Email:
Website: www.jaypeebrothers.com
Website: www.jaypeedigital.com
© 2013, Jaypee Brothers Medical Publishers
All rights reserved. No part of this book may be reproduced in any form or by any means without the prior permission
of the publisher.
Inquiries for bulk sales may be solicited at:
This book has been published in good faith that the contents provided by the authors contained herein are original, and
is intended for educational purposes only. While every effort is made to ensure accuracy of information, the publisher
and the authors specifically disclaim any damage, liability, or loss incurred, directly or indirectly, from the use or
application of any of the contents of this work. If not specifically stated, all figures and tables are courtesy of the authors.
Where appropriate, the readers should consult with a specialist or contact the manufacturer of the drug or device.
Master Visual Diagnosis of ECG: A Short Atlas (Learn ECG Through ECG)
First Edition: 2013
ISBN
978-93-5090-489-3
Printed at
Dedicated to
Dr Sahibzada Tasleem Rasool,
Assistant Professor, King Faisal University, Al-Ahsa,
Kingdom of Saudi Arabia
for his support and valuable guidance in
our studies and in writing of this book.
PREFACE
This book is written with the intention to present main ECG diagnoses in a very easy, quick and retainable
manner. There are many books available on this topic. So what is the reason for writing a new book? Answer is
two-fold! Firstly, we have noticed that undergraduate medical students and junior residents cannot find time to
go through much detailed books as they have to study other subjects and have to work in the hospital.
Secondly, ECG is a visual diagnosis which needs clear “Visual” explanation in terms of ECG graphs and
schematic diagrams to show normal and abnormal presentations more clearly. We guarantee the readers that
they will find almost every normal and abnormal finding commonly encountered in ECG in wards with its
explanation from real ECGs and useful tables and schematic diagrams, while the text stressing more on the
diagnostic points so the readers can readily understand characteristic features of conditions and memorize it
visually. In order to present ECG diagnoses in a more real-looking situation and to encourage the readers to
hunt for abnormalities, we tried to avoid marking the abnormalities with arrows, circles or asterisk as much as
possible. This creates an ECG Hunting Reflex in the readers and Look-Note-Diagnose approach instead of
Read-Memorize-Diagnose approach seen in other books. In fact, this book may be regarded as a mini atlas for
basic ECG diagnosis.
Other feature of this book is that it also presents logical explanation of different ECG findings that why
specific conditions present with specific ECG appearance. For example, in right bundle branch block why lead
V1 present with specific morphology. Another feature which the readers will find much helpful is the axis
description. It is presented in a very comprehensive and interesting way which will remove fear of the readers
for cardiac axis (In fact, we have heard from many of our friends and colleagues that they hesitate from ECG
mainly because of the difficulty in understanding and determination of cardiac axis).
The book consists of two sections, the first deals with basic concepts [Deep Analysis Section (DAS)]
which makes the readers to understand how normal and abnormal ECG and components of ECG including
waves, segments and intervals present, while the second [Quick Diagnosis Section (QDS)] section deals with
how to diagnose specific appearance in ECG.
The other benefit of the above-mentioned twosections is that after clarification of basic concepts of ECG,
the readers do not need to repeatedly consult the main text while they encounter with ECGs in the wards or
during revision for examinations and they can just pay attention to diagnoses.
viii Master Visual Diagnosis of ECG: A Short Atlas
We thank Dr Wang Wei Na from Department of ECG in Zhongnan Hospital for providing us valuable ECGs.
Our special thanks to our Chinese friends Su Yu Tong, Xia Xi Ya, Zhang Wei and Zhang Xiang Yu for providing
us much help in necessary translations from Chinese to English. We also thank all writers and publishers from
where we have got help. Special thanks to our junior undergraduate fellow Adnan Aslam who profoundly
helped us in typing, editing and in index making of the book. We also like to thank Junaid and Umair (Wuhan
University Medical College). Finally, we thank Dr Sahibzada Tasleem Rasool (Assistant Professor, King Faisal
University, Al-Ahsa, Saudi Arabia) for his valuable guidance.
We hope this book will fulfill the requirements of readers. We welcome every suggestion and correction to
improve the book in the next edition.
Shahzad Khan
Ren Jiang Hua
ACKNOWLEDGMENTS
We would like to thank:
• Department of Electrocardiography, Wuhan University, Zhongnan Hospital, Wuhan, China
• Clinical Electrocardiography by Franklin H Zimmerman
• Braunwald’s Heart Disease by Douglas P Zipes, Peter Libby, Eugene Braunwald, Robert Bonow
• Rapid ECG Interpretation by M Gabriel Khan
• ABC of Clinical Electrocardiography by Francis Morris, June Edhouse, William Brady, John Camm
• Intra-A-Type Variation of Wolff-Parkinson-White (WPW) Syndrome by Juhani Heikkila and Antti Jounela,
British Heart Journal
• Bidirectional Tachycardia: Two Cases and a Review by Ali Al-Khafaji, Howard L Corwin, Gur C Adhar, and
Mark L Greenberg
• ECG Notes by Shirley A Jones
• The Brugada Syndrome by Charles Antzelevitch, Pedro Brugada, Joseph Brugada, Ramon Brugada
• The ECG Made Easy by John R Hampton
• Pacemaker Overview by Stuart Allen, Technical Head of Southampton General Hospital
• Alan Lindsay, ECG Learning , Frank G Yanowitz, USA
• Heart Block, Second Degree, Michael D Levine
• Cardiology Explained by Euan A Ashley and Josef Niebauer
• www.ecglibrary.com by Dean Jenkins and Stephen Gerred
• ECGpedia, Wiki ECG Course
• Ashman Phenomenon, Ram C Sharma, USA
• Arrhythmia Recognition by Tomas B Garcia, Geoffrey T Miller
• wikipedia.org
• The Only EKG Book you will Ever Need by Malcolm S Thaler
x
Master Visual Diagnosis of ECG: A Short Atlas
• Journal(s) of the American College of Cardiology (JACC)
• Electrocardiographic Case: A Middle Aged, Seriously Ill Woman with an Unusual ECG and Wide Complex
Tachycardia, P Shah, WS Teo, SMJ (Singapore Medical Journal)
• Electrocardiography of Clinical Arrhythmias by Charles Fisch, Suzanne B Knoebel
• Atrioventricular Nodal Reentry Tachycardia (AVNRT): Brian, Chirag M Sandesara
• ECG-SAP III: Electrocardiography Self-Assessment Program
• Electrocardiography: 100 Diagnostic Criteria by Harold L Brooks
• How to Quickly and Accurately Master Arrhythmia Interpretation by Dale Davis
• ECG Pocket Guide by Bradford C Lipman and Bernard S Lipman
• Advanced ECG: Board and Beyond by Brendan P Phibbs
• Textbook of Cardiovascular Medicine by Eric J Topol, Robert M Califf, Eric N Prystowsky, James D
Thomas, Paul D Thompson
• “R-on-T” Phenomenon", Paul, Oupadia, Krishnaswamy Ramswamy, the New England Journal of Medicine.
CONTENTS
Section 1: Deep Analysis Section (DAS)
What Concept Do You Need to Have for Better Understanding of ECG?
What are ECG Leads?
How to Take ECG Recording?
What Concept You Need to Know to Get Familiar with PQRS Complex?
T Wave in Depth
Amplitude of T Wave
When You Say U Wave, What Do You Mean?
Segments + Intervals of ECG
Handshake with "Electrical Axis"
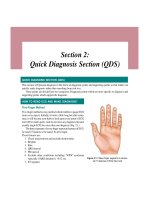
Section 2: Quick Diagnosis Section (QDS)
How to Read ECG and Make Diagnosis?
Lead Position Reversal
Determine Rate/Rhythm
Sinus Rhythm
Sinus Bradycardia
Sinus Tachycardia
Dextrocardia
Atrioventricular Block (AV block)
Introduction to Electrocariographic Features of Myocardial Infarction
Right Bundle Branch Block (RBBB)
Some Details of Fascicular Blocks
Arrhythmias
1
1
3
9
10
24
31
34
36
59
67
67
69
71
72
73
73
74
74
83
98
105
122
xii
Master Visual Diagnosis of ECG: A Short Atlas
Get Familiar with Tachycardia
Atrioventricular Reciprocating Tachycardia (AVRT) or AV Pre-excitation Tachycardia
Important Pre-excitation Syndromes
Miscellaneous Conditions
Self-assessment
133
150
152
175
207
Index
227
SOME ABBREVIATIONS USED IN THIS BOOK
AF
Atrial fibrillation
AF
Atrial flutter
AMI
Acute myocardial infarction
APC
Atrial premature contraction
ASD
Atrial septal defect
AV
Atrioventricular
AVNRT
Atrioventricular re-entry tachycardia
AVRT
Atrioventricular reciprocating tachycardia
AMI
Anterior myocardial infarction
BPM
Beats per minute
COPD
Chronic obstructive pulmonary disease
CV
Cardiovascular
CVA
Cerebrovascular accident
ECG
Electrocardiogram
EKG
Electrocardiogram
JPC
Junctional premature contraction
LA
Left atrium
LAD
Left anterior descending or Left axis deviation
LAFB
Left anterior fascicular block
LBBB
Left bundle branch block
LCA
Left coronary artery
LCX
Left circumflex
xiv Master Visual Diagnosis of ECG: A Short Atlas
LPFB
Left posterior fascicular block
LV
Left ventricle
LVH
Left ventricular hypertrophy
MAT
Multifocal atrial tachycardia
NSR
Normal sinus rhythm
PAT
Paroxysmal supraventricular tachycardia
PE
Pulmonary embolism
PSVT
Paroxysmal supraventricular tachycardia
RA
Right atrium
RBBB
Right bundle branch block
RCA
Right coronary artery
RV
Right ventricle
RVH
Right ventricular hypertrophy
SA
Sinoatrial
STEMI
ST elevation myocardial infarction
SVT
Supraventricular tachycardia
VF
Ventricular fibrillation
VPC
Ventricular premature complex
VSD
Ventricular septal defect
VT
Ventricular tachycardia
WPW syndrome
Wolff-Parkinson-White syndrome
Section 1:
Deep Analysis Section (DAS)
WHAT CONCEPT DO YOU NEED TO HAVE FOR BETTER UNDERSTANDING OF ECG?
A simple ECG strip provides more than 100 diagnoses itself alone. The detailed physiology of electrical activity
in the heart resulting in 12-lead ECG usually presented in the other ECG books makes students think ECG is
very difficult. Therefore, we highlight here the very core concepts which are easy to understand and will help
students to LOOK-NOTE-DIAGNOSE rather than READ-MEMORIZE-DIAGNOSE.
What is ECG?
Electrocardiography is the final outcome of physiological and technological processes which start from the
current generator in the heart till you interpret.
Sequence showing (Fig. 1.1) how ECG generates. In fact, any factor on the right or left can change the
ECG morphology and its interpretation.
Current Generation in the Heart
Normally current generates from SA node (Sinoatrial node) which is the main generator or pacemaker causes
sinus rhythm. AV node (atrioventricular node) which is at the junction of atrium and ventricle, the current
passes through it from atrium to ventricle with a inherent capacity of AV node to delay the passage of current
from atrium to ventricle (Fig. 1.2).
Sometimes, current can generate from other ectopic areas in the:
• Atrial tissue
• Ventricle tissue
• Tissue surrounding AV node
Impulse arising from these areas causes “Extrasystole” or beats beside the normal beats. Therefore, if these
ectopic areas cause any beats these are called “Premature” or extra beats and in a normally going ECG tracing,
its shape gives a clue that whether it has arisen from atrium “atrial premature contraction (APC)”, Ventricle
“ventricular premature contraction (VPC)”, or around AV junction “Junctional premature contraction (JPC)”.
2
Master Visual Diagnosis of ECG: A Short Atlas
Cardiac generator
SA node, AV node, ectopic
focus generating impulse, etc.
Activation sequences
Cardiac electrical field
AV blocks, bundle branch
blocks (BBB), fascicular
blocks (FBs)
Transmission factor
Body surface potentials
Thickness of body wall, etc.
Leads, amplifier
ECG recording
Misplaced leads
Diagnostic criteria
ECG interpretation
Of course wrong interpretation
can damage ECG diagnosis
Figure 1.1: ECG from generation to interpretation
Ectopic
foci atrium
Left anterior
fascicle
SA node
Bundle of His
Left bundle
branch
AV node
Left posterior
fascicle
Ectopic
foci ventricle
Right bundle
branch
Figure 1.2: The foci which can generate current and the pathways where current flows
Deep Analysis Section (DAS)
3
Note that in normal state SA node’s rhythm over-rides all other tissues which can cause impulse generation. Therefore, it is the only source of currents initiation and rest of the system only transmits. That’s why in
normal state it is called PACEMAKER. “In conditions when SA node fails to generate current, surrounding
parts (AV node, ventricular tissue and Purkinje fibers in descending order) take the place of SA node and
become dominant current generator. Since their maximum rate at which they can generate current is not same
examining their rate can give us the clue that which part is now pacemaker (See next section for details)”.
WHAT ARE ECG LEADS?
There are different leads which can conduct the electrical activity of the heart through body walls to ECG
machine, this current is then amplified appropriately to be viewable on a screen or printed on ECG strip.
Each lead “looks” heart from a different angle, therefore their recording is different in morphology.
There are two groups of leads:
1. Limb leads
2. Chest leads
In fact, modern ECG machine increases the amplitude of these leads by 50 percent, hence called augmented
voltage leads (Figs 1.3, 1.4 and Table 1.1).
Table 1.1: Limb leads arrangement
Limb leads
Unipolar augmented voltage leads
aVR, aVL, aVF
Bipolar standard leads I, II, III
Standard lead I............... – ve pole
+ ve pole
Right arm
Left arm
aVR....... +ve pole
–ve pole
Standard lead II............... – ve pole
+ ve pole
Right arm
Left leg
aVL....... + ve pole
– ve pole
Left arm
Right arm plus left leg
Left arm
Left leg
aVF....... + ve pole
– ve pole
Left arm
Left arm plus right leg
Standard lead III............... – ve pole
+ ve pole
Right arm
Left arm plus left leg
4
Master Visual Diagnosis of ECG: A Short Atlas
Lead I
Lead II
Lead III
RL
RA
LL
RA
LA
RL
LL
RL
LA
LL
Figure 1.3: Limb leads arrangement in standard limb leads
Lead aVR
RA
LA
LL
Lead aVL
RA
LA
LL
Lead aVF
RA
LA
LL
Figure 1.4: Lead arrangement in unipolar augmented voltage leads. Bold line shows the main exploring electrode connection
while dotted lines show reference electrode connection which is the main output from the other two electrodes
Deep Analysis Section (DAS)
5
Precordial or Chest Leads
Precordial leads placed directly on chest because of close proximity to the heart they do not require augmentation. Wilson’s central terminal is used for the negative terminal and these leads consider being unipolar. They
record heart’s electrical activity in horizontal plane.
Chest (precordcial) leads
+ve pole
–ve pole
V1 = 4th Intercostal space, right sternal border
V2 = 4th Intercostal space, left sternal border
V3 = Between leads V2 and V4
V4 = 5th intercostal space, left midclavicular line
V5 = 5th intercostal space, anterior axillary line
V6 = 5th intercostal space, midaxillary line
V7 = Posterior axillary line
V8 = Posterior scapular line
Wilson central terminal
How Chest (Precordial) Leads Attach?
There are usually 6 chest leads and their positions are:
V1 = 4th Intercostal space, right sternal border
V2 = 4th Intercostal space, left sternal border
V3 = between leads V2 and V4
V4 = 5th Intercostal space, left midclavicular line
V5 = 5th Intercostal space, anterior axillary line
V6 = 5th Intercostal space, midaxillary line
Sometime, for better vision of posterior infarction, these leads are added
V7 = Posterior axillary line
V8 = Posterior scapular line
Similarly, for right ventricular infarction, it is advisable to take right sided chest leads (Fig. 1.5).
V4R = Right sided 5th intercostal space.
V3R = Right sided intercostal space between leads V2 and V4.
(Note: Chest leads should be placed carefully as small variation can cause different and misleading
ECG recording)
6
Master Visual Diagnosis of ECG: A Short Atlas
Midclavicular line
Angle of
Louis
Anterior
axillary line
Posterior
axillary line
Posterior
axillary line
Figure 1.5: Arrangement of chest leads
Each Lead Looks Heart Differently
Standard Limb Lead
You may be confused by so many leads but each lead focuses at different angle and their viewing can be
understood just by imagining the heart anatomical position and leads position (Fig. 1.6).
Lead I, aVL........................ looks left lateral surface of heart.
Leads II, III, and aVF …....looks inferior surface of heart.
Lead aVR ............................Looks right ventricle.
Deep Analysis Section (DAS)
7
AVR
AVL
I
III
II
AVF
Figure 1.6: Note how different limb leads look different parts of heart and result in different morphology of QRS complex
Good to Remember
1. Lead AVR is inverted in normal conditions (Fig. 1.6).
2. Lead II and AVF are most informative while lead III is the least.
Chest Leads
As you can easily imagine chest leads view in horizontal fashion in anterior-posterior plane. Imagine heart in
anatomical position within the chest cavity (Fig. 1.7).
It should be remembered that if heart is deviated from its normal position to acquire more horizontal or
vertical position, the normal ECG pattern may vary without any underlying disease.
Note that limb leads look heart in the frontal plane; while chest leads see heart in horizontal plane.
8
Master Visual Diagnosis of ECG: A Short Atlas
Posterior
Anterior and
lateral wall of
left ventricle
V6
V6
V5
V1
V1
V3
V2
V4
V5
Anterior
Right ventricle
Septum and anterior wall
of left ventricle
V2
V3
V4
Figure 1.7: Note how chest leads look different parts of the heart and record QRS complex of different morphology
Get Familiar with ECG Strip
It is extremely necessary to know some basic details of ECG strips. These are:
1. The ECG graph paper consists of small and large squares. The length shows voltage and width shows time
(in other words, X-axis is time in seconds or milliseconds and Y-axis is voltage in volts or millvolts). The
length and width of small box is 1 mm.
2. One small square equals to 0.04sec. (When the speed of strip is 25 mm/sec.)
And its length equals to 0.1 millvolts. Therefore, a large square consisting of 5 small squares equals to
0.2 seconds and 0.5 mV. And for the 1 second recording we need 5 large squares (5 large square = 1
second)
Six seconds recordings multiplied by 10 give us one minute recordings (See Quick Diagnoses section).
One minute record is needed when calculates irregular rates (Fig. 1.8).
Deep Analysis Section (DAS)
9
5 Large box = 1 second
1 Large box = 0.2 second
Voltage
amplitude
2 Large box = 1 mV
1 Large box = 0.5 mV
0
1.0
2.0
1 Small box = 0.1 mV
(1 mm)
Time
1 Small box = 0.04 seconds
or 40 miliseconds
(1 mm)
Figure 1.8: ECG paper, interpretation of large and small boxes (Speed of paper = 25 mm/sec)
HOW TO TAKE ECG RECORDING?
ECG leads set up with 6 chest leads, usually with suction grip and the limb leads are clip like. For correct
recording:
• Leads must be applied to correct limbs. The colors of the leads usually are a good guide for correct position (Fig. 1.9).
RA = Right arm
LA = Left arm
RL = Right leg
LL = Left leg
RA
RA
LA
LA
RL
RL
LL
RA =
LA =
RL =
LL =
LL
White
Black
Green
Red
Figure 1.9: Note the limb leads and chest leads have different marks which help for correct diagnosis
10
Master Visual Diagnosis of ECG: A Short Atlas
Also remember that:
• For limb fleshy area better to provide more contact (little above ankles)
• In female, lower border of breast usually lies on 5th interspace.
• Thick hairy chest may be shaved (only required parts).
• For better grip gel may be used (simple normal saline can do, also)
• Make sure calibration with 1 mV.
• Patient should lie down, shouldn’t move and relax in order to prevent artifacts.
• Three or four complexes are enough from each leads.
WHAT CONCEPT YOU NEED TO KNOW TO GET FAMILIAR WITH PQRS COMPLEX?
Detailed generation process of QRS complex and vector physiology can be found in textbooks of physiology and cardiology. However, it is wise to always remember
these facts:
1. Current flow in this direction: SA node → AV node →
Bundle of His → Left bundle branch (which again divides
into anterior fascicular branch and posterior fascicular
branch as left ventricle muscle mass is much more than
right ventricle) → Purkinje fibers.
2. The current (generated by action potential) when travels
toward the positive lead or electrode it causes upward
positive deflection in QRS complex.
3. When current going away from positive electrode, it causes
negative or downward QRS deflection in QRS complex.
4. Sometimes, QRS complex is isoelectric, i.e. equally or
almost equal in positive and negative direction. Here the
wave of current is at right angle to this lead, i.e. Perpendicular to it (Fig. 1.10).
What is Axis?
This will be dealt while discussing Bundle Branch Block later
in this book in detail.
Figure 1.10: Note the direction of current with respect to electrode determines positive or negative
polarity of QRS complex
Deep Analysis Section (DAS)
11
The PQRS Complex
Einthoven who discovered ECG formation labeled this as PQRS. It should be, however, noted that if the deflection is small, use of lower case is also common, i.e. instead of R for small R wave use r (qrs- vice versa).
Note: QRS complex coincides with electrical and mechanical activity of heart. In fact, P wave, QRS
complex and T wave coincides with different phases of action potential, as described in following text (Fig.
1.11).
ST
PR
T
J point
P
QRS
1
2
Vulnerable
period
3
0
4
Figure 1.11: Note relationship of cardiac action potential and QRS complex of ECG. Different periods of QRS complex
coincide with different phases of action potential
Characteristics of Normal P Wave
•
•
•
•
Width less than 3 small squares (0.12 second) and height <2.5 mm.
Represent atrial depolarization. Initial portion represents right atrium and last portion indicates left atrium
activity.
Normal P wave should be upward in leads I, II and inverted in lead aVR. This is called as sinus P wave.
Presence of sinus P wave means impulse generating from SA node and rhythm is regarded as sinus rhythm.
It indicates that impulse is generating from sinus node. P wave after the QRS complex (retrograde P wave)
or inverted P wave indicates its origin from sources other than sinus node and it is called as ectopic P wave.
Best seen in leads II and V1.