Automatic identification of Vietnamese dialects
Bạn đang xem bản rút gọn của tài liệu. Xem và tải ngay bản đầy đủ của tài liệu tại đây (422.86 KB, 12 trang )
Journal of Computer Science and Cybernetics, V.32, N.1 (2016), 18–29
DOI: 10.15625/1813-9663/32/1/7905
AUTOMATIC IDENTIFICATION OF VIETNAMESE DIALECTS
PHAM NGOC HUNG1,2 , TRINH VAN LOAN1,2 , NGUYEN HONG QUANG2
1 Faculty
of Information Technology, Hung Yen University of Technology and Education,
of Information and Communication Technology, Hanoi University of Science and
Technology
1,2 ; 1,2 ; 2
2 School
Abstract.
The dialect identification has been under study for many languages over the world
nevertheless the research on signal processing for Vietnamese dialects is still limited and there are not
many published works. There are many different dialects for Vietnamese. The influence of dialectal
features on speech recognition systems is important. If the information about dialects is known during
speech recognition process, the performance of recognition systems will be better because the corpus
of these systems is normally organized according to different dialects. In our experiments, MFCC
coefficients, formants, correspondent bandwidths and the fundamental frequency with its variants are
input parameters for GMM. The experiment result for the dialect corpus of Vietnamese shows that
the performance of dialectal identification with baseline increases from 58.6% for the case using only
MFCC coefficients to 70.8% for the case using MFCC coefficients and the information of fundamental
frequency. By combining the formants and their bandwidths with the normalized F 0 according to
average and standard deviation F 0, the best recognition rate is 72.2%.
Keywords. Fundamental frequency, MFCC, Formant, Bandwidth, GMM, Vietnamese dialects,
identification.
1.
INTRODUCTION
Vietnamese is a tonal language with many different dialects. It is the diversity of Vietnamese
dialects that remains a great challenge to the systems of Vietnamese recognition. In other
words, the pronunciation modality of the word is not the same from locality to locality. For
example, for two Vietnamese dialects, the sound may be heard as the same but the sense
is quite different depending on the dialect. This can reduce the performance of recognition systems if these systems have no information and training data of each dialect to be
recognized.
For many languages in the world such as English [1], Chinese [2], Thai [3], Hindi [4]. . . there
are already studies on the dialect identification. For Vietnamese, the studies on dialects have
been carried out for a long time ago but mainly on the linguistic approach and were still
limited on the signal processing approach. Therefore, the research and the solution for Vietnamese dialect identification are quite necessary to improve the performance of Vietnamese
recognition systems.
This paper presents the research results on Vietnamese dialectal identification based on
GMM (Gaussian Mixture Model) using MFCC (Mel-frequency Cepstral Coefficients) and
c 2015 Vietnam Academy of Science & Technology
AUTOMATIC IDENTIFICATION OF VIETNAMESE DIALECTS
19
tonal features through the variation of fundamental frequency. The identification experiments were performed with the corpus VDSPEC (Vietnamese Dialect Speech Corpus) built
for the research on Vietnamese dialects. VDSPEC consists of 150 speakers with the duration
of 45.12 hours. Section 2 of the paper describes the overview of Vietnamese dialects. GMM
model, MFCC, formants and fundamental frequency F0 used in this model are presented in
section 3. The experiments and identification results are given in section 4. Finally, section
5 is conclusions and development orientations.
2.
AN OVERVIEW OF THE VIETNAMESE DIALECTS
It is known that a dialect is a form of the language spoken in different regions of the country. These dialects may have distinctions of words, grammar, and pronunciation modalities.
Vietnamese is the language that has many dialects.
The division of the Vietnamese dialects has been done by Vietnamese linguists with some
different opinions. Nevertheless, the majority of linguists think that Vietnamese can be divided into three main dialects: northern dialect corresponding to Tonkin, central dialect
corresponding to areas from Thanh Hoa province to Hai Van pass, southern dialect corresponding to areas from Hai Van pass to southern provinces [5]. In any case, this division is
only relative because the geographical boundaries to divide the dialects are not completely
clear. In fact, for the same regions, dialect can vary from a village to another. For three
principal dialects above, in addition to the significant differences in vocabulary, it makes
the listener easily perceive, distinguish between the dialects that is pronunciation modality.
Phonetics of three main dialects differs significantly. For Vietnamese tone system, northern dialect has full six tones including level tone (“thanh ngang”), low-falling tone (“thanh
`en”), asking tone (“thanh ho’ i ”), rising tone (“thanh s˘
huyˆ
a´c”), broken tone (“thanh ng˜
a ”)
and heavy tone (“thanh n˘
a.ng”), while central dialect has only five tones. For Thanh Hoa,
Quang Binh, Quang Tri, Thua Thien voices and southern voice in general, there is no distinction between asking tone and broken tone. For Nghe An and Ha Tinh voices, broken
tone and heavy tone are the same. In terms of prosody, three main dialects are entirely
different.
The number of different Vietnamese dialects is very big. Traditionally, Vietnam is divided
geographically into three regions: North, Centre and South. The dialects for these three
regions are also different both local vocabularies and pronunciation modalities. That is why
we have chosen three representative dialects for these regions.
In our research, it is the difference between pronunciation modalities and but not local
vocabulary that is exploited to identify three main dialects.
3.
GMM WITH MFCC, FORMANTS AND F0
Multivariate Gaussian Mixture Model has been used for speaker recognition [6], English
dialect recognition [7], Chinese dialect recognition [8] and language identification [9, 10].
Supper vectors [11] are also used in research on dialect identification with positive results.
To explain why GMM often used in speaker recognition, language, and dialect identification...
one can deduce as follows. Even in the cases where content cannot be understood clearly,
people still have the ability to sense voice, language or dialect that they have known already.
20
PHAM NGOC HUNG, TRINH VAN LOAN, NGUYEN HONG QUANG
In that case, general information or information envelope on phonetics has helped people
recognize the voice, language and dialect without the need for more information in detail
about the content that the speaker transmits. By taking a large enough number of Gaussian
distribution components, adjusted average and variance of them as well as weights in a linear
combination, GMM can approximate most continuous distribution density with optional
precision. Therefore, GMM allows modeling only the basic distribution of the speaker’s
phonetic or the perception of phonetic information envelope mentioned above. The average
while determining GMM model can eliminate the factors that affect the acoustic features
like phonetic variation over time of different speakers and retain only what is an essential
characteristic of the voice of a region such as in the case of dialect identification.
A multivariate Gaussian mixture model is a weighted sum of M Gaussian density components as the following formulas:
M
p ( X| λ) =
πi gi ( X| µi , Σi ) ,
(1)
i=1
where X is a data vector containing the parameters of object which needs to be represented,
π i , i =1, ..., M, is mixture weight, gi (X|µi , Σi ) is a component Gaussian density function
as the formulas (2) with average vector µi of D dimension vector and D × D dimension
covariance matrix Σi :
gi (X|µi , Σi ) =
1
1
exp − (X − µi ) Σ−1
i (X − µi ) .
2
(2π) |Σi |
D
2
1
2
(2)
The mixture weights must meet the condition ΣM
i=1 πi = 1.
A full GMM is parameterized by average vectors, covariance matrix and mixture weights
of all Gaussian components. These parameters can be represented in a shortened form (3)
λ = {πi , µi , Σi } , i = 1, 2, . . . , M.
(3)
To identify dialects, each dialect is represented by a GMM and is referenced to the model
λ of this model. In the case where MFCC are used as feature vectors, the spectral envelope
of the ith acoustic class is represented by average µi of the ith component and the variation
of spectral envelope is represented by covariance matrix Σi .
Assuming T is the number of feature vectors (T is also the number of speech frames), M
is the number of Gaussian components
X = {x1 , x2 , . . . , xT } .
(4)
GMM likelihood is
T
p(xt |λ).
p (X|λ) =
(5)
t=1
The expression (5) is a nonlinear function for λ so it cannot be maximized directly and the
maximized likelihood parameters can be received using the EM (expectation - maximization)
algorithm.
AUTOMATIC IDENTIFICATION OF VIETNAMESE DIALECTS
21
The idea of this algorithm is that beginning with the initial model λ, to estimate a new
¯ so that:
model λ
¯ ≥ p (X|λ) .
p X|λ
(6)
This new model is an initial model for the next iteration and the process is repeated
until the convergence threshold is achieved. In fact, expectation maximization algorithm
attempts to find the λ that maximizes the log probability log p(X|λ) of the data X .
In a study published in [12], GMM is used only with the parameters MFCC. The computation of theses parameters is described in Figure 1.
In Figure 1, speech signal is framed with frame length 0.01 s and frame shift 0.005 s. The
emphasis filter has input-output relationship:
y (n) = x (n) − 0.96x(n − 1).
(7)
Then speech signal is passed through Hamming window with window length N
w (n) = 0.54 − 0.46cos(2πn/(N − 1)) with 0 ≤ n ≤ N − 1.
(8)
Figure 1. Computation of MFCC parameters
FFT (Fast Fourier Transform) is applied for windowed signal and the signal spectrum
goes through Mel scale triangle filter bank. MFCC are received after DCT (Discrete Cosine
Transform).
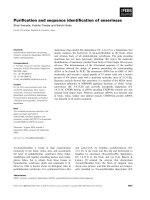
Besides MFCC, the formants and corresponding bandwidths are also used as input features for GMM.
Next, the paper presents dialect identification method based on GMM with the combination of MFCC, formants, F 0 and its variants. The experiments are carried out using open
source tools ALIZE [6]. The F 0 values of each frame are added at the end of feature vectors.
4.
4.1.
EXPERIMENT RESULTS
Speech data for experiment
The speech corpus VDSPEC is used for the experiments. Speech is recorded by reading the
text organized according to 6 topics with tonal balance (The number of words is equal for
each tone and equals 717 on average).
22
PHAM NGOC HUNG, TRINH VAN LOAN, NGUYEN HONG QUANG
The sampling frequency is 16000 Hz and 16 bits per sample. The speaker’s average age is
21. At this age, voice quality is steady with full features for the local voice. Each dialect has
50 speakers including 25 men and 25 women. Hanoi voice is chosen for northern dialect, Hue
voice for central dialect and Ho Chi Minh City voice for southern dialect. For each topic,
the speaker reads 25 sentences and a sentence’s length is about 10 seconds. The recording
duration is 45.12 hours with the volume 4.84 GB. Some information of VDSPEC is given in
the Tables 1 and 2.
Table 1. Statistics according to the dialects of VDSPEC
Dialect
Northern
Central
Southern
Total
No. Sentences
6250
6250
6250
18750
Duration (h)
14.41
14.65
16.06
45.12
Table 2. Statistics according to the topics of VDSPEC
Topic
Life
Science
Business
Car-motorbike
Law
Total
No. Sentences
3750
3750
3750
3750
3750
18750
No. Syllables
855
893
729
652
855
3984
Duration (h)
9.96
8.03
10.06
7.31
9.76
45.12
For experiments, the above corpus is divided into five parts. With each dialect, 10
speakers (5 male voices and 5 female voices) were used for testing, 40 speakers (20 male
voices and 20 female voices) for training. All of the test experiments are performed using
cross-validation.
4.2.
Selection of the number of coefficients MFCC
To find out the best number of coefficients MFCC used for dialect identification regardless of
gender, the number of coefficients MFCC is varied from 5 to 19. The experiments are carried
out for each dialect then the average value is taken. The Gaussian component number M
is 20 for this experiment and the following experiments take this value as the baseline. The
next experiment in 4.5 will take the different values of the Gaussian component number for
the examination of its impact on performance All of the tests in our experiments are speaker
independent.
Figure 2 shows that the maximal average value for the number of coefficients MFCC is 10
with score 8. In this case, the score is the highest likelihood for each dialect. However, with
this value there is a great disparity in the scores of dialect identification for three dialects.
Two additional values of the number of coefficients MFCC can be selected. The first value
is 13. Three curves intersect in this value. The scores at these values are not highest but
AUTOMATIC IDENTIFICATION OF VIETNAMESE DIALECTS
23
are equal. The second value is 11. For this value, the average score is higher in comparison
with the value 13 except for central dialect and the score of this dialect is a little bit lower.
Finally, two values 11 and 13 are chosen for the next experiments.
Figure 2. Experiments for selecting the number of MFCC. ND: Northern Dialect,
CD: Central Dialect, SD: Southern Dialect
4.3.
Combination of MFCC coefficients and F 0 parameters
In [13], the different variation of F 0 for three dialects have been evaluated. Generally
speaking, the direction and the range of F 0 variation for Hue tones tend to be opposed to
Hanoi tones. Unless broken tone, the trend of F 0 variations for Ho Chi Minh City voices is
rather close to Hanoi voices. The F 0 variations of broken tone for Ho Chi Minh City voices
tend to go up like the asking tone of Hanoi voices. These distinctions can be used as the
important features for identifying the dialects.
For this case, MFCC coefficients are combined with fundamental frequency F 0, logF 0(t)
and normalized values of F 0 and logF 0(t). Beside F 0 value, some quantities derived from
F 0 are calculated as follows
The derivative F 0 (dif f F 0(t)):
dif f F 0(t) = dF 0(t)/dt.
(9)
The trend upward or downward of F 0 for each sentence (cdF 0(t)):
−1
0
cdF 0(t) =
1
if ((F 0i − F 0i−1 ) ≤ −3)
if (−3 < (F 0i − F 0i−1 ) < 3)
if ((F 0i − F 0i−1 ) ≥ 3)
(10)
24
PHAM NGOC HUNG, TRINH VAN LOAN, NGUYEN HONG QUANG
The normalized F 0 according to average F 0 for each sentence (F 0sbM (t)):
F 0sbM (t) = F0 (t)/F0 (t).
(11)
The normalized F 0 according to average and standard deviation F 0 (F 0sbM SD(t)):
F0 (t) − F0 (t)
.
σF0 (t)
(12)
dif f LogF 0 (t) = dLogF 0(t)/dt.
(13)
F 0sbM SD (t) =
The derivative log F 0(t) (dif f LogF 0(t)):
The normalized log F 0(t) according to min log F 0(t) and max log F 0(t) for each sentence
(logF 0sbM M (t)):
logF 0sbM M (t) =
LogF0 (t) − min LogF0 (t)
.
maxLogF0 (t) − minLogF0 (t)
(14)
The normalized log F 0(t) according to average log F 0(t) for each sentence (logF 0sbM (t)):
logF 0sbM (t) = logF0 (t)/logF0 (t).
(15)
The normalized log F 0 according to average and standard deviation log F 0(t) (logF 0M SD(t)):
logF 0M SD (t) =
logF0 (t) − logF0 (t)
.
σlogF0 (t)
Table 3. Recognition results using MFCC = 11, MFCC=13 and F 0 parameters
Index
MFCC
+ F 0 Parameters
1
2
3
4
5
6
7
8
9
10
11
12
MFCC
F0
dif f F 0(t)
cdF 0(t)
F 0sbM M (t)
F 0sbM (t)
F 0sbM SD(t)
LogF 0(t)
dif f LogF 0(t)
LogF 0sbM M (t)
LogF 0sbM (t)
LogF 0sbM SD(t)
Recognition
Rate
(MFCC=11)
59.6%
65.1%
62.9%
60.6%
61.4%
69.5%
62.9%
68.6%
59.5%
61.0%
69.7%
59.5%
Recognition
Rate
(MFCC=13)
58.6%
64.4%
61.9%
58.1%
60.9%
70.8%
61.9%
68.4%
57.3%
60.2%
68.8%
57.3%
(16)
AUTOMATIC IDENTIFICATION OF VIETNAMESE DIALECTS
25
Praat 1 was used to estimate fundamental frequency variations for Vietnamese tones in
VDSPEC. In Table 3, the second column (Parameters) shows the parameters that were used
in the model. For the first row, the only MFCC coefficients are used. With 11 coefficients
of MFCC, the highest recognition rate is 69.5% for the case (6) and 69.7% for the case (11).
This shows that the recognition performance is better if the F0 information is added (The
score increases approximately 10%).
In the last column of Table 3 where MFCC = 13, without F 0 parameters, the recognition rate is only 58.6%. The highest recognition rate is 70.8% for the case where MFCC
are combined with F 0sbM . This is also consistent with the case MFCC = 11. With the
combination of MFCC and F 0, the recognition rates are improved significantly (up 12.2%)
in comparison with the case without F 0 information.
The confusion matrix without gender distinction with the combination of MFCC and
F0 is given in Table 4. In general, Table 4 shows that central dialect tends to reach more
northern dialect, and southern dialect tends to reach more central dialect. This is consistent
with the fact that northern and central dialects have many similarities and the pronunciation
modality is almost the same in most of the tones. The more geographical distance is far, the
more distinct levels of dialects are great.
Table 4. Confusion matrix without gender distinction with the combination of MFCC and
F 0; a) MFCC=11; b) MFCC=13
4.4.
Combination of formants, corresponding bandwidths and F 0 parameters
Normally, formant frequencies and bandwidths are vocal tract parameters. The formants
are frequencies of vocal tract resonances. The first two formants are the most important
because they decide the speech quality [14]. Formants and their bandwidths have been
used for a lot of research on speech processing such as accent identification [15–17], speech
recognition [18], speaker identification [19], study on genders and ethnical accents [20–22],
dialect identification [4, 23–25].
In our experiments, the values of the first four formants and their bandwidths are calculated using Praat. These values are combined with F 0 and its variants. The experiments are
performed using the baseline of Gaussian component number. The dialectal identification
results with different combinations of these parameters are presented in Table 5. The highest
recognition rate is obtained for the case 7. This recognition rate is higher than the one of
the best case using MFCC + F 0sbM (t).
1
www.praat.org
26
PHAM NGOC HUNG, TRINH VAN LOAN, NGUYEN HONG QUANG
Table 5. Recognition results using formants, corresponding bandwidths and F 0 parameters
Index
1
2
3
4
5
6
7
8
9
10
11
12
4.5.
Formants+Bandwidths
+ F 0 Parameters
Formants+Bandwidths
F0
dif f F 0(t)
cdF 0(t)
F 0sbM M (t)
F 0sbM (t)
F 0sbM SD(t)
LogF 0(t)
dif f LogF 0(t)
LogF 0sbM M (t)
LogF 0sbM (t)
LogF 0sbM SD(t)
Recognition
Rate
66.3%
67.5%
65.2%
67.0%
67.8%
64.3%
72.2%
71.6%
66.8%
67.7%
68.7%
66.8%
Effect of Gaussian component number on dialect recognition performance
For this experiment, 13 MFCC coefficients + F 0sbM (t) are chosen and the Gaussian component number M is taken from 20 (baseline) to 4096. GMM was trained and evaluated with
this range of components. The DET (Detection Error Tradeoff) curves for different values
of Gaussian component number are depicted in Figure 3.
From Figure 3, generally, the increase in M increases the dialect recognition performance
as we can also see in Table 6.
Table 6. Average recognition rate with different values of Gaussian component number
Gaussian component number
20
32
64
128
256
512
1024
2048
4096
Recognition rate
70.8%
72.1%
71.5%
74.0%
73.2%
73.9%
74.9%
75.1%
74.6%
The maximum recognition rate is 75.1% when M equals 2048. In Figure 3, the points
indicated by o ’s are weighted averages of the missed detection and false alarm rates or the
minimum values of the Detection Cost Function (DCF ). These values are calculated as the
following [26]:
DCF = Cmiss .Pmiss .Ptrue + Cf a .Pf a .Pf alse ,
(17)
AUTOMATIC IDENTIFICATION OF VIETNAMESE DIALECTS
27
where Cmiss is the cost of a miss (rejection), Cf a is the cost of an alarm (acceptance), Ptrue is
the a priori probability of the target, Pf a is the false alarm probability and Pf alse =1−Ptrue .
Cmiss = Cf a =1. The minimum value of the DCF for M =2048 corresponds to the point
which is closest to the origin.
Figure 3. DET curves with Gaussian component number from 20 to 4096
5.
CONCLUSIONS
Vietnamese is a tonal language and the dialects of Vietnamese are very rich in terms of
phonetics and local vocabulary. In fact, based on the difference of pronunciation modality
especially for F0 variation, one can discriminate three principal Vietnamese dialects such as
northern, central and southern dialects. Therefore, by the combination of MFCC and F 0
parameters for GMM model, the recognition rate of these Vietnamese dialects is improved
significantly. The experiments show that to get the best score in order to receive the appropriate GMM model for dialect identification, the number of MFCC coefficients should be
13. Combining the first four formants, their bandwidths, and variants of the fundamental
28
PHAM NGOC HUNG, TRINH VAN LOAN, NGUYEN HONG QUANG
frequency, the recognition rate is generally higher than the case using MFCC and variants of
the fundamental frequency. These research results can continue to develop for its application
in the automatic recognition systems to enhance Vietnamese recognition performance.
REFERENCES
[1] B. Kortmann, A comparative grammar of British English dialects: agreement, gender, relative
clauses. Walter de Gruyter, 2005, vol. 1.
[2] J. Li, T. F. Zheng, W. Byrne, and D. Jurafsky, “A dialectal chinese speech recognition framework,” Journal of Computer Science and Technology, vol. 21, no. 1, pp. 106–115, 2006.
[3] S. Aunkaew, M. Karnjanadecha, and C. Wutiwiwatchai, “Development of a corpus for southern thai dialect speech recognition: Design and text preparation,” in Symposium on Natural
Language Processing (SNLP 2013), Phuket Thailand, 2013.
[4] S. Sinha, A. Jain, and S. S. Agrawal, “Acoustic-phonetic feature based dialect identification in
hindi speech.” International Journal on Smart Sensing & Intelligent Systems, vol. 8, no. 1, 2015.
[5] H. T. Chau, “Vietnamese dialects,” 2009.
[6] J.-F. Bonastre, F. Wils, and S. Meignier, “Alize, a free toolkit for speaker recognition.” in
ICASSP (1), 2005, pp. 737–740.
[7] P. A. Torres-Carrasquillo, T. P. Gleason, and D. A. Reynolds, “Dialect identification using
gaussian mixture models,” in ODYSSEY04-The Speaker and Language Recognition Workshop,
2004, pp. 297–300.
[8] B. Ma, D. Zhu, and R. Tong, “Chinese dialect identification using tone features based on pitch
flux,” in 2006 IEEE International Conference on Acoustics Speech and Signal Processing Proceedings, vol. 1. IEEE, 2006, pp. I–I.
[9] W. M. Campbell, E. Singer, P. A. Torres-Carrasquillo, and D. A. Reynolds, “Language recognition with support vector machines,” in ODYSSEY04-The Speaker and Language Recognition
Workshop, 2004, pp. 41–44.
[10] P. A. Torres-Carrasquillo, E. Singer, M. A. Kohler, R. J. Greene, D. A. Reynolds, and J. R.
Deller Jr, “Approaches to language identification using gaussian mixture models and shifted
delta cepstral features.” in INTERSPEECH, 2002, pp. 32–36, 82–92.
[11] F. Biadsy, J. Hirschberg, and D. P. Ellis, “Dialect and accent recognition using phoneticsegmentation supervectors.” in INTERSPEECH, 2011, pp. 745–748.
[12] P. N. Hung, T. V. Loan, N. H. Quang, and P. Q. Hung, “Identification of vietnamese dialects
using gmm,” in Proceedings of the 6th National Conference on Fundamental and Applied Information Technology Research (FAIR6), vol. 1. ISBN 978-604-913-165-3, 2014, pp. 449–452.
[13] P. N. Hung, T. V. Loan, and N. H. Quang, “Corpus and statistical analysis of f0 variation
for vietnamese dialect identification,” in The 3rd International Conference on Computer and
Computing Science Proceedings, Hanoi, Vietnam (COMCOMS 2015), vol. 111. ISSN: 22871233 ASTL, 2015, pp. 205–210.
[14] R. Carlson, G. Fant, and B. Granstr¨om, “Two-formant models, pitch, and vowel perception,”
Acta Acustica united with Acustica, vol. 31, no. 6, pp. 360–362, 1974.
AUTOMATIC IDENTIFICATION OF VIETNAMESE DIALECTS
29
[15] D. Stantic and J. Jo, “Accent identification by clustering and scoring formants,” World Academy
of Science, Engineering and Technology, vol. 6, no. 3, pp. 379–384, 2012.
[16] A. Hanani, M. J. Russell, and M. J. Carey, “Human and computer recognition of regional accents
and ethnic groups from british english speech,” Computer Speech & Language, vol. 27, no. 1, pp.
59–74, 2013.
[17] K. Mannepalli, P. N. Sastry, and V. Rajesh, “Accent detection of telugu speech using
prosodic and formant features,” in Signal Processing And Communication Engineering Systems
(SPACES), 2015 International Conference on. IEEE, 2015, pp. 318–322.
[18] P. N. Garner and W. J. Holmes, “On the robust incorporation of formant features into hidden
markov models for automatic speech recognition,” in Acoustics, Speech and Signal Processing,
1998. Proceedings of the 1998 IEEE International Conference on, vol. 1. IEEE, 1998, pp. 1–4.
[19] T. Becker, M. Jessen, and C. Grigoras, “Forensic speaker verification using formant features and
gaussian mixture models.” in Interspeech, 2008, pp. 1505–1508.
[20] M. Yusnita, M. Paulraj, S. Yaacob, M. N. Fadzilah, and A. Shahriman, “Acoustic analysis
of formants across genders and ethnical accents in malaysian english using anova,” Procedia
Engineering, vol. 64, pp. 385–394, 2013.
[21] M. P. Gelfer and V. A. Mikos, “The relative contributions of speaking fundamental frequency
and formant frequencies to gender identification based on isolated vowels,” Journal of Voice,
vol. 19, no. 4, pp. 544–554, 2005.
[22] J. M. Hillenbrand and M. J. Clark, “The role of f 0 and formant frequencies in distinguishing
the voices of men and women,” Attention, Perception, & Psychophysics, vol. 71, no. 5, pp.
1150–1166, 2009.
[23] R. Hagiwara, “Dialect variation and formant frequency: The american english vowels revisited,”
The Journal of the Acoustical Society of America, vol. 102, no. 1, pp. 655–658, 1997.
[24] E. Jacewicz and R. A. Fox, “The effects of dialect variation on speech intelligibility in a multitalker background,” Applied Psycholinguistics, vol. 36, no. 03, pp. 729–746, 2015.
[25] R. A. Fox and E. Jacewicz, “Cross-dialectal variation in formant dynamics of american english
vowels,” The Journal of the Acoustical Society of America, vol. 126, no. 5, pp. 2603–2618, 2009.
[26] A. Martin, G. Doddington, T. Kamm, M. Ordowski, and M. Przybocki, “The det curve in
assessment of detection task performance,” DTIC Document, Tech. Rep., 1997.
Received on March 17 - 2016
Revised on July 13 - 2016