Robust watershed segmentation of noisy image using wavelet
Bạn đang xem bản rút gọn của tài liệu. Xem và tải ngay bản đầy đủ của tài liệu tại đây (1.07 MB, 6 trang )
ISSN:2249-5789
Nilanjan Dey et al, International Journal of Computer Science & Communication Networks,Vol 1(2), 117-122
Robust Watershed Segmentation of Noisy Image Using Wavelet
Nilanjan Dey1, Arpan Sinha2, Pranati Rakshit3
1
Asst. Professor Dept. of IT, JIS College of Engineering, Kalyani, West Bengal, India.
M Tech Scholar, Dept. of CSE, JIS College of Engineering, Kalyani, West Bengal, India.
3
HOD Dept. of CSE, JIS College of Engineering, Kalyani, West Bengal, India.
2
Abstract
Segmentation of adjoining objects in a noisy image is a
challenging task in image processing. Natural images
often get corrupted by noise during acquisition and
transmission. Segmentation of these noisy images does
not provide desired results, hence de-noising is
required. In this paper, we tried to address a very
effective technique called Wavelet thresholding for denoising, as it can arrest the energy of a signal in few
energy transform values, followed by Marker
controlled Watershed Segmentation.
advantage of multi-resolution and multi-scale gradient
algorithms.One of the most conventional ways of
image de-noising is using filters. Wavelet thresholding
approach gives a very good result for the same.
Wavelet Transformation has its own excellent spacefrequency localization property and thresholding
removes coefficients that are inconsiderably relative to
some threshold. This paper is organized as follows-
Keywords— Wavelet, de-noising, Marker controlled
Watershed Segmentation, Soft thresholding
Section 2 describes Discrete wavelet transformation,
Section 3 describes wavelet thresholding, Section 4
describes Wavelet based de-noising [1,2], Section 5
1. Introduction
describes Marker controlled Watershed Segmentation,
Image Segmentation is a technique to distinguish
Section
6
describes
experimental
objects from its background and altering the image to a
discussions, Section 7 Conclusion.
results
and
much distinctive meaning and promoting easy analysis.
One of the popular approaches is the region based
2.
Discrete Wavelet Transformation
techniques, which partitions connected regions by
The wavelet transform describes a multi-resolution
grouping neighbouring pixels of similar intensity
decomposition process in terms of expansion of an
levels. On the basis of homogeneity or sharpness of
image onto a set of wavelet basis functions. Discrete
region boundaries, adjoining regions are merged. Over-
Wavelet Transformation has its own excellent space
stringent criteria create fragmentation; lenient ones
frequency localization property. Applying DWT in 2D
ignore blurred boundaries and overlap.
images corresponds to 2D filter image processing in
Marker-based watershed transform is based on the
each dimension. The input image is divided into 4 non-
region based algorithms for segmentation by taking the
overlapping multi-resolution sub-bands by the filters,
namely
October-November 2011
LL1
(Approximation
coefficients),
LH1
117
ISSN:2249-5789
Nilanjan Dey et al, International Journal of Computer Science & Communication Networks,Vol 1(2), 117-122
(vertical details), HL1 (horizontal details) and HH1
The technique can be summarized in three steps
(diagonal details). The sub-band (LL1) is processed
Y = W(X)
..... (2)
further to obtain the next coarser scale of wavelet
Z = D(Y, λ)
..... (3)
coefficients, until some final scale “N” is reached.
Ŝ = W (Z)
..... (4)
When “N” is reached, we’ll have 3N+1 sub-bands
consisting of the multi-resolution sub-bands (LLN) and
(LHX), (HLX) and (HHX) where “X” ranges from 1
until “N”. Generally most of the Image energy is stored
-1
D (., λ) being the thresholding operator and λ being the
threshold.
A signal estimation technique that exploits the potential
of wavelet transform required for signal de-noising is
in these sub-bands.
called Wavelet Thresholding[3]. It de-noises by
eradicating coefficients that are extraneous relative to
some threshold.
There are two types of recurrently used thresholding
methods, namely hard and soft thresholding [4, 5].
The Hard thresholding method zeros the coefficients
that are smaller than the threshold and leaves the other
ones unchanged. On the other hand soft thresholding
Fig.1 Three phase decomposition using DWT.
scales the remaining coefficients in order to form a
The Haar wavelet is also the simplest possible wavelet.
continuous distribution of the coefficients centered on
Haar wavelet is not continuous, and therefore not
zero.
differentiable. This property can, however, be an
The hard thresholding operator is defined as
advantage for the analysis of signals with sudden
D (U, λ) = U for all |U|> λ
Hard threshold is a keep or kill procedure and is more
transitions.
intuitively appealing. The hard-thresholding function
3. Wavelet Thresholding
chooses all wavelet coefficients that are greater than
The concept of wavelet de-noising technique can be
the given λ (threshold) and sets the other to zero. λ is
given as follows. Assuming that the noisy data is given
chosen according to the signal energy and the noise
variance (σ2)
by the following equation,
D (U, λ,)
X (t) = S (t) + N (t)
..... (1)
Where, S (t) is the uncorrupted signal with additive
noise N (t). Let W (.) and W-1(.) denote the forward and
-T
T
U
inverse wavelet transform operators.
Let D (., λ) denote the de-noising operator with
threshold λ. We intend to de-noise X (t) to recover Ŝ (t)
as an estimate of S (t).
October-November 2011
Fig2. Hard Thresholding
The soft thresholding operator is defined as
118
ISSN:2249-5789
Nilanjan Dey et al, International Journal of Computer Science & Communication Networks,Vol 1(2), 117-122
D (U, λ) = sgn (U) max (0, |U| - λ)
Image analysis.Watershed Transform [8,9] draws its
Soft thresholding shrinks wavelets coefficients by λ
inspiration
from
the
geographical
concept
of
towards zero.
Watershed. A Watershed is the area of land where all
the water that is under it or drains off of it goes into the
same place. Simplifying the picture, a watershed can be
D (U, λ,)
assumed as a large bathtub. The bathtub defines the
-T
T
watershed boundary. On land, that boundary is
U
determined topographically by ridges, or high elevation
points.
The
watershed
transform
computes
the
catchment basins and ridgelines in a gradient image and
Fig3. Soft Thresholding
generates closed contours for each region in the
4. Wavelet based de-noising
original image.
Wavelet de-noising attempts to remove the noise
present in the signal, while preserving the signal
A potent and flexible method for segmentation of
characteristics regardless of its frequency content.
objects with closed contours, where the extremities are
Wavelet de-noising involves these three following
expressed
steps:
Watershed Segmentation. In Watershed Segmentation,
as
ridges
is
the
Marker-Controlled
A linear forward wavelet transform
the Marker Image used is a binary Image comprising of
Nonlinear thresholding step and
either single marker points or larger marker regions. In
A linear inverse wavelet transform
this, each connected marker is allocated inside an
Discrete wavelet transformation [6] decomposes the
object of interest. Every specific watershed region has a
noisy image into different coefficients namely LL
one-to-one relation with each initial marker; hence the
(Approximation coefficients), LH (vertical details), HL
final number of watershed regions determines the
(horizontal details) and HH (diagonal details). These
number of markers. Post Segmentation, each object is
coefficients are de-noised with wavelet threshold and
separated from its neighbours as the boundaries of the
finally inverse transformation is carried out among the
watershed regions are arranged on the desired ridges.
modified coefficients to get de-noised image.
The markers can be manually or automatically selected,
automatically generated
markers being generally
5. Marker Controlled Watershed
Segmentation
preferred.
Marker-Controlled Watershed Segmentation Watershed
6. Result and Discussions
transform
originally
proposed
by
Digabel
and
Lantuejoul is widely endorsed in image segmentation
[7]. Watershed transform can be classified as a regionbased image segmentation approach, results generated
by which can be taken as pre-processes for further
October-November 2011
Signal-to-noise ratio can be defined in a different
manner in image processing where the numerator is the
square of the peak value of the signal and the
denominator equals the noise variance. Two of the error
metrics used to compare the various image de-noising
119
ISSN:2249-5789
Nilanjan Dey et al, International Journal of Computer Science & Communication Networks,Vol 1(2), 117-122
techniques is the Mean Square Error (MSE) and the
Peak Signal to Noise Ratio (PSNR).
Mean Square Error (MSE):
Mean Square Error is the measurement of average of
(a)
(b)
the square of errors and is the cumulative squared error
between the noisy and the original image.
MSE =
(c)
Peak Signal to Noise Ratio (PSNR):
PSNR is a measure of the peak error. Peak Signal to
Noise Ratio is the ratio of the square of the peak value
(a)Original Image (b) Markers and object boundaries
superimposed on original image (c) Level RGB superimposed
transparently on original image
the signal could have to the noise variance.
Fig4. Segmentation of Original Image
PSNR = 20 * log10 (255 / sqrt (MSE))
A higher value of PSNR is good because of the
superiority of the signal to that of the noise.
MSE and PSNR values of an image are evaluated after
(d)
adding Gaussian and Speckle noise[10,11]. The
(e)
following tabulation shows the comparative study
based on Wavelet thresholding techniques[12] of
different decomposition levels.
Table 1
Noise
Type
Wavelet
Gaussian
Haar
Thresholding
Soft
Hard
Speckle
Haar
Soft
Hard
October-November 2011
Level
of
Decomposition
MSE
1
2
1
2
1
2
1
2
0.052
0.043
0.052
0.040
0.046
0.041
0.046
0.039
(f)
PSNR
(d)Noisy
35.59
35.77
35.61
36.19
35.97
36.13
36.01
36.254
Image
(e)
Markers
and
object
boundaries
superimposed on Noisy image (f) Level RGB superimposed
transparently on Noisy image
Fig5. Segmentation of noisy Image
120
ISSN:2249-5789
Nilanjan Dey et al, International Journal of Computer Science & Communication Networks,Vol 1(2), 117-122
7. Conclusion
Basically, the soft thresholding method is used to
analyze the methods of the de-noising system for
(g)
(h)
different levels of DWT decomposition because of its
better performance than other de-noising methods. This
paper shows that using soft threshold wavelet on the
region based Watershed Segmentation on noisy image
gives a very effective result.
(i)
(j)
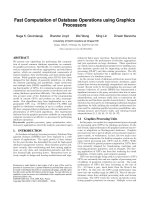
(g) Noisy image (Gaussian) (h) First level DWT decomposed
References
and soft threshold noisy image (i) Markers and object
boundaries superimposed on noisy image (j) Level RGB
superimposed transparently on noisy image
Fig 6. Segmentation of Noisy image using 1st level
DWT decomposition and Soft Thresholding
[1] J. N. Ellinas, T. Mandadelis, A. Tzortzis, L. Aslanoglou,
“Image de-noising using wavelets”, T.E.I. of Piraeus Applied
Research Review, vol. IX, no. 1, pp. 97-109, 2004.
[2] Lakhwinder Kaur and Savita Gupta and R.C.Chauhan,
“Image denoising using wavelet thresholding”, ICVGIP,
Proceeding of the Third Indian Conference On Computer
Vision, Graphics & Image Processing, Ahmdabad, India Dec.
16-18, 2002.
[3] Maarten Janse, ” Noise Reduction by Wavelet
Thresholding”, Volume 161, Springer Verlag, States United
of America, I edition, 2000.
[4] D. L. Donoho, “Denoising by soft-thresholding,” IEEE
Trans. Inf. Theory, vol. 41, no. 3, pp. 613–627, Mar. 1995.
(k)
[5] D.L. Donoho, De-Noising by Soft Thresholding, IEEE
Trans. Info. Theory 43, pp. 933-936, 1993.
(l)
[6] S.Kother Mohideen, Dr. S. Arumuga Perumal, Dr.
M.Mohamed Sathik. “Image De-noising using Discrete
Wavelet transform”, IJCSNS International Journal of
Computer Science and Network Security, vol .8, no.1,
January 2008.
(m)
(n)
[7] Bhandarkar, S.M., Hui, Z., 1999. Image segmentation
using evolutionary computation. IEEE Trans. Evolut.
Comput. 3 (1), 1–21.
(k) Noisy image (Gaussian) (l) 2nd level DWT decomposed
and soft threshold noisy image (m) Markers and object
boundaries superimposed on noisy image (n) Level RGB
superimposed transparently on noisy image
Fig 7. Segmentation of Noisy image using 2nd level
[8] D. Wang, “A multiscale gradient algorithm for image
segmentation using watersheds,” Pattern Recognition, vol. 30,
no. 12, pp. 2043–2052, 1997.
[9] Kim, J.B., Kim, H.J., 2003. Multi-resolution –based
watersheds for efficient image segmentation. Patt.
RecogniLett. 24, 473-488.
DWT decomposition and Soft Thresholding.
October-November 2011
121
ISSN:2249-5789
Nilanjan Dey et al, International Journal of Computer Science & Communication Networks,Vol 1(2), 117-122
[10] J.S. Lee, ” Refined filtering of image noise using
local statistics”,Computer Vision, Graphics, and Image
Processing.
[11] X. Zong, A. F. Laine and E. A. Geiser, ” Speckle
reduction and contrastenhancement of echocardiograms
via multiscale nonlinear processing”,
IEEE Transactions on. Medical Imaging, vol. 17, pp.
532–540, 1998.
[12] S. Beucher, The watershed transformation applied to
image segmentation, presented at 10th Pfefferkorn
Conf. on Signal and Image Processing in
Microscopy and Microanalysis, 1992.
October-November 2011
122