Using neuroimaging to investigate the impact of Mandolean® training in young people with obesity: A pilot randomised controlled trial
Bạn đang xem bản rút gọn của tài liệu. Xem và tải ngay bản đầy đủ của tài liệu tại đây (783.53 KB, 10 trang )
Hinton et al. BMC Pediatrics
(2018) 18:366
/>
RESEARCH ARTICLE
Open Access
Using neuroimaging to investigate the
impact of Mandolean® training in young
people with obesity: a pilot randomised
controlled trial
Elanor C. Hinton1,2* , Laura A. Birch1, John Barton3, Jeffrey M. P. Holly4, Kalina M. Biernacka4, Sam D. Leary1,
Aileen Wilson2, Olivia S. Byrom1 and Julian P. Hamilton-Shield1,3
Abstract
Background: Slowing eating rate using the Mandolean® previously helped obese adolescents to self-select smaller
portion sizes, with no reduction in satiety, and enhanced ghrelin suppression. The objective of this pilot,
randomised trial was to investigate the neural response to food cues following Mandolean® training using
functional Magnetic Resonance Imaging (fMRI), and measures of ghrelin, PYY, glucose and self-reported appetite.
Method: Twenty-four obese adolescents (11–18 years; BMI ≥ 95th centile) were randomised (but stratified by age
and gender) to receive six-months of standard care in an obesity clinic, or standard care plus short-term
Mandolean® training. Two fMRI sessions were conducted: at baseline and post-intervention. These sessions were
structured as an oral glucose tolerance test, with food cue-reactivity fMRI, cannulation for blood samples, and
appetite ratings taken at baseline, 30 (no fMRI), 60 and 90 min post-glucose. As this was a pilot trial, a conservative
approach to the statistical analysis of the behavioural data used Cliff’s delta as a non-parametric measure of effect
size between groups. fMRI data was analysed using non-parametric permutation analysis (RANDOMISE, FSL).
Results: Following Mandolean® training: (i) relatively less activation was seen in brain regions associated with food
cue reactivity after glucose consumption compared to standard care group; (ii) 22% reduction in self-selected
portion size was found with no reduction in post-meal satiety. However, usage of the Mandolean® by the young
people involved was variable and considerably less than planned at the outset (on average, 28 meals with the
Mandolean® over six-months).
Conclusion: This pilot trial provides preliminary evidence that Mandolean® training may be associated with
changes in how food cues in the environment are processed, supporting previous studies showing a reduction in
portion size with no reduction in satiety. In this regard, the study supports targeting eating behaviour in weightmanagement interventions in young people. However, given the variable usage of the Mandolean® during the trial,
further work is required to design more engaging interventions reducing eating speed.
Trial registration: ISRCTN, ISRCTN84202126, retrospectively registered 22/02/2018.
Keywords: Eating rate, Satiety, fMRI, Adolescents, Obesity, Brain
* Correspondence:
This paper is dedicated to the memory of Dr. Olivia S Byrom
1
NIHR Bristol Biomedical Research Centre Nutrition Theme, University of
Bristol, University Hospitals Bristol Education & Research Centre, Upper
Maudlin Street, Bristol BS2 8AE, UK
2
Clinical Research and Imaging Centre (CRICBristol), 60 St Michael’s Hill,
Bristol BS2 8DX, UK
Full list of author information is available at the end of the article
© The Author(s). 2018 Open Access This article is distributed under the terms of the Creative Commons Attribution 4.0
International License ( which permits unrestricted use, distribution, and
reproduction in any medium, provided you give appropriate credit to the original author(s) and the source, provide a link to
the Creative Commons license, and indicate if changes were made. The Creative Commons Public Domain Dedication waiver
( applies to the data made available in this article, unless otherwise stated.
(2018) 18:366
Hinton et al. BMC Pediatrics
Page 2 of 10
Background
Newly reported global childhood obesity levels highlight
the importance of focussing on young people (children
and adolescents) in weight-management research [1].
Encouraging adaptive eating behaviour early may provide young people with additional skills to take into
adulthood, over and above messages of improving diet
and exercise. Indeed, evidence suggests that targeting
eating behaviour may be an effective strategy [2, 3]; for
example, slowing eating rate has been shown to reduce
energy intake [4, 5]. Moreover, a trial of the Mandolean®,
a computerised ‘meal’ weighing device that provides
contemporaneous feedback and purposely trains the participant to eat more slowly over time, be mindful of developing fullness and reduce portion size, demonstrated
a reduction in body mass index (BMI) in obese children
when used in combination with a weight-management
programme [6]. Mandolean® training in young people
was associated with enhanced suppression of ghrelin and
increased PYY post-meal [7], and smaller self-selected
portion sizes with the same post-meal satiety than before
training [6, 7].
Research is increasingly pointing to the utility of neuroimaging techniques, such as food cue-reactivity functional
Magnetic Resonance Imaging (fMRI), to understand the
mechanisms underlying changes following weight-management interventions [8–12]. FMRI food cue-reactivity has
been conducted in the fasted state and following energy intake, e.g. through consumption of a standard meal or a meal
based on individual energy requirements. Oral glucose tolerance tests (consumption of a fixed glucose load/kg) provide a
controlled protocol with known physiological effects with
which to measure the associated neural response to food
cues following energy intake [13, 14]. Previous research has
indicated brain regions involved in the response to food cues
and consumption of glucose to include insula [15], hypothalamus [16], amygdala [17, 18], striatum [11, 19], orbitofrontal
cortex (OFC) [17, 20], and the temporal occipital fusiform
cortex (TOFC) [13, 14]. The neural mechanisms underlying
the changes following Mandolean® training are yet unknown,
leading to the current research question of how such a behavioural intervention to slow eating rate may affect the
neural processing of food cues in the environment.
To address this question, a two-arm pilot randomised
controlled trial was designed, with obese, adolescent patients randomised to receive either Mandolean® training
plus six-months standard care in an obesity clinic, or
six-months standard care. Baseline and post-intervention
oral glucose tolerance tests were conducted, including
measurements of food cue-reactivity fMRI, gastrointestinal hormones and self-reported appetite. The objectives
of this pilot randomised controlled trial were two-fold:
first, to assess the feasibility of conducting a larger-scale
trial of the Mandolean® using changes in fMRI measures
as one of the outcomes (in addition to BMI change). Feasibility outcomes were usage of the Mandolean® (number of
meals consumed using the device), tolerance of the imaging protocol (drop-out rate) and blood sampling protocol (number of patients from whom samples were taken),
and ability to measure imaging signal in the brain regions
of interest. Secondary objectives were to provide preliminary data of the impact of Mandolean® training, which aims
to slow eating rate and reduce portion size, on the neural
response to food cues following glucose consumption in
adolescents with obesity, measured using fMRI.
Materials and methods
Participants
Twenty-four adolescents (11–18 years; BMI ≥ 95th centile) were recruited from the Care of Childhood Obesity
clinic at Bristol Royal Hospital for Children (Table 1).
Exclusion criteria were as follows: diagnosed learning
difficulties, visual or hearing difficulties, dysmorphic features suggestive of syndromic obesity such as Prader–
Willi Syndrome; endocrine disorders; iatrogenic causes
of obesity; MRI contraindications e.g. metal implants,
pregnancy, history of neurological disease, traumatic
brain injury, mental illness, claustrophobia, medications
that may disrupt appetite, weight above 152 kg due to
the limits of the scanner bed, and girth of more than
210 cm (to ensure fit inside the 70 cm diameter bore of
the scanner); vegetarian or vegan (so that the images of
food shown in the cue-reactivity task were not aversive to
participants). Parents gave written informed consent for
their child to participate, and participants gave assent. The
study was approved by the Frenchay NHS Ethics
Table 1 Participant details
Measures
Mandolean+ group
Standard care group
Cliff’s delta (C.I.)
(median (IQR))
Baseline
Post-Intervention Mean % difference (C.I.)a Baseline
Post-Intervention Mean % difference (C.I.)a (Post-Intervention)
N
10
10
10
9
9
9
Age (years)
13.00
(5.00)
13.00 (4.50)
–
13.00
(3.00)
14.00 (4.00)
–
0.08 (−0.50, 0.48)
Gender (M/F)
4/6
4/6
–
3/6
3/6
–
–
BMI SDS
3.31 (0.92)
3.38 (1.07)
−1.16 (−4.17, 1.85)
3.25 (0.51)
3.15 (0.44)
−2.37 (−5.50, 0.76)
0.2 (−0.36, 0.65)
a
Mean % difference within groups: ((Post-Intervention value - Baseline value)/Baseline value)*100
Hinton et al. BMC Pediatrics
(2018) 18:366
Committee (13/SW/0076). The sample size of this
feasibility study was determined through consideration
of the number of potentially eligible participants attending the clinic during the study period and by consulting existing literature reporting pilot feasibility
trials such as this (e.g. [11]).
Study design and measures
Participants were randomised based on age and gender to
receive 6 months of standard care (standard care group), or
standard care plus Mandolean® training (Mandolean+
group). Standard care in the obesity clinic typically comprised two clinic appointments with a clinician, dietitian
and exercise specialist over the six-month period. Participants in the Mandolean® + group received additional training on how to use the device (described elsewhere [6]). In
brief, participants were asked to use the device for their
main meal of the day as many times as possible in the
six-month period. Participants and their parents were given
advice regarding the types of suitable meals (i.e. those eaten
with cutlery) and meals to avoid when using the Mandolean® (e.g. burgers/sandwiches as the food is lifted off the
plate for each mouthful, reducing utility). Participants
placed their empty plate on the Mandolean weighing scale
at the start of the meal. The device then prompted the user
to add food to an individually pre-programmed quantity
and recorded this portion size. The Mandolean then recorded how fast the food was removed from the plate while
the meal was being eaten. The computer audibly prompted
the user to slow down if the food was removed faster than
a pre-specified eating rate in order to ‘train’ the individual
to reduce their speed of eating. The computer also
prompted the subject to rate level of satiety regularly during
the meal (a form of mindfulness of eating). More information about the validation of the device can be found here
[21] ( />At baseline and post-intervention, participants underwent two neuroimaging sessions at Clinical Research
and Imaging Centre (CRICBristol). Sessions involved an
oral glucose tolerance test (75 g glucose in 436 ml drink),
in which the blood oxygen level dependent (BOLD) response during a food cue-reactivity task, appetite ratings,
glucose, ghrelin and PYY levels were measured at baseline and 30- (no BOLD), 60- and 90-min post consumption of the glucose drink. Self-reported appetite (How
hungry/full/thirsty do you feel right now?) was assessed
using 7-point Likert scales, with the end points ‘Not at
all’ and ‘Extremely’. Measurements of height and weight
were taken to calculate BMI SDS at each session.
Using an event-related design, the food cue reactivity
task presented 90 food images and 45 non-food images
(e.g. household objects) for 3 s each; with variable length
null events to provide jitter between images. Images
were slightly offset from the centre of the screen and
Page 3 of 10
participants indicated whether the image was on the left
or right of the screen using a button box inside the scanner. After every 20 food pictures, a feedback trial was
presented to participants based on their responses to the
preceding images, with one of the following messages:
“Well done! Keep going!” (13 or more correct responses); “Well done! Please try to press the correct button for each picture” (between 7 and 12 correct
responses); “Please pay close attention to the pictures
and try to press the correct button” (less than 7/20 correct responses). Food images included sweet and savoury
foods that varied in energy content and incentive value.
Stimuli had previously been independently rated [22],
with food and non-food images matched as closely as possible for size, colours and visual complexity, as per another
previous study [23]. All food images were rated on liking
and familiarity by participants prior to the scan, using an
online survey designed for the study. A differential number of food and non-food images were included in the
analysis to include 45 food images each of high and low
incentive value to the participant (as per (18)).
Following each session, participants in both groups
were asked to consume three meals using the Mandolean® at home. For each meal, the Mandolean® recorded
the self-selected portion size (g), amount consumed (g),
duration of the meal (minutes), and self-reported satiety
at the start of the meal. On a separate sheet, participants
recorded what foods they had consumed, and their
self-reported satiety at the end of the meal. N.B. For
these test meals, the device did not provide a
pre-programmed portion size guide or provide feedback
on eating rate or satiety during the meal.
Blood sample preparation and analysis
Blood samples were collected into aprotinin containing
EDTA tubes, inverted and centrifuged in 4 °C at 2500 rpm
for 15 min. 1 N hydrochloric acid (HCl) and phenylmethylsulfonyl fluoride (PMSF) were added as preservatives.
Plasma samples were kept in − 80 °C until assayed. Total
active ghrelin levels were measured by radioimmunoassay
(RIA) according to protocol recommendations using a
standard curve of known concentration of purified
125I-labeled ghrelin peptide (GHRA-88HK; EMD
Millipore Corporation). No plasma dilution was applied
when measuring ghrelin levels. The coefficient of variance
(CV) for intra-assay variability was 5.2% and the CV for
inter-assay variability was 5.5%. Total PYY levels were
measured by radioimmunoassay (RIA) according to
protocol recommendations using a standard curve of
known concentration of purified 125I-labeled PYY peptide
(PYYT-66HK; EMD Millipore Corporation). No plasma dilution was applied when measuring PYY levels. The coefficient of variance (CV) for intra-assay variability was 3.3%
and inter-assay variability was 7.6%. Plasma glucose levels
Hinton et al. BMC Pediatrics
(2018) 18:366
were obtained using Glucose Assay Kit II (Abnova Corporation, Taiwan). Plasma samples were kept in − 80 °C until
assayed. Plasma samples were diluted 4 times for the best
standard curve fit. The coefficient of variance (CV) for
intra-assay variability for was 4.3% and the CV for
inter-assay variability was 5.2%.
Statistical analysis of behavioural data
As the data were non-normally distributed, a
non-parametric measure of effect size is reported, along
with 95% confidence intervals for the estimate (Cliff ’s
delta, d [24]), calculated using a new Excel macro [25].
Spearman’s Rho is reported for the correlation between
Mandolean® usage and (i) % signal change in striatum
and TOFC post-intervention and (ii) BMI change. Statistical tests were not performed on this data due to a lack
of power in the pilot trial.
fMRI data acquisition and analysis
Neuroimaging took place at CRICBristol on a Siemens 3 T
Magnetom Skyra MRI scanner using a 32-channel head
coil. Functional MR images were acquired in one run
using a BOLD EPI sequence. Details of parameters are as
follows: TR = 2520 ms; TE = 30 ms; flip angle = 90°; FOV =
192; no. of slices = 45 with 25% gap, interleaved; voxel size
= 3 × 3 × 3 mm; phase encoding = A> > P; phase oversampling = 0%; GRAPPA = ON with acceleration factor PE = 2;
bandwidth = 2368 Hz/Px; no. of volumes = 260; duration
= 11:03 min. High resolution structural scan was acquired
(MPRAGE), with the following parameters: TR = 2300 ms;
TE = 2.98 ms; flip angle = 9°; FOV = 256; no. of slices = 192
(3D volume scan); voxel size = 1 × 1 × 1.1 mm; inversion
time = 900 ms; phase oversampling = 0%; GRAPPA = ON
with acceleration factor PE = 2; bandwidth = 240 Hz/Px;
no. of volumes = Single shot; duration = 5:12 min.
Pre-processing and first level analysis of functional images was performed using FMRIBs Expert Analysis Tool
(FEAT) [26]. Standard pre-processing steps were followed:
motion correction using MCFLIRT [27], non-brain removal using BET [28], spatial smoothing using a Gaussian
kernel of FWHM5 mm, mean-based intensity normalisation of all volumes, high-pass temporal filtering. In
addition, the tool ICA-AROMA was utilised to remove
further motion-related artefact from the data [29]. Registration was optimised by using high-resolution field-maps
to correct for distortions in the EPI data [30]. Registration
to high resolution and standard images was carried out
using FMRIB’s Linear Image Registration Tool (FLIRT
[31]), then registration from high resolution structural to
standard space was refined using FNIRT nonlinear registration [32, 33]. At the first level, time-series statistical
analysis was carried out using FMRIBs Improved Linear
Model (FILM) with local autocorrelation correction
(prewhitening) [34] on the each separate scan taken at
Page 4 of 10
baseline, at 60 min post glucose, and at 90 min post glucose. Z statistic images were thresholded using clusters
determined by Z > 2.3 and a (corrected) cluster significance threshold of P = 0.05 [35]. Explanatory variables
were added to the general linear model for each type of
food picture (high incentive food, low incentive food,
non-food), as well as the feedback trials (not analysed further). Contrasts were defined to examine the response to
each image type, the comparison between high and low
incentive foods, and most importantly, the response to
food cues (high and low incentive together) minus the response to non-food cues. These contrast of parameter estimates (COPEs) were subsequently used to perform
second-level group analyses. Contrasts of high and low incentive value did not produce any significant differences,
therefore the group analysis presented below focusses on
the contrast between food and non-food images.
Group-level statistical analysis was conducted with a
masked approach using RANDOMISE, FSL’s tool for nonparametric permutation inference on neuroimaging data
[36]. A priori regions of interest were selected as masks
based on previous literature (see introduction). Bilateral
ROIs were created by thresholding masks from the
Harvard-Oxford Cortical and Subcortical structural atlases
in FSLview, except the hypothalamus mask that was drawn
by hand using the Atlas of the Human Brain [37] as a
guide. The RANDOMISE analysis used the food-non-food
COPE only taken from the first level analyses and transformed into standard space (as described above). First, the
response at baseline was subtracted from (i) the response at
60 min post glucose, and (ii) the response at 90 min post
glucose. These difference images were fed into the RANDOMISE analysis to conduct unpaired t-tests between the
Mandolean® + and standard care groups, using the TFCE
(Threshold-Free Cluster Enhancement) cluster-based analysis option, and a FWE-corrected p values thresholded at
p < 0.05. Cluster and peak data was extracted by masking
the raw stats image with the significant voxels from the corrected stats image, then extracting the cluster information
using the ‘cluster’ command (as recommended on FSL Randomise User guide). The closest to estimates of effect size
in fMRI data is to extract the percentage BOLD signal
change in the regions of interest and plot the values for
each group. As this was a pilot study with a small sample
size, no correction for multiple comparisons has been applied (to account for the number of tests done over masks),
so the results of these analyses should be considered preliminary. (NB. Analysis of the impact of glucose on neural
food cue-reactivity comparing participants of a healthy
weight and obesity is in preparation).
Results
Only those participants with data from both the baseline
and post-intervention session were included in the
Hinton et al. BMC Pediatrics
(2018) 18:366
analyses (except for the Mandolean data in Table 3). The
samples included at each time point (baseline and
post-intervention) are described in Table 1. Five participants disengaged from the study following the first
imaging session (four from Mandolean® + and one from
standard care group) for various reasons (illness, relocation, insufficient time for intervention, lost to follow up).
Feasibility outcomes
Tolerance to the imaging protocol was measured by
drop-out rates from the study. Twenty-four participants began the first imaging session. As described
above, three participants dropped out from the study
due to reasons other than the imaging protocol. Two
participants were lost to follow up, both of whom
struggled with the imaging protocol during the first
session: one needed her mother to be in the magnet
room with her and found keeping still for the MRI
uncomfortable; the other refused to return to the
scanner for the second scan during the first session.
Overall, a high percentage (79%) completed both imaging sessions.
Adherence to the blood sampling protocol was more
challenging. Cannulation was difficult to achieve in this
patient group. 13/24 (54.2%) were cannulated in the
baseline session, of whom eight were cannulated in the
post-intervention session. Therefore, blood samples from
the post-intervention session were analysed for eight
participants only (four in each group; 33.3%).
Usage of the Mandolean® was measured by the
number of meals the device was used during the
intervention period. A median of 28.0 (IQR = 54.5)
meals with usable data over six-months was found,
but with a large range: one participant only recorded
five meals with the device, whereas another recorded
80 meals with the device. Due to problems with the
device, data was not saved for all meals; a problem
that affected 15% meals during the intervention for
the Mandolean+ group. This also affected whether there
was saved test meal data for participants at baseline and/
or post-intervention: 6/19 participants (32%) completed
test meals but the data was not recorded. A further 3/19
participants (16%) did not attempt the post-intervention
test meals.
Ability to measure imaging signal in the brain regions
of interest was investigated through examination of the
first level maps for each participant. These showed that
signal change was observed in the regions of interest in
the brain. There was some signal loss in the OFC (an
area known to be susceptible to artefact due to proximity to air-filled sinuses), but a BOLD response was still
seen in this key area. Field-maps were incorporated into
the processing pipeline such that the data in this and
Page 5 of 10
other regions was corrected for distortions in the magnetic field.
Preliminary results from post-intervention session
The BOLD response to glucose (controlling for fasting
response) during food cue-reactivity was compared
between the Mandolean® + and standard care groups at
baseline and post-intervention separately. No group
differences were found during the baseline scan at 60or 90-min post glucose, as expected. Post-intervention,
signal change in the TOFC and a region of the striatum
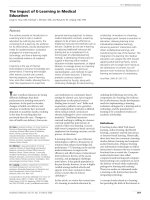
(putamen) 60 min post-glucose relative to fasting between intervention groups is shown in Fig. 1. Both these
regions show greater reactivity to food cues 60 min
post-glucose in the standard care group compared to
the Mandolean® + group. No between-group differences
at 60 min post glucose were found in other masks
(insula, hypothalamus, amygdala and OFC). Activity in
the putamen remained different between groups at 90
min post-glucose, with a cluster of differential activation in the putamen (t = 3.63, MNI brain co-ordinates:
x = 24, y = 10, z = − 2, cluster size = 24 voxels). No
between-group differences at 90 min post glucose were
found in other masks (insula, hypothalamus, amygdala,
OFC and TOFC).
During the post-intervention session, a greater change
in fullness at 60 and at 90 min post-glucose from baseline
in the Mandolean® + group compared to the standard care
group was found, with smaller effect sizes for a difference
in hunger and thirst (Table 2). Preliminary evidence for
ghrelin suppression at 60 and at 90 min post-glucose from
baseline in the Mandolean® + group compared to the
standard care group was found (Table 2).
There was limited difference in BMI standard deviation score post-intervention between groups (Table 1),
and within groups from baseline to post-intervention.
However, 60% of the Mandolean® + group and 78% of
the standard care group reduced their BMI during
the intervention. There was only a 6 g difference in
food intake in the post-intervention test meals between groups (Table 3). However, a 22% reduction in
consumed portion size was identified in the Mandolean® + group (Table 3).
Finally, for the Mandolean® + group only, the relationships between Mandolean® usage and (i) the signal
change in the two brain regions that showed differential
response during the post-intervention scan, and (ii) BMI
change, were investigated. A negative correlation was
found between the number of meals eaten with Mandolean® and (i) signal change 60 min post-glucose compared to baseline in the TOFC (r = − 0.72) and striatum
(r = − 0.29), and (ii) with BMISDS change (r = − 0.37). It
appears that the more meals eaten using Mandolean®,
the less reactivity (signal change) to food cues post
Hinton et al. BMC Pediatrics
(2018) 18:366
Page 6 of 10
a
c
b
d
Fig. 1 Clusters of reduced activation in the Mandolean® + group compared to the standard care group for the contrast between 60 min post-glucose
and baseline in the Post-intervention session. a TOFC t = 3.88, x = 32, y = − 42, z = − 22, cluster size = 16 voxels); b Percentage signal change in the
TOFC; c Putamen t = 4.29, x = 24, y = 24, z = − 4, cluster size = 4 voxels; d Percentage signal change in the putamen
glucose consumption is found, and a slightly greater
reduction in BMI SDS.
Discussion
We present preliminary evidence of a reduction in the
neural response to food cues following glucose consumption in young people with obesity after Mandolean®
training to slow eating rate. Reduced reactivity to food
cues in the TOFC, part of the visual attention stream, in
the Mandolean® + group may represent attenuated visual
attention to food cues [8, 13]; an effect that may be mediated by insulin (e.g. [14]). Indeed, greater insulin levels
have been associated with reduced neural food-cue reactivity in several studies [38, 39], leading to the speculation that insulin levels may be a putative physiological
mechanism by which slowing eating rate impacts on
brain activity and eating behaviour. Due to problems
with cannulation however, it was not possible to measure insulin in the current study, but future work will incorporate additional physiological measurements.
Reduced reactivity post-glucose in the putamen is in
keeping with previous research [14], and may suggest
that responses to the rewarding food has changed for
those in the Mandolean® + group, compared to those in
the standard care group [40]. Indeed, a similar reduction
in striatal response to high calorie food cues post behavioural intervention was found by Deckersbach et al. [11].
Neural reactivity to food cues (nucleus accumbens, also
in reward pathway) has previously been shown to predict
subsequent food intake [23]; therefore it is possible
that, with less reactivity to food cues following energy
intake, the Mandolean® + group may have less motivation to seek out and eat more food. Indeed, Mandolean®
training was associated with a 22% reduction in portion
size with no reduction in post-meal satiety. Strengthening
this result is the link between the intervention and
the BOLD response; specifically, the greater use of
the Mandolean® saw less reactivity to food cues in the
visual attention (TOFC) and reward (putamen) brain
regions.
The feasibility objectives for this pilot trial were
three-fold: to examine usage of the Mandolean®, tolerance of the imaging and blood sampling protocol, and
ability to measure imaging signal in the brain regions of
interest. The number of meals in which the Mandolean®
was used during the intervention period was considerably less than planned at outset. Participants and their
parents/carers commented that the Mandolean® was not
always easy to use: there was no one particular challenge
for participants and their carers; several issues were reported, including limiting the food that could be consumed (in terms of portion size, and type of suitable
meals), requiring diners to eat at a table or near a source
of power, and issues with the equipment. Moreover, one
participant dropped out due to the additional time and
effort to use the Mandolean® at meal times.
The imaging protocol was well tolerated by most participants. All participants agreed to have blood samples during
(2018) 18:366
Hinton et al. BMC Pediatrics
Page 7 of 10
Table 2 OGTT variables
Measures
(median (IQR))
Mandolean+ group
Baseline
Post-Intervention Mean % difference (C.I.)a
Standard care group
Baseline
Post-Intervention Mean % difference (C.I.)a
Cliff’s delta (C.I.)
N with VAS ratings
10
10
10
9
9
9
(Post-Intervention)
Fullness rating (0–7 Likert scale)
Fasting
2.00 (2.00)
3.50 (1.25)
125.93 (−20.02, 271.87)
2.00 (1.50)
3.00 (1.00)
111.11 (32.40, 189.82)
Post glucose
load: 30 mins.
2.00 (3.00)
4.50 (2.50)
b
-70.00 (−173.89, 33.89)
4.00 (2.50)
3.00 (1.00)
b
60 min
1.50 (2.25)
4.00 (1.00)
b
− 100.00 (− 248.41, 48.41)
2.00 (1.50)
3.00 (2.00)
5.00 (1.25)
b
− 112.50 (− 341.02, 116.02)
2.00 (3.50)
90 min
1.00 (2.00)
0.21 (− 0.28, 0.62)
-96.25 (− 146.22, − 46.28)
b
b
− 84.00 (− 189.94, 21.94)
b
4.00 (0.50)
b
− 33.33 (− 119.02, 52.35)
b
0.27 (−0.24, 0.66)
0.46 (− 0.08, 0.79)
0.52 (0.02, 0.82)
Hunger rating (0–7 Likert scale)
Fasting
5.00 (3.50)
1.00 (0.50)
−54.71 (−80.57, − 28.85)
4.00 (1.50)
2.00 (2.00)
−32.33 (− 66.60, 2.16)
0.46 (− 0.78, 0.05)
Post glucose
load: 30 mins.
4.00 (1.50)
1.00 (1.00)
b
− 106.25 (− 121.03, − 91.47) 3.00 (2.50)
1.00 (1.00)
b
45.24 (− 153.10, 243.58)
b
60 min
4.50 (2.75)
1.00 (0.25)
b
− 100.00 (− 153.40, − 46.60) 3.00 (2.00)
1.00 (0.50)
b
− 58.33 (− 165.44, 4.77)
b
1.00 (1.00)
b
− 107.14 (− 148.75, − 65.54) 4.00 (2.00)
1.00 (1.00)
b
− 71.43 (− 184.25, 41.39)
b
90 min
4.00 (3.00)
0.26 (− 0.30, 0.69)
0.23 (− 0.33, 0.67)
0.31 (− 0.26, 0.71)
Thirst rating (0–7 Likert scale)
Fasting
3.00 (1.50)
3.00 (2.00)
− 7.59 (− 48.69, 33.51)
− 63.33 (− 114.86, − 11.80)
Post glucose
load: 30 mins.
2.00 (1.00)
2.00 (3.00)
b
60 min
3.00 (1.00)
2.50 (2.25)
b
− 100.00 (− 252.07, 52.07)
− 33.33 (− 176.76, 110.09)
2.00 (1.50)
−21.85 (−62.00, 18.30)
3.00 (3.00)
4.00 (3.00)
b
− 17.86 (−155.76, 120.04)
b
2.00 (2.00)
3.00 (1.50)
b
− 140.48 (− 217.99, − 62.97)
b
4.00 (2.00)
2.00 (1.50)
b
− 66.67 (− 121.02, − 12.31)
b
4
4
4.00 (2.00)
0.31 (− 0.23, 0.70)
0.58 (− 0.85, − 0.07)
0.26 (− 0.65, 0.25)
90 min
3.00 (1.50)
2.00 (2.25)
b
N with blood
plasma data
5
4
4
5
Fasting
9.80 (8.25)
14.00 (9.90)
69.24 (− 38.24, 176.72)
14.30 (15.50) 12.40 (7.50)
10.49 (−99.79, 120.77)
0.63 (− 0.38, 0.95)
Post glucose
load: 30 mins.
8.75 (6.58)
14.40 (5.50)
− 105.56 (− 271.44, 60.31)
10.60 (15.30) 13.70 (15.00)
94.21 (− 130.27, 318.69)
c
60 min
9.30 (8.20)
10.50 (4.20)
−13.42 (− 220.46, 193.61)
6.90 (6.80)
−78.25 (− 200.61, 44.11)
c
10.05 (6.60)
−7.08 (− 167.01, 152.87)
13.30 (17.95) 10.95 (10.80)
−58.32 (− 237.17, 120.52)
c
0.39 (− 0.77, 0.19)
Ghrelin (pg/ml)
90 min
7.60 (9.10)
13.25 (7.80)
0.13 (− 0.67, 0.78)
0.75 (− 0.97, 0.21)
0.75 (− 0.97, 0.21)
PYY (pg/ml)
Fasting
79.30 (40.75) 79.50 (38.60)
−2.29 (−19.81, 15.23)
63.40 (50.55) 68.75 (73.3)
4.75 (−21.19, 30.70)
0.25 (− 0.61, 0.84)
Post glucose
load: 30 mins.
81.45 (45.33) 83.65 (30.90)
− 174.86 (− 511.86, 162.15)
76.60 (15.95) 82.50 (35.00)
−10.98 (− 48.89, 26.93)
c
60 min
58.20 (28.90) 67.90 (29.70)
−32.74 (− 56.14, − 9.34)
63.20 (23.15) 60.10 (32.40)
−30.02 (− 264.99, 204.95)
c
90 min
55.00 (21.75) 62.70 (27.20)
−30.77 (− 79.01, 17.46)
59.50 (39.20) 83.45 (48.00)
745.41 (− 1610.16, 3100.98)
c
Fasting
6.00 (1.25)
6.4 (0.5)
1.22 (− 21.47, 23.92)
6.24 (0.25)
6.35 (1.48)
1.97 (−16.98, 20.91)
0.06 (− 0.70, 0.76)
Post glucose
load: 30 mins.
10.00 (3.32)
9.55 (2.35)
7.46 (− 64.99, 79.90)
10.40 (4.95)
9.05 (3.52)
−87.53 (− 234.61, 59.54)
c
60 min
10.30 (5.20)
8.45 (1.60)
19.20 (− 200.77, 239.17)
7.30 (2.30)
7.75 (2.03)
−30.16 (− 283.69, 223.36)
c
90 min
8.40 (0.95)
8.01 (2.45)
−11.83 (− 118.84, 95.18)
8.20 (2.35)
7.3 (2.25)
−104.87 (− 367.08, 157.33)
c
0.13 (− 0.80, 0.69)
0.25 (− 0.61, 0.84)
0.50 (− 0.92, 0.43)
Glucose
0.51 (− 0.43, 0.92)
0.94 (0.35, 1.00)
0.38 (− 0.52, 0.88)
a
Mean % difference within groups: ((Post-Intervention value - Baseline value)/Baseline value)*100
b
calculated on change from baseline scores
c
calculated on % change from baseline scores
the study consent/assent process. One volunteer decided
not to take part as they were not prepared to have the
blood samples taken, suggesting our informed consent/
assent procedures were valid. However, it was extremely
difficult to cannulate this group of obese adolescents. Samples were taken from 57% participants at the baseline scan
(seven Mandolean® + group and six in standard care group)
and only 42% at the post-intervention scan (four in each
group). Finally, examination of the first-level brain maps
for each participant showed that the imaging signal in the
brain regions of interest could be measured. However,
planned analyses of the relationship between the BOLD response and levels of glucose, ghrelin and PYY were not
possible, due to the problems with cannulation as reported
above. For the above reasons, this pilot study will not be
scaled up to a full trial.
(2018) 18:366
Hinton et al. BMC Pediatrics
Page 8 of 10
Table 3 Mandolean test meal variables
Measures
Mandolean+ group
Standard care group
Cliff’s delta (C.I.)
(median (IQR))
b
b
Post-Intervention Mean % difference (C.I.) (Post-Intervention)
Baseline
Post-Intervention Mean % difference (C.I.) Baseline
N with test
meal data
7
Meal Duration 10.17 (6.17)
(min)
4
2
9
7
7
6.86 (7.55)
−3.46 (− 20.24, 13.33)
6.30 (1.36)
6.33 (1.84)
4.00 (− 15.68, 23.68)
0.57 (− 0.23, 0.91)
Portion
weight (g)
473.00 (256.67) 294.00 (336.84)
−22.50 (−104.21, 59.22)
302.00 (58.65) 304.33 (137.59)
−12.02 (− 33.28, 9.23)
0 (−0.69, 0.69)
Meal portion
consumed (g)
342.00 (159.00) 250.67 (309.88)
−14.40 (− 155.87, 127.07) 283.00 (71.53) 260.67 (163.67)
−13.61 (− 33.58, 6.35)
0.07 (−0.72, 0.65)
Eating rate
(g/min)
33.81 (16.88)
34.10 (15.81)
−11.47 (− 142.58, 119.65) 48.10 (9.16)
41.23 (14.05)
−15.20 (−39.08, 8.68)
0.64 (−0.93, 0.12)
Premeal
satiety (VASa)
22.67 (13.84)
18.92 (16.55)
−70.51 (− 191.28, 50.27)
39.67 (34.79)
26.84 (28.42)
−20.84 (−64.74, 23.06)
0.75 (−0.97, 0.13)
Postmeal
satiety (VASa)
58.67 (33.75)
51.09 (52.29)
−14.06 (−40.24, 12.12)
47.00 (52.02)
56.67 (14.00)
130.22 (− 144.10, 404.54) 0 (−0.69, 0.69)
a
b
where 0 is not at all full, and 100 is extremely full)
Mean % difference within groups: ((Post-Intervention value - Baseline value)/Baseline value)*100
The main limitation of this study is the sample size. The
planned sample size meant that it was not appropriate to
perform statistical tests of differences between groups for
the behavioural data, but confidence intervals for the effect sizes were included to allow interpretation at the
population level. The sample size for some statistical comparisons was reduced further due to missing data due to
problems with blood sampling, and data recording and
collection issues with the equipment itself.
It should also be noted that there was minimal change
in BMI (SDS) in both groups. However, as the intervention was conducted over a short period of 6 months, this
result was not unexpected. A shorter, less intense intervention was chosen compared to the previous full RCT
that was conducted over twelve months [6] to test the
fMRI trial format rather than assess Mandolean® effects
on weight loss. However, our findings suggest that
Mandolean® training is more effective with additional
support (a dedicated support nurse) aiding continued
usage for a longer period (twelve rather than 6 months).
The lack of large differences in BMI (SDS)
post-intervention did allow the analysis of the neuroimaging and hormonal data to be conducted without confounding differences in BMI.
We acknowledge that we are unable to determine
which component of Mandolean® training is responsible
for the observed differences to standard care. There
are elements of the training process that address meal
portion size, rating of satiety during that meal and speed
of food consumption on a daily basis. In addition, by
choosing a simple food-cue reactivity paradigm for this
study there are no direct behavioural correlates from this
design (participants were not required to choose a
portion size, eat a meal or rate their fullness during the
scan itself ). The advantage of this approach however,
was to have an objective measure of food reactivity
that is in line with a wealth of existing research with
which to compare the effects of this behavioural
intervention.
Conclusion
In conclusion, this study provides preliminary evidence
of a change in the neural response to food cues in young
people with obesity after Mandolean® training to slow
eating rate. These neural changes were associated with
greater usage of the Mandolean®, suggesting that the
more meals eaten using the Mandolean®, the greater the
reduction in signal change was found in brain regions
subserving visual attention and food reward in response
to food cues. The implication of these neuroimaging
findings is that this behavioural intervention leads to
changes in the way in which individuals process food
cues in the environment: by paying less attention to food
cues and finding them less rewarding, individuals may
be less motivated to find and eat those foods. Future
work may include more imaging timepoints to allow investigation of the longevity of fMRI changes following
such a behavioural intervention. Mandolean training
was also associated with a reduction in portion size
with no change in post-meal satiety, corroborating
findings from the previous full trial (3). However, due
to issues with the data collection and recording of
both the blood samples and Mandolean data®, it was
decided not to scale this small fMRI study to a full
trial. Overall, this pilot trial supports targeting eating
behaviour in weight-management interventions in young
people [2, 3, 5], who are more susceptible to food cues,
especially if overweight [41].
Hinton et al. BMC Pediatrics
(2018) 18:366
Acknowledgements
We thank all the participants and their parents, as well as Jon Brooks and
Ron Hartley-Davis at CRICBristol for analysis advice. We also thank Amanda
Chong, Lucy Tucker, Meghan Good and Shelley Easter for their help with this
project, and to Fiona Lithander for advice on the manuscript. The views
expressed are those of the authors and not necessarily those of the NHS, the
NIHR or the Department of Health.
Funding
This project was funded by The National Institute for Health Research
Biomedical Research Unit in Nutrition, Diet and Lifestyle at University
Hospitals Bristol NHS Foundation Trust and the University of Bristol. For part
of the project, ECH was funded by the Elizabeth Blackwell Institute for Health
Research and the Wellcome Trust Institutional Strategic Support Fund to the
University of Bristol. The funders were not involved in the conduct of the
research or preparation of the article.
Availability of data and materials
The datasets used and/or analysed during the current study are currently
available from the corresponding author on request, whilst they are under
preparation for submission to a public repository.
Page 9 of 10
5.
6.
7.
8.
9.
10.
11.
Authors’ contributions
ECH and JHS conceived the experiments. ECH, LB, OB, JB, JHS and AW
carried out experiments, ECH, SL, KB, JH analysed data. All authors were
involved in writing the paper and had final approval of the submitted and
published versions.
Ethics approval and consent to participate
The study was approved by the Frenchay NHS Ethics Committee (13/SW/0076).
Parents gave informed consent for their child to participate, and participants
gave assent.
12.
13.
14.
Consent for publication
Not applicable.
Competing interests
The authors declare that they have no competing interest.
15.
Publisher’s Note
16.
Springer Nature remains neutral with regard to jurisdictional claims in
published maps and institutional affiliations.
17.
Author details
1
NIHR Bristol Biomedical Research Centre Nutrition Theme, University of
Bristol, University Hospitals Bristol Education & Research Centre, Upper
Maudlin Street, Bristol BS2 8AE, UK. 2Clinical Research and Imaging Centre
(CRICBristol), 60 St Michael’s Hill, Bristol BS2 8DX, UK. 3Department of
Paediatric Endocrinology and Diabetes, Bristol Royal Hospital for Children,
Upper Maudlin Street, Bristol, UK. 4School of Translational Health Sciences,
IGFs and Metabolic Endocrinology, University of Bristol, Second Floor,
Learning and Research, Southmead Hospital, Westbury-on-Trym, Bristol BS10
5NB, UK.
18.
19.
20.
Received: 23 February 2018 Accepted: 12 November 2018
21.
References
1. (NCD-RisC) NRFC. Worldwide trends in body-mass index, underweight,
overweight, and obesity from 1975 to 2016: a pooled analysis of 2416
population-based measurement studies in 128·9 million children,
adolescents, and adults. Lancet. 2017 In press.
2. Carnell S, Benson L, Pryor K, Driggin E. Appetitive traits from infancy to
adolescence: using behavioral and neural measures to investigate obesity
risk. Physiol Behav. 2013;121:79–88.
3. Porter L, Verbruggen F, Javaid M, Lawrence NS. Beating temptation: the use
of computerised inhibition training to combat child obesity. Appetite. 2016;
107:689.
4. Robinson E, Almiron-Roig E, Rutters F, de Graaf C, Forde CG, Tudur Smith C,
Nolan SJ, Jebb SA. A systematic review and meta-analysis examining the
22.
23.
24.
25.
effect of eating rate on energy intake and hunger. Am J Clin Nutr. 2014;
100(1):123–51.
Zandian M, Ioakimidis I, Bergstrom J, Brodin U, Bergh C, Leon M, Shield J,
Sodersten P. Children eat their school lunch too quickly: an exploratory
study of the effect on food intake. BMC Public Health. 2012;12:351.
Ford AL, Bergh C, Sodersten P, Sabin MA, Hollinghurst S, Hunt LP, Shield JP.
Treatment of childhood obesity by retraining eating behaviour: randomised
controlled trial. Bmj. 2010;340:b5388.
Galhardo J, Hunt LP, Lightman SL, Sabin MA, Bergh C, Sodersten P, Shield
JP. Normalizing eating behavior reduces body weight and improves
gastrointestinal hormonal secretion in obese adolescents. J Clin Endocrinol
Metab. 2012;97(2):E193–201.
Murdaugh DL, Cox JE, Cook EW 3rd, Weller RE. fMRI reactivity to highcalorie food pictures predicts short- and long-term outcome in a weightloss program. NeuroImage. 2012;59(3):2709–21.
Rosenbaum M, Sy M, Pavlovich K, Leibel RL, Hirsch J. Leptin reverses weight
loss-induced changes in regional neural activity responses to visual food
stimuli. J Clin Invest. 2008;118(7):2583–91.
Ochner CN, Kwok Y, Conceicao E, Pantazatos SP, Puma LM, Carnell S, Teixeira J,
Hirsch J, Geliebter A. Selective reduction in neural responses to high calorie
foods following gastric bypass surgery. Ann Surg. 2011;253(3):502–7.
Deckersbach T, Das SK, Urban LE, Salinardi T, Batra P, Rodman AM,
Arulpragasam AR, Dougherty DD, Roberts SB. Pilot randomized trial
demonstrating reversal of obesity-related abnormalities in reward system
responsivity to food cues with a behavioral intervention. Nutr Diabetes.
2014;4:e129.
Carnell S, Gibson C, Benson L, Ochner CN, Geliebter A. Neuroimaging and
obesity: current knowledge and future directions. Obes Rev. 2012;13(1):43–56.
Heni M, Kullmann S, Ketterer C, Guthoff M, Bayer M, Staiger H, Machicao F,
Häring H, Preissl H, Veit R, et al. Differential effect of glucose ingestion on
the neural processing of food stimuli in lean and overweight adults. Hum
Brain Mapp. 2014;35(3):918–28.
Kroemer NB, Krebs L, Kobiella A, Grimm O, Vollstadt-Klein S, Wolfensteller U,
Kling R, Bidlingmaier M, Zimmermann US, Smolka MN. (Still) longing for
food: insulin reactivity modulates response to food pictures. Hum Brain
Mapp. 2013;34(10):2367–80.
Brooks SJ, Cedernaes J, Schioth HB. Increased prefrontal and parahippocampal
activation with reduced dorsolateral prefrontal and insular cortex activation to
food images in obesity: a meta-analysis of fMRI studies. PLoS One.
2013;8(4):e60393.
Matsuda M, Liu Y, Mahankali S, Pu Y, Mahankali A, Wang J, DeFronzo R, Fox
P, Gao J. Altered hypothalamic function in response to glucose ingestion in
obese humans. Diabetes. 1999;48(9):1801–6.
Arana FS, Parkinson JA, Hinton E, Holland AJ, Owen AM, Roberts AC.
Dissociable contributions of the human amygdala and orbitofrontal
cortex to incentive motivation and goal selection. J Neurosci. 2003;
23(29):9632–8.
Hinton EC, Parkinson JA, Holland AJ, Arana FS, Roberts AC, Owen AM.
Neural contributions to the motivational control of appetite in humans. Eur
J Neurosci. 2004;20(5):1411–8.
Sayer R, Tamer G Jr, Chen N, Tregellas J, Cornier M, Kareken D, Talavage T,
McCrory M, Campbell W. Reproducibility assessment of brain responses to
visual food stimuli in adults with overweight and obesity. Obesity. 2017;
24(10):2057–63.
Burger KS, Berner LA. A functional neuroimaging review of obesity,
appetitive hormones and ingestive behavior. Physiol Behav. 2014;136:121–7.
Ioakimidis I, Zandian M, Bergh C, Sodersten P. A method for the control of
eating rate: a potential intervention in eating disorders. Behav Res Methods.
2009;41(3):755–60.
Beaver JD, Lawrence AD, van Ditzhuijzen J, Davis MH, Woods A, Calder AJ.
Individual differences in reward drive predict neural responses to images of
food. J Neurosci. 2006;26(19):5160–6.
Lawrence NS, Hinton EC, Parkinson JA, Lawrence AD. Nucleus accumbens
response to food cues predicts subsequent snack consumption in women
and increased body mass index in those with reduced self-control.
NeuroImage. 2012;63(1):415–22.
Cliff N. Dominance statistics: ordinal analyses to answer ordinal questions.
Psychol Bull. 1993;114:494–509.
Goedhart J. Calculation of a distribution free estimate of effect size and
confidence intervals using VBA/excel. In: bioRxiv; 2016. />1101/073999.
Hinton et al. BMC Pediatrics
(2018) 18:366
26. Woolrich MW, Jbabdi J, Patenaude B, Chappell M, Makni S, Behrens TE,
Beckmann CF, Jenkinson M, Smith SM. Bayesian analysis of neuroimaging
data in FSL. NeuroImage. 2009;45:S173–86.
27. Jenkinson M, Bannister P, Brady M, Smith S. Improved optimization for the
robust and accurate linear registration and motion correction of brain
images. NeuroImage. 2002;17(2):825–41.
28. Smith SM. Fast robust automated brain extraction. Hum Brain Mapp. 2002;
17(3):143–55.
29. Pruim R, Mennes M, van Rooij D, Llera A, Buitelaar J, Beckmann C. ICAAROMA: a robust ICA-based strategy for removing motion artifacts from
fMRI data. Neuro Image. 2015;112:267–77.
30. Greve DN, Fischl B. Accurate and robust brain image alignment using
boundary-based registration. NeuroImage. 2009;48(1):63–72.
31. Jenkinson M, Smith S. A global optimisation method for robust affine
registration of brain images. Med Image Anal. 2001;5(2):143–56.
32. Andersson J, Jenkinson M, Smith S. Non-linear optimisation. Oxford: FMRIB
technical report; 2007. />tr07ja1.pdf.
33. Andersson J, Jenkinson M, Smith S. Non-linear registration, aka spatial
normalisation. Oxford: FMRIB technical report; 2007. .
uk/datasets/techrep/tr07ja1/tr07ja1.pdf.
34. Woolrich MW, Ripley BD, Brady M, Smith SM. Temporal autocorrelation in
univariate linear modeling of FMRI data. NeuroImage. 2001;14(6):1370–86.
35. Worsley KJ. Statistical analysis of activation images. Oxford: OUP; 2001.
/>36. Winkler AM, Ridgway GR, Webster MA, Smith SM, Nichols TE. Permutation
inference for the general linear model. NeuroImage. 2014;92:381–97.
37. Mai J, Paxinos G, Voss T. Atlas of the human brain. 3rd ed. Oxford: Academic
Press; 2008. />38. Guthoff M, Grichisch Y, Canova C, Tschritter O, Veit R, Hallschmid M, Haring
HU, Preissl H, Hennige AM, Fritsche A. Insulin modulates food-related
activity in the central nervous system. J Clin Endocrinol Metab. 2010;95(2):
748–55.
39. Rotte M, Baerecke C, Pottag G, Klose S, Kanneberg E, Heinze HJ, Lehnert H.
Insulin affects the neuronal response in the medial temporal lobe in
humans. Neuroendocrinology. 2005;81(1):49–55.
40. Pursey KM, Stanwell P, Callister RJ, Brain K, Collins CE, Burrows TL.
Neural responses to visual food cues according to weight status: a
systematic review of functional magnetic resonance imaging studies.
Front Nutr. 2014;1:7.
41. van Meer F, van der Laan LN, Charbonnier L, Viergever MA, Adan RAH,
Smeets PAM. Developmental differences in the brain response to
unhealthy food cues: an fMRI study of children and adults. Am J Clin
Nutr. 2016;104:1515–22.
Page 10 of 10